Copyright
©2013 Baishideng Publishing Group Co.
World J Methodol. Dec 26, 2013; 3(4): 45-64
Published online Dec 26, 2013. doi: 10.5662/wjm.v3.i4.45
Published online Dec 26, 2013. doi: 10.5662/wjm.v3.i4.45
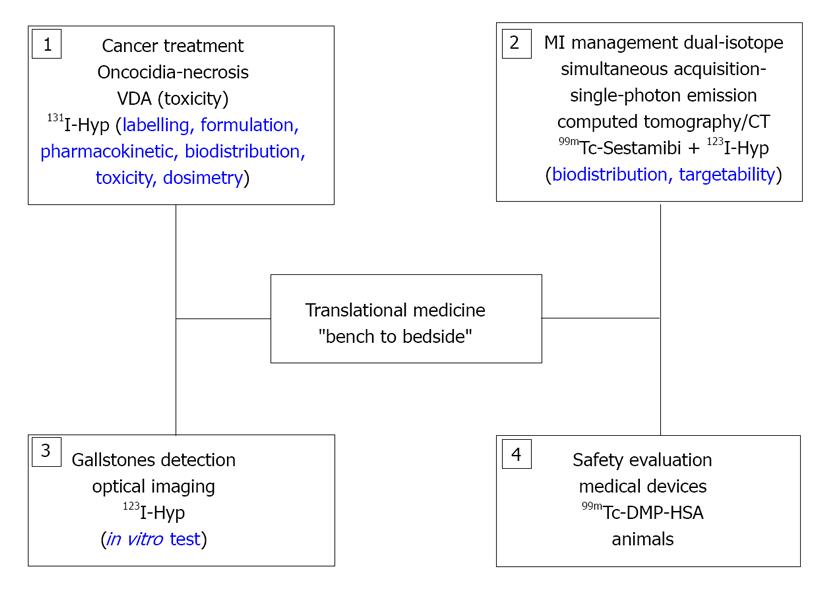
Figure 1 Schematic structure of the translational research activities covered by the overview article.
99mTc-sestamibi: Technetium-99m labeled-hexakis (2-methoxyisobutylisonitrile); 99mTcDMP-HSA: Technetium-99m dimercaptopropionyl human serum albumin; 123/131I-Hyp: Iodine-123/iodine-131 labeled monoiodohypericin; MI: Myocardial infarction; VDA: Vascular disrupting agent.
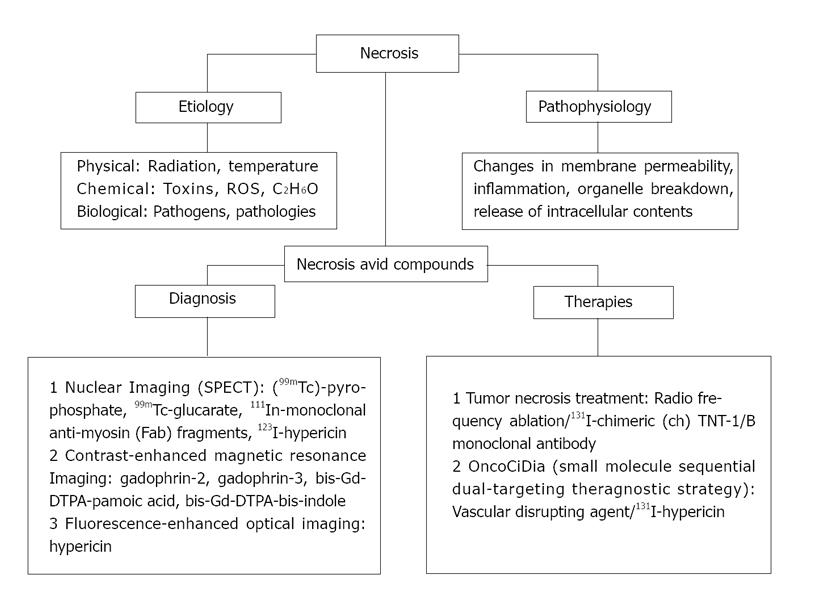
Figure 2 Flow diagram of the included research topics.
99mTc: Technetium-99m; 111In: indium-111; 123I: Iodine-123; 131I: Iodine-131; C2H6O: Ethanol; DTPA: Diethylene triamine pentaacetic acid; Fab: Antigen-binding fragment; Gd: Gadolinium; ROS: Reactive oxygen species; SPECT: Single photon emission computed tomography; TNT: Tumor necrosis treatment.
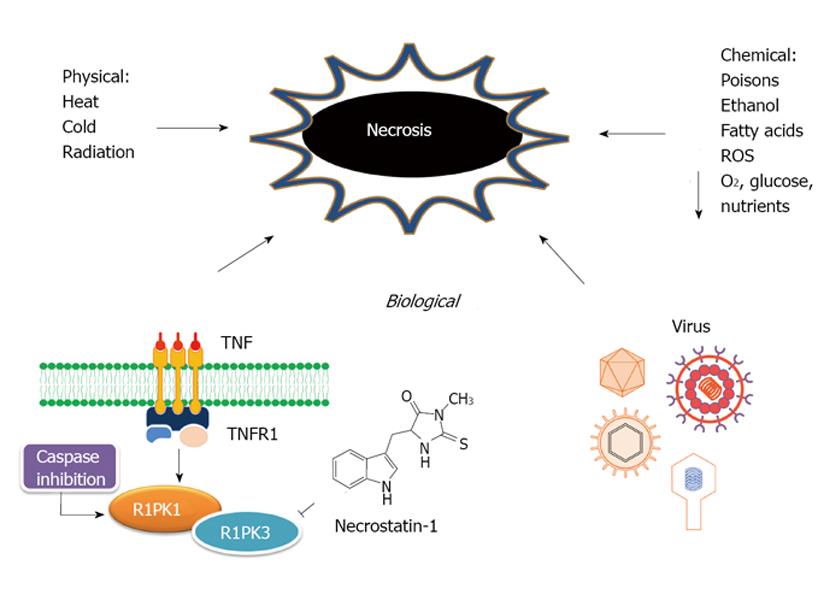
Figure 3 Schematic representation of the etiology of necrosis.
ROS: Reactive oxygen species; TNT: Tumor necrosis treatment; RIPK1/3: Receptor-interacting protein kinase 1 and 3; TNFR1: Tumor-necrosis factor receptors 1.
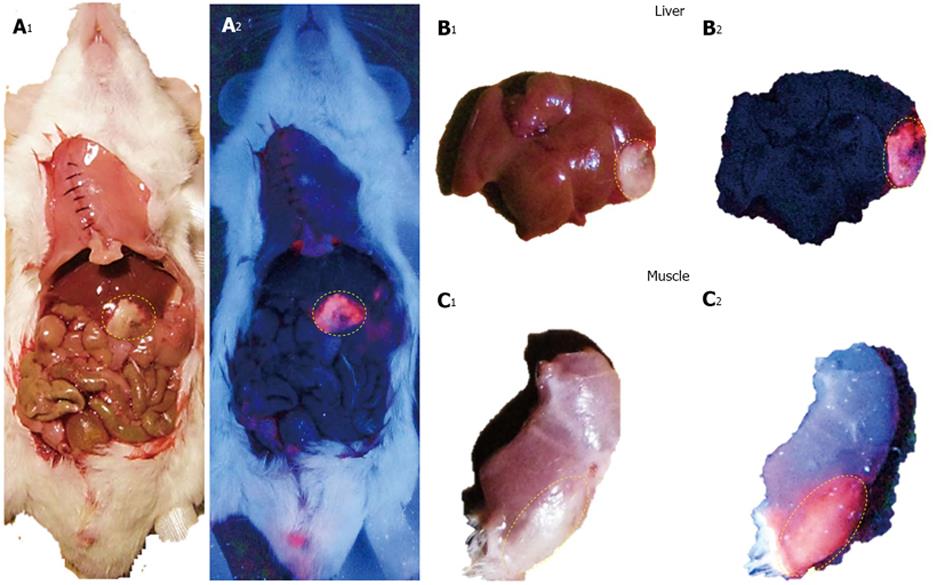
Figure 4 Macroscopic digital imaging of a mouse with acute ethanol-induced necrosis in the liver and muscle having received 5.
0 mg/kg hypericin in DMSO/PEG400/water (25:60:15, v/v/v). Under normal tungsten light, viable liver, intestines and muscle show normal appearances whereas hepatic infarction and muscle necrosis appear as white cheesy tissue (A1, B1, C1). With a UV light of 254 nm, a bright red fluorescence from liver (A2, B2) and muscle necrosis (C2) but a lack of fluorescent signal from the liver (A2, B2), viable muscle (C2) and other abdominal structures were observed (A2). DMSO: Dimethyl sulfoxide; PEG400: Polyethylene glycol 400; UV: Ultraviolet.
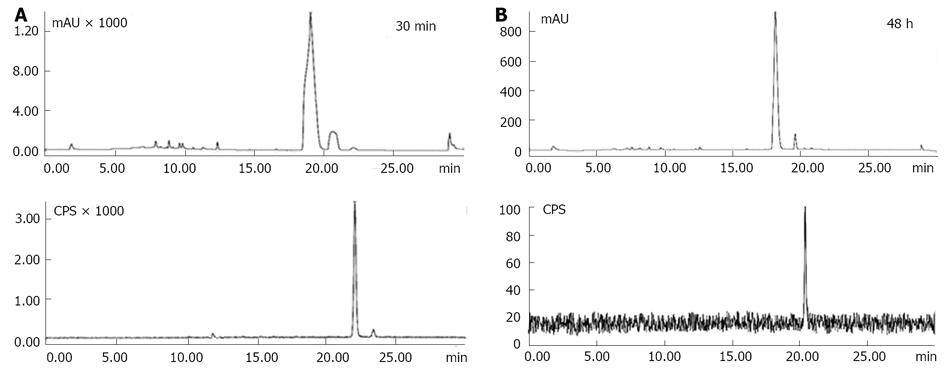
Figure 5 High performance liquid chromatographic analysis of the non-purified iodine-123 labeled hypericin with Ultraviolet (254 nm) and radiometric detection.
A: Ultraviolet-chromatogram of the starting reagent hypericin (Hyp) with a retention time of 19.18 min (upper part) and radiochromatogram (lower part) of 123I-Hyp eluting at 22.13 min with a mean radiochemical yield of 95.4%; B: High performance liquid chromatographic analysis of the non-purified 123I-Hyp at 48 h after labeling. A single narrow peak coming out at 21.90 min (lower part) suggests the in vitro stability of 123I-Hyp over time. CPS: Count per second.
Figure 6 Post-mortem analysis of infarcts and viable heart tissues from rabbits with acute reperfused myocardial infarction having intravenously received iodine-123 labeled hypericin/hypericin dissolved in a 0.
07 mol/L solution of the liver-produced surfactant sodium cholate. A: A typical autoradiogram of 50-μm-thick sections reveals higher tracer uptake in infarction than in viable myocardium. The color code bar indicates the coding scheme for the radioactivity; B: Microscopic images of 50-μm-thick sections confirm the selective affinity of the highly fluorescent iodine-123-labeled-hypericin/hypericin for acute myocardial infarction in contrast to the low fluorescent signal found in viable myocardium; C: The H and E-stained section corroborates the location of the viable myocardium tissue and the presence of myocardial necrosis characterized by scattered hemorrhage.
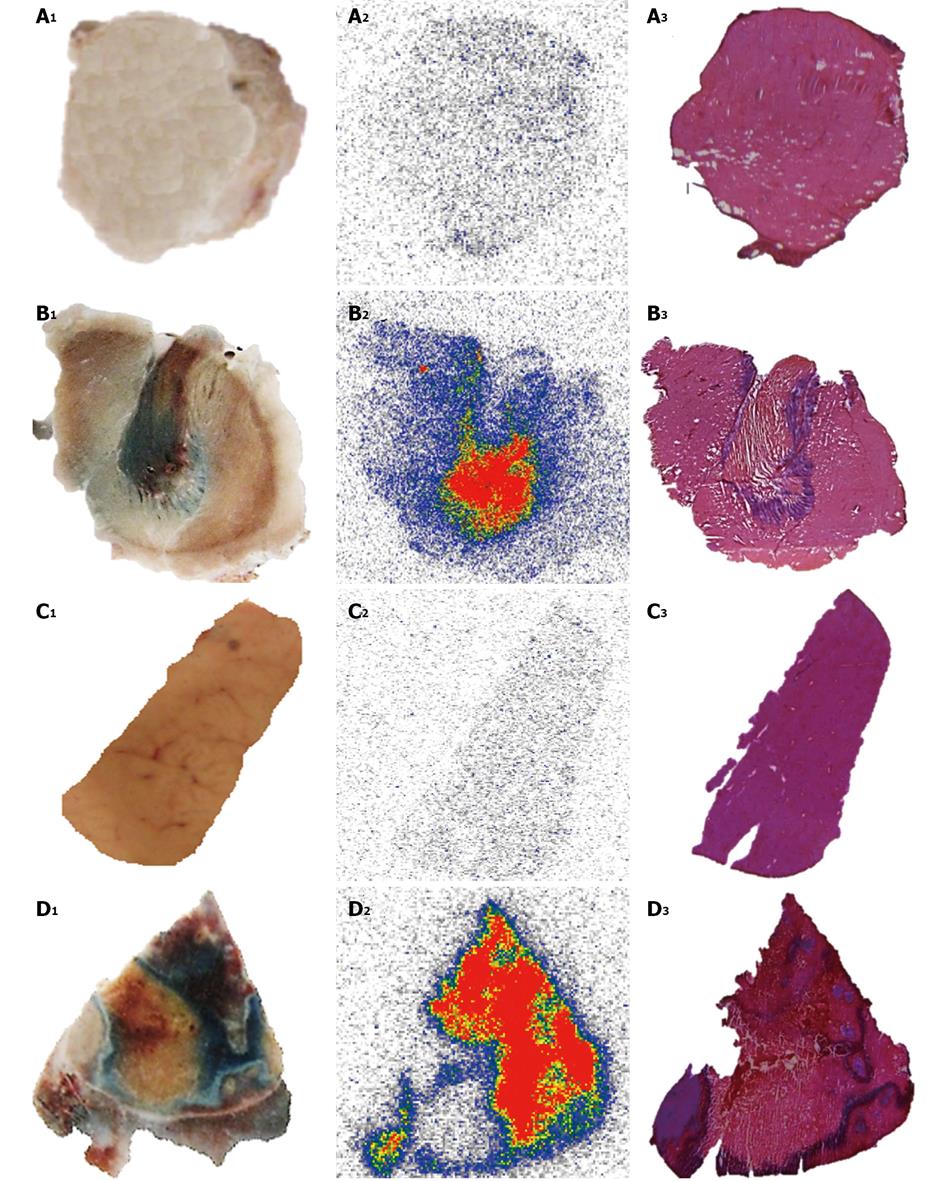
Figure 7 Post-mortem study of necrotic and viable tissues in the liver and muscle from animal models either of reperfused partial liver infarction or ethanol-induced muscle necrosis pre-injected with iodine-123 labeled hypericin/hypericin followed by 1% Evans blue solution.
A, B: Muscle; C, D: Liver. The hepatic infarction (A1) and necrotic muscle (B1) retain Evans blue as blue hyper intense areas, with viable liver (C1) and normal muscle (D1) without staining. Autoradiograms of 50-μm-thick sections show high tracer uptake in hepatic infarction (A2) and muscle necrosis (B2) but low accumulation either in viable liver (C2) or muscle (D2). The color code bar represents the code for the radioactivity concentration. By histology, the presence of hepatic infarction (A3) and muscle necrosis (B3) and the location of the viable liver (C3) and muscle (D3) tissues are verified.
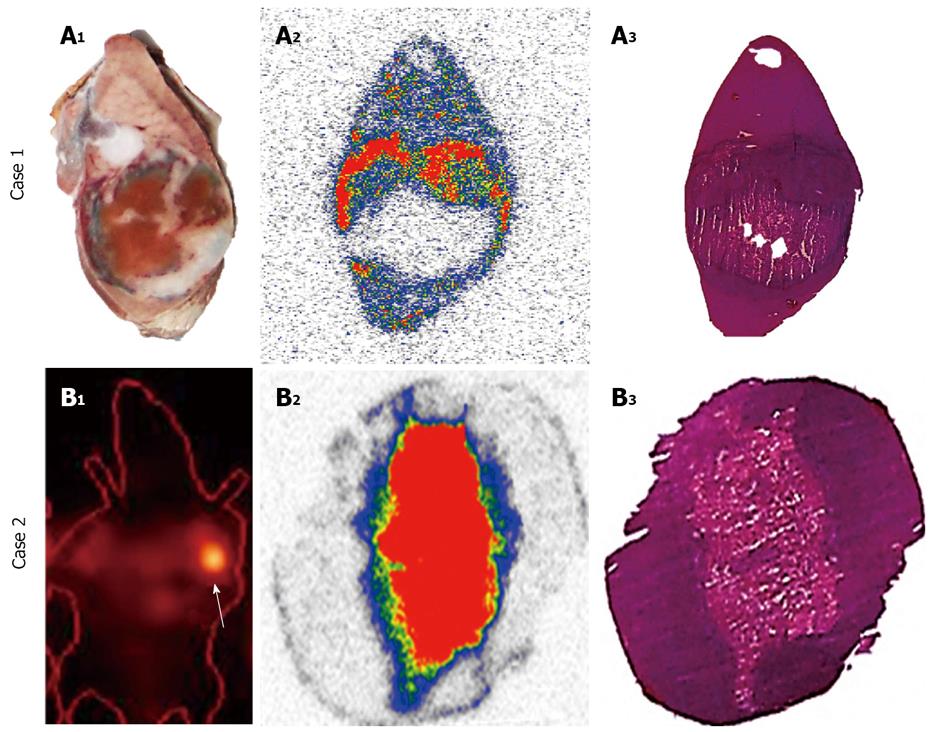
Figure 8 Difference in accumulation patterns of iodine-123/131 labeled hypericin/hypericin in tumor necrosis over time.
Case 1: Ex-vivo analysis of necrotic tumors from rats with hepatic rhabdomyosarcoma (R1) in the first 24 h after the administration of iodine-123 labeled hypericin/hypericin (123I-Hyp/Hyp) in DMSO/PEG 400/propylene glycol/water (25:25:25:25, v/v/v/v) followed by 1% Evans blue solution. At 24 h after 123I-Hyp/Hyp injection, the tumor necrosis is perfectly outlined by the Evans blue as a blue rim, with viable tumor residues and normal liver with almost no staining (A1). On the autoradiogram, a perfect match was seen between the high levels of 123I-Hyp/Hyp accumulated in the ring (A2) and the rim of Evans blue previously observed (A1). Histology analysis confirms the regions of the liver, necrotic and viable tumors (A3). Case 2: Single-photon emission computed tomography (SPECT), autoradiograms and histology in severe combined immunodeficiency mice bearing bilateral radiation-induced fibrosarcoma-1 subcutaneously having received combretastatin A-4 phosphate (CA4P) to induce tumor necrosis followed 24 h later by 131I-Hyp/Hyp in DMSO/PEG 400/water (25:60:15, v/v/v). Twelve days after 131I-Hyp/Hyp administration, SPECT detects a persistent intense high radioactivity mainly inside the tumor necrotic core (arrow). Autoradiography (B2)1 and histology (B3) of the tumor after 30 d of tracer injection correspond well with the hotspot imaging on tumor (B1). 1The color code bar indicates the coding scheme for the radioactivity. DMSO: Dimethyl sulfoxide; PEG 400: Polyethylene glycol 400.
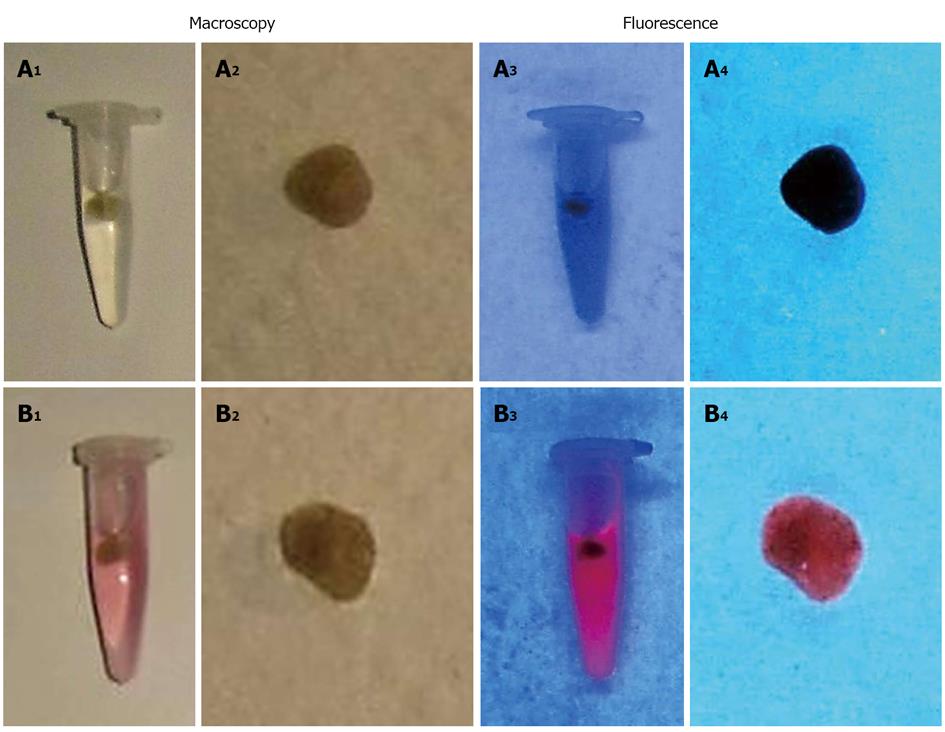
Figure 9 Macroscopic digital imaging of gallbladder stones which were extracted from patients.
Stones previously incubated in DMSO/PEG400/water (25:60:15, v/v/v) for 72 h and set as control (A1, A2) lack of fluorescent properties (A3, A4). Stones treated for 72 h with a solution of Hyp in DMSO/PEG400/water (25:60:15, v/v/v) (B1, B2) reveals fluorescence (B3, B4) under the UV light of 254 nm. DMSO: Dimethyl sulfoxide; PEG 400: Polyethylene glycol 400; UV: Ultraviolet.
- Citation: Cona MM, Witte P, Verbruggen A, Ni Y. An overview of translational (radio)pharmaceutical research related to certain oncological and non-oncological applications. World J Methodol 2013; 3(4): 45-64
- URL: https://www.wjgnet.com/2222-0682/full/v3/i4/45.htm
- DOI: https://dx.doi.org/10.5662/wjm.v3.i4.45


