Copyright
©The Author(s) 2021.
World J Methodol. Jan 20, 2021; 11(1): 1-14
Published online Jan 20, 2021. doi: 10.5662/wjm.v11.i1.1
Published online Jan 20, 2021. doi: 10.5662/wjm.v11.i1.1
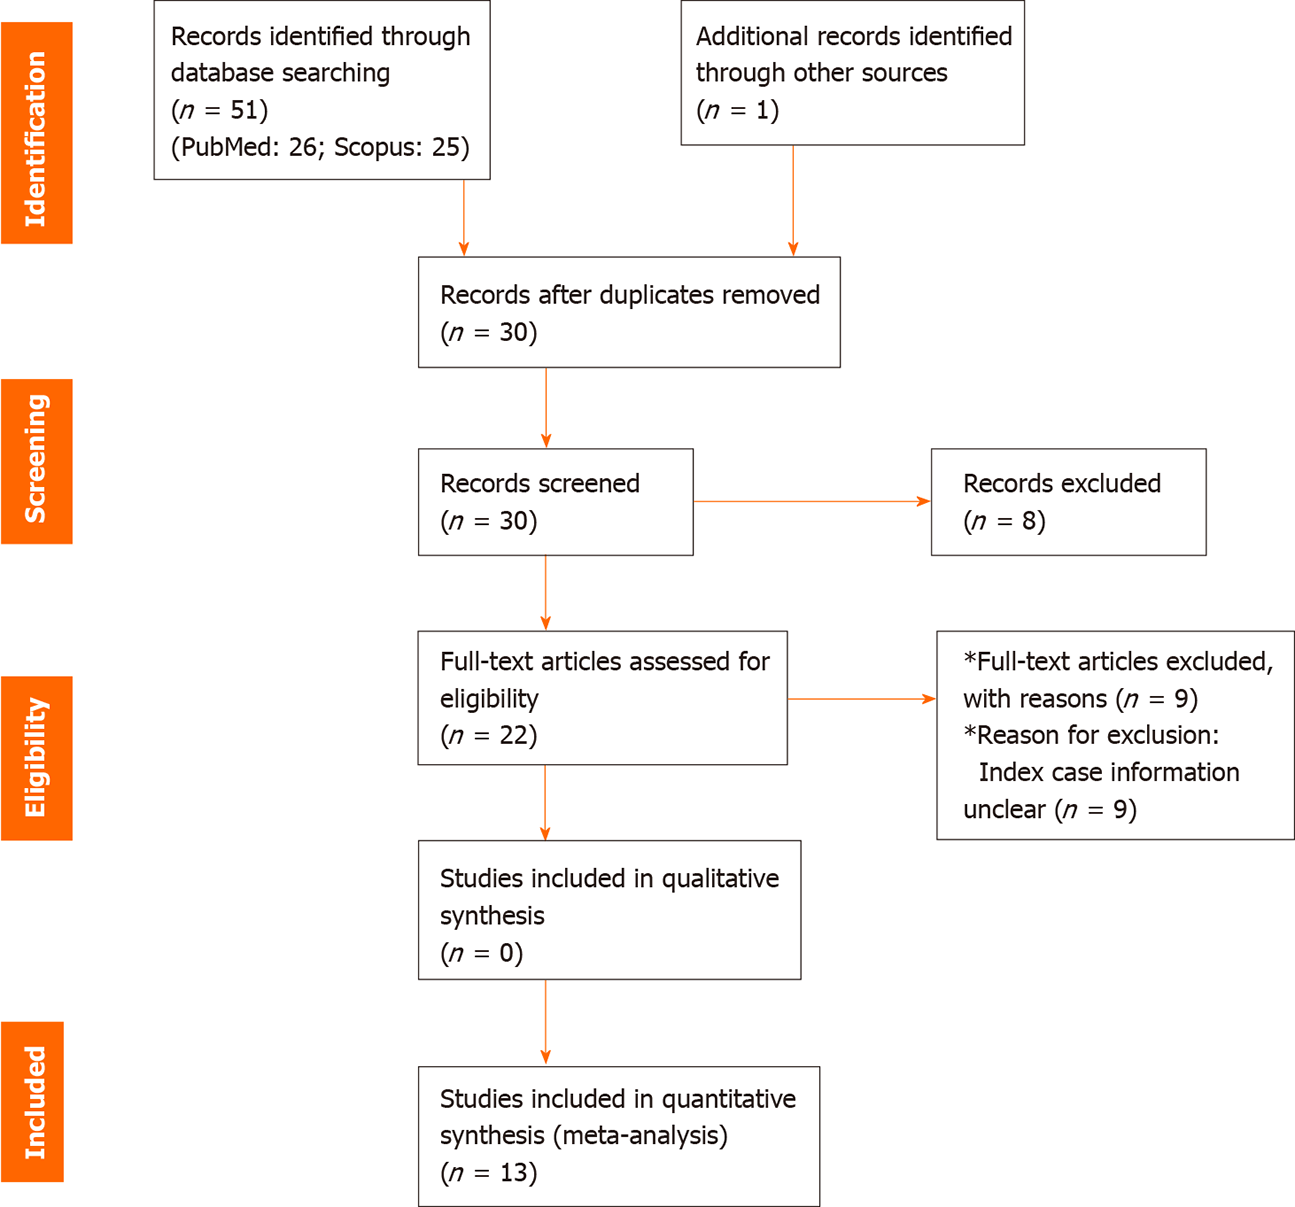
Figure 1 PRISMA diagram[9].
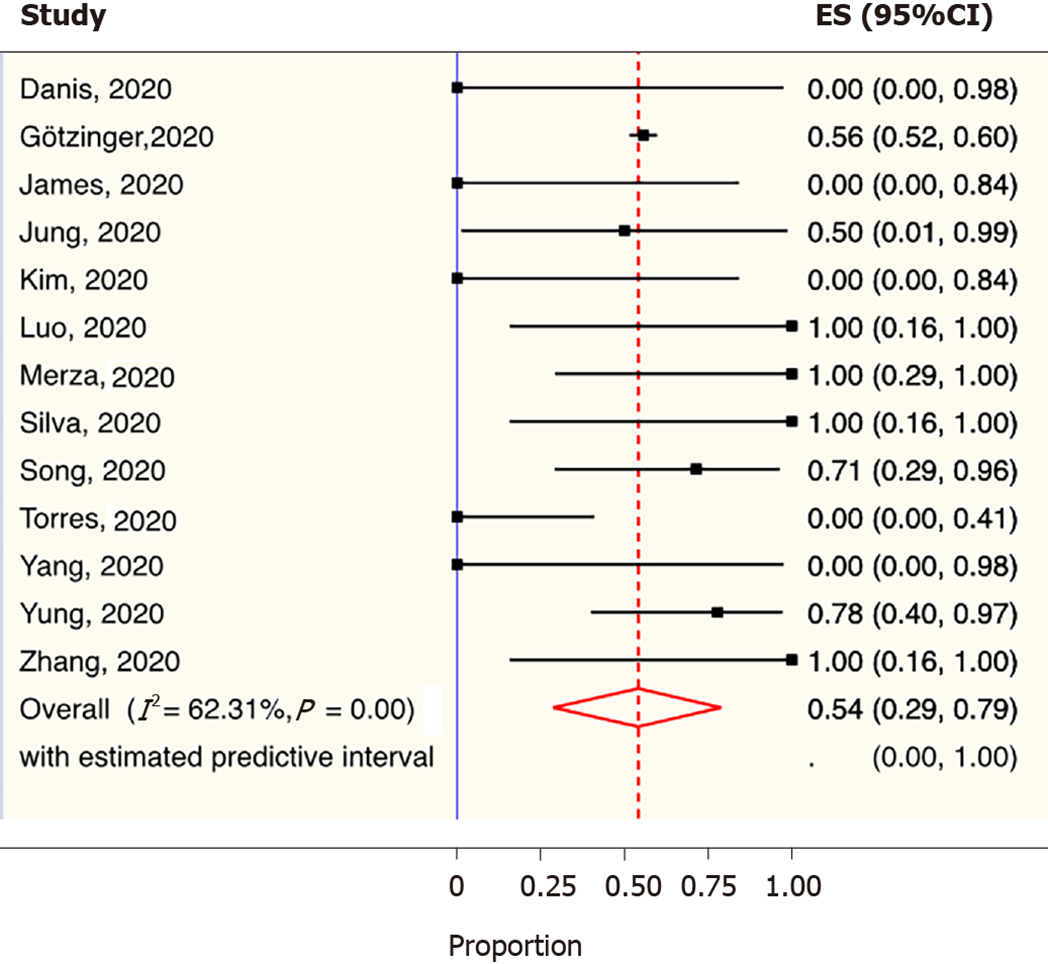
Figure 2 Forest plot depicting the overall weighted prevalence of parent being the index case in coronavirus disease 2019 infected children.
The diamond is centred on the summary of the prevalence estimate, and the width indicates the corresponding 95% confidence interval. CI: Confidence interval.
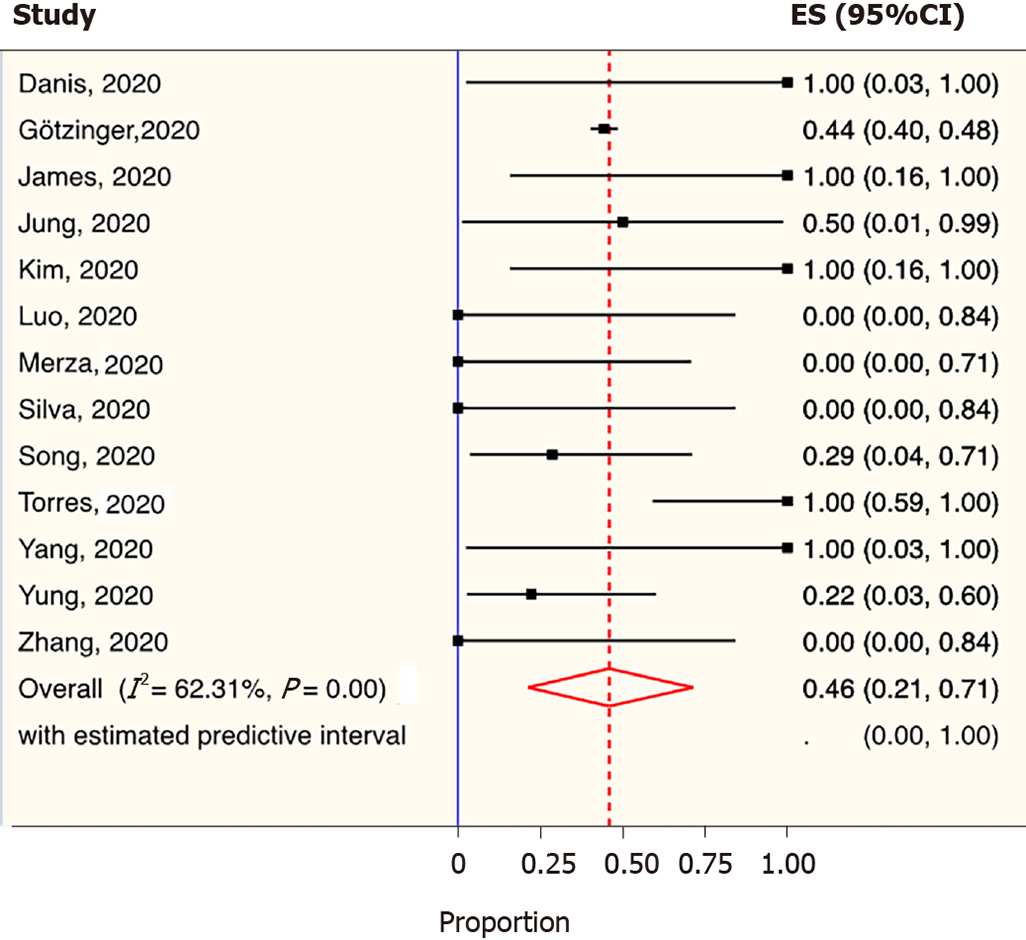
Figure 3 Forest plot depicting the overall weighted prevalence of parent not being the index case in coronavirus disease 2019 infected children.
The diamond is centred on the summary of the prevalence estimate, and the width indicates the corresponding 95% confidence interval. CI: Confidence interval.
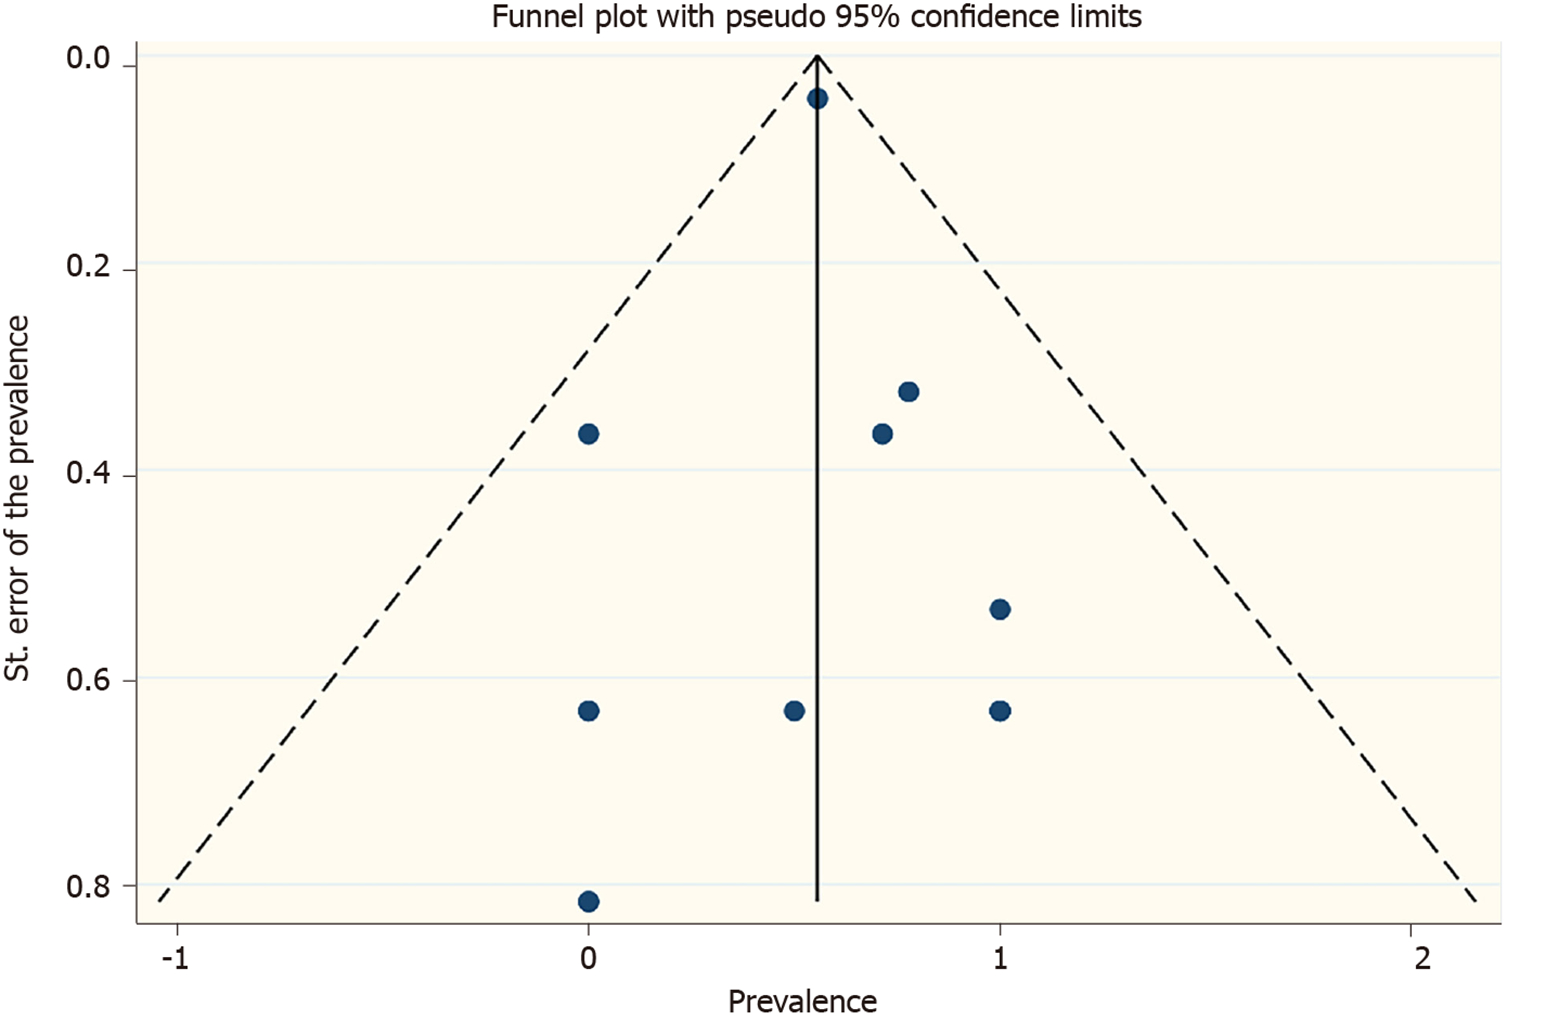
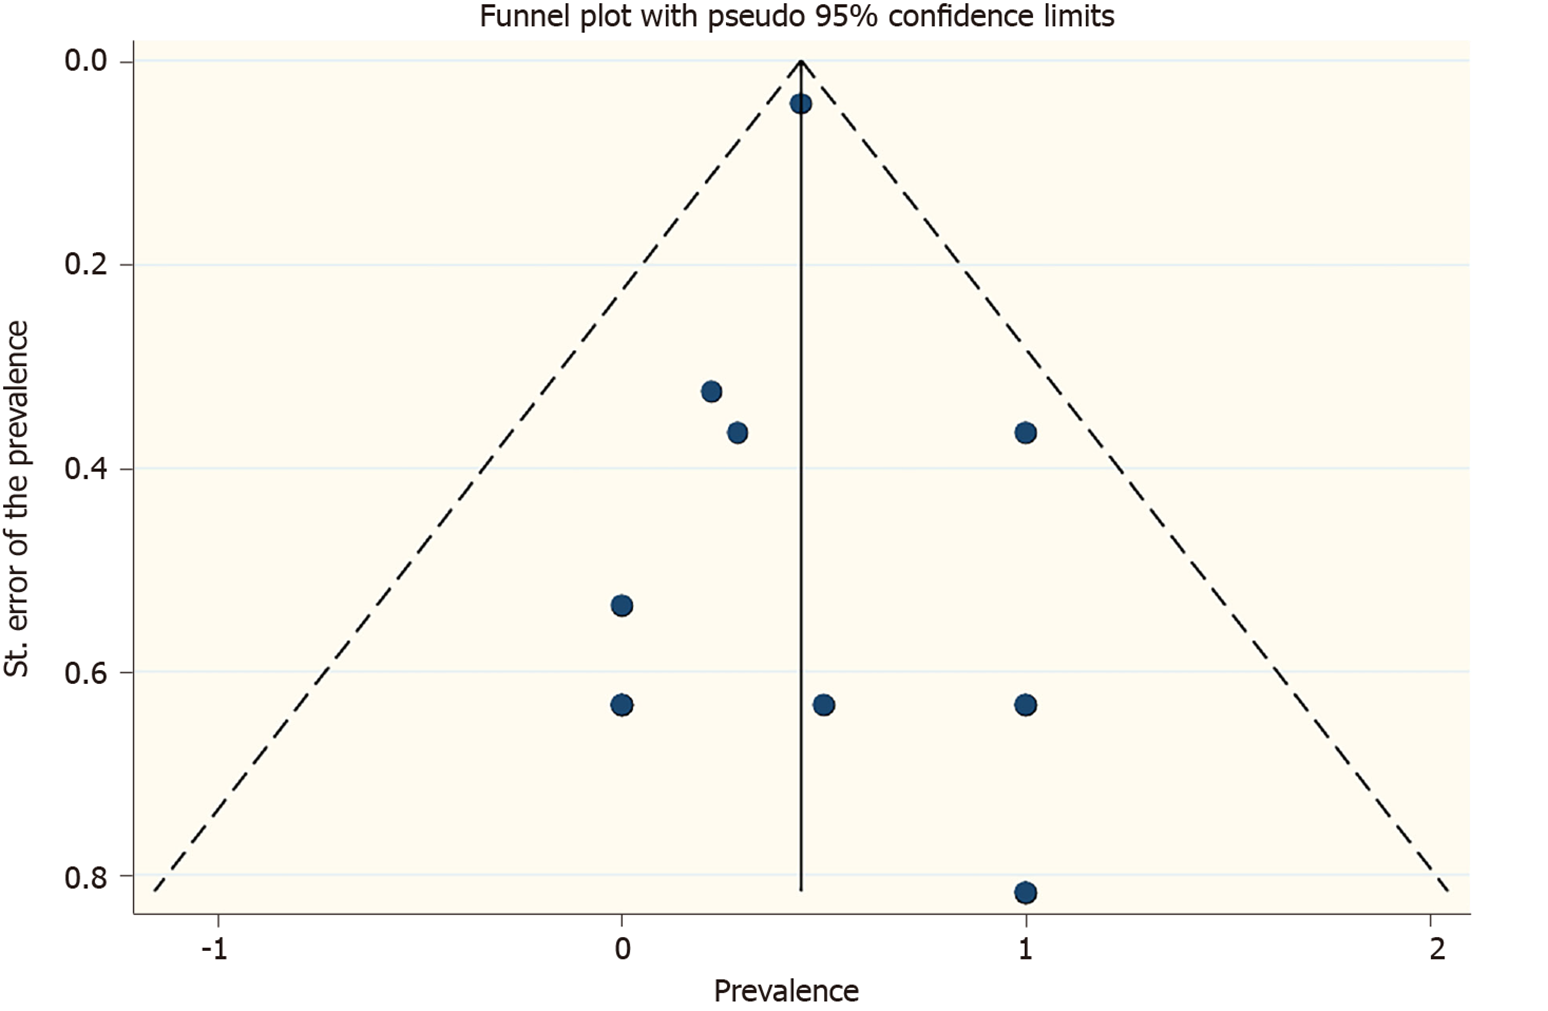
Figure 4 Funnel plot.
Outcome: Parent being the index case of COVID-19 infected children.
Figure 5 Funnel plot.
Outcome: Parent being not being the index case of COVID-19 infected children.
- Citation: Saha S, Saha S. Epidemiological burden of parents being the index cases of COVID-19 infected children. World J Methodol 2021; 11(1): 1-14
- URL: https://www.wjgnet.com/2222-0682/full/v11/i1/1.htm
- DOI: https://dx.doi.org/10.5662/wjm.v11.i1.1


