Copyright
©The Author(s) 2016.
World J Nephrol. Sep 6, 2016; 5(5): 448-454
Published online Sep 6, 2016. doi: 10.5527/wjn.v5.i5.448
Published online Sep 6, 2016. doi: 10.5527/wjn.v5.i5.448
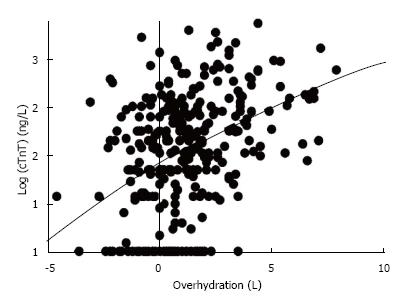
Figure 1 Regression analysis of baseline overhydration vs cardiac troponin T levels.
cTnT: Cardiac troponin-T.
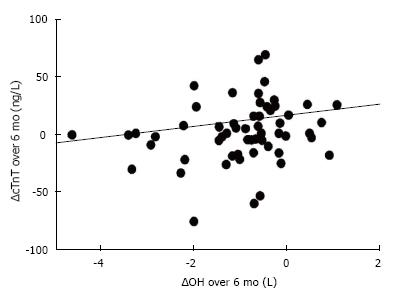
Figure 2 Regression analysis of the change in overhydration vs cardiac troponin T levels.
OH: Overhydration; cTnT: Cardiac troponin T levels.
- Citation: Oei E, Paudel K, Visser A, Finney H, Fan SL. Is overhydration in peritoneal dialysis patients associated with cardiac mortality that might be reversible? World J Nephrol 2016; 5(5): 448-454
- URL: https://www.wjgnet.com/2220-6124/full/v5/i5/448.htm
- DOI: https://dx.doi.org/10.5527/wjn.v5.i5.448


