Copyright
©The Author(s) 2024.
World J Nephrol. Dec 25, 2024; 13(4): 98932
Published online Dec 25, 2024. doi: 10.5527/wjn.v13.i4.98932
Published online Dec 25, 2024. doi: 10.5527/wjn.v13.i4.98932
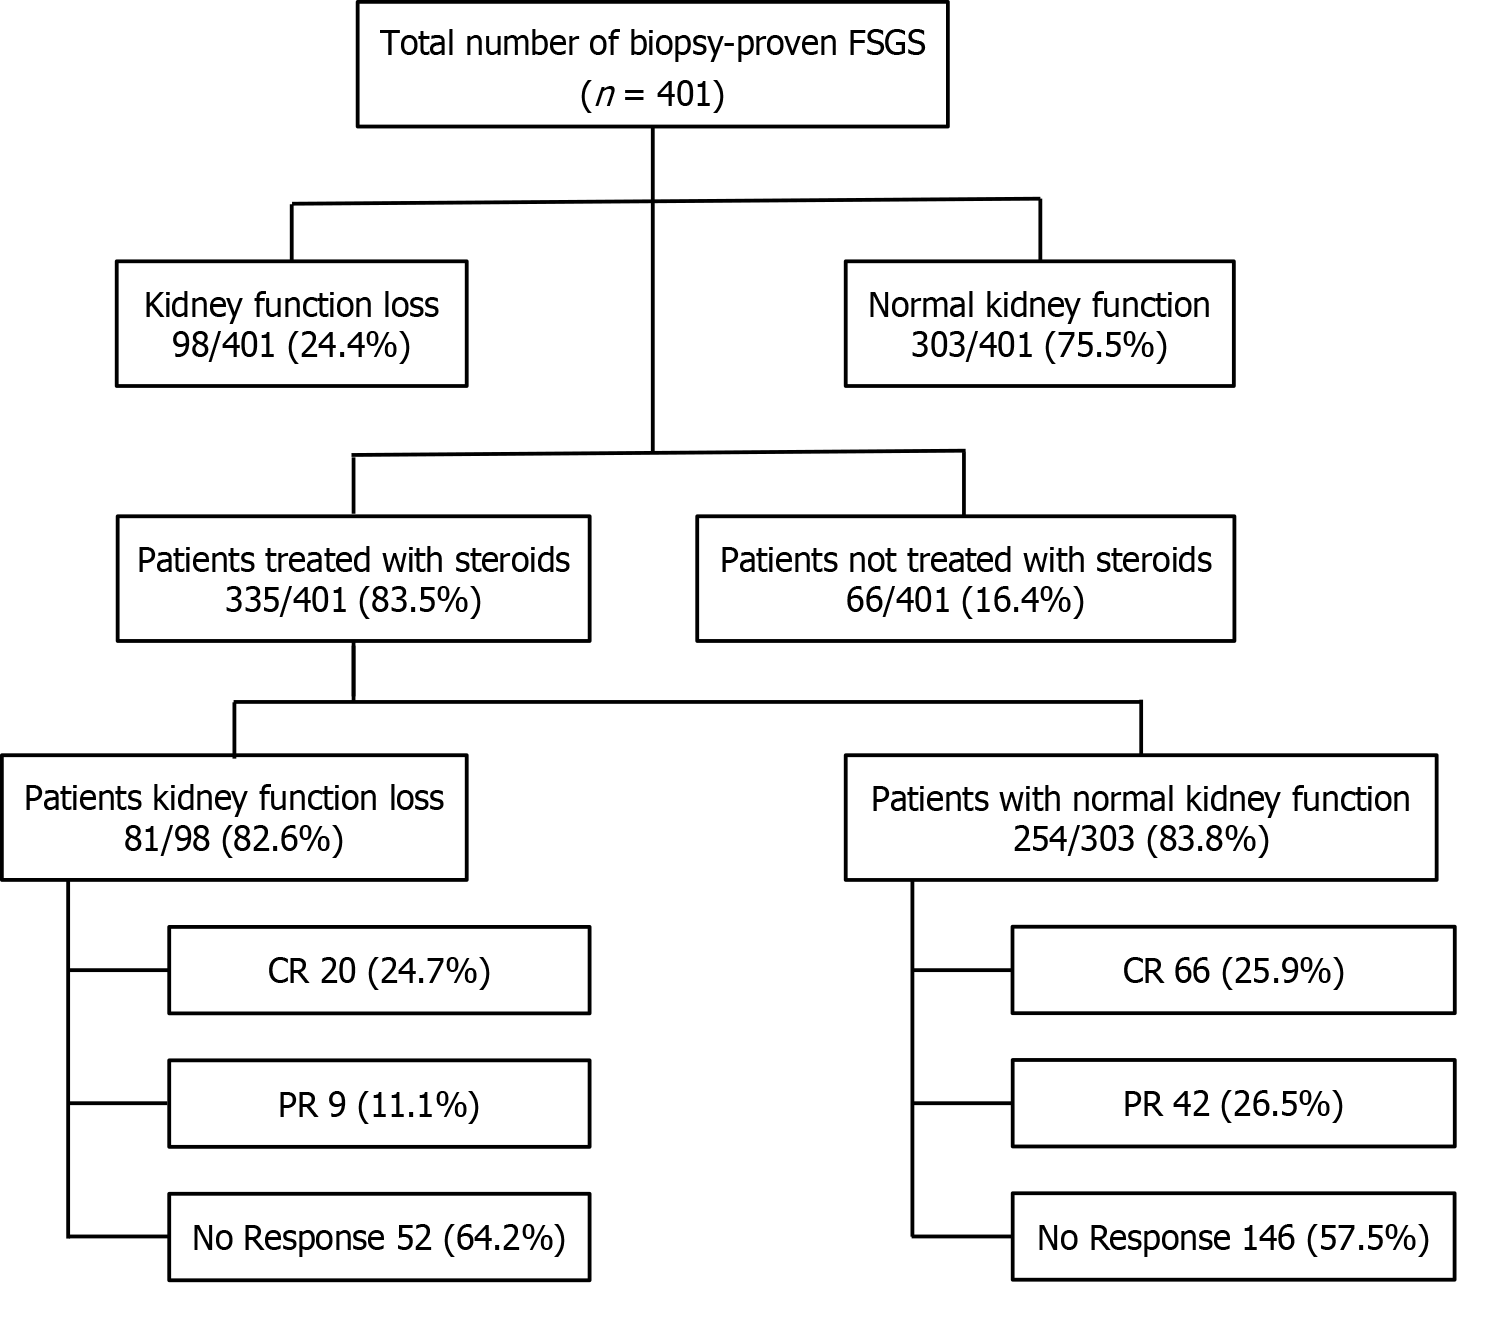
Figure 1 Flow diagram showing the selection and analysis of the study participants.
CR: Complete remission; FSGS: Focal segmental glomeru
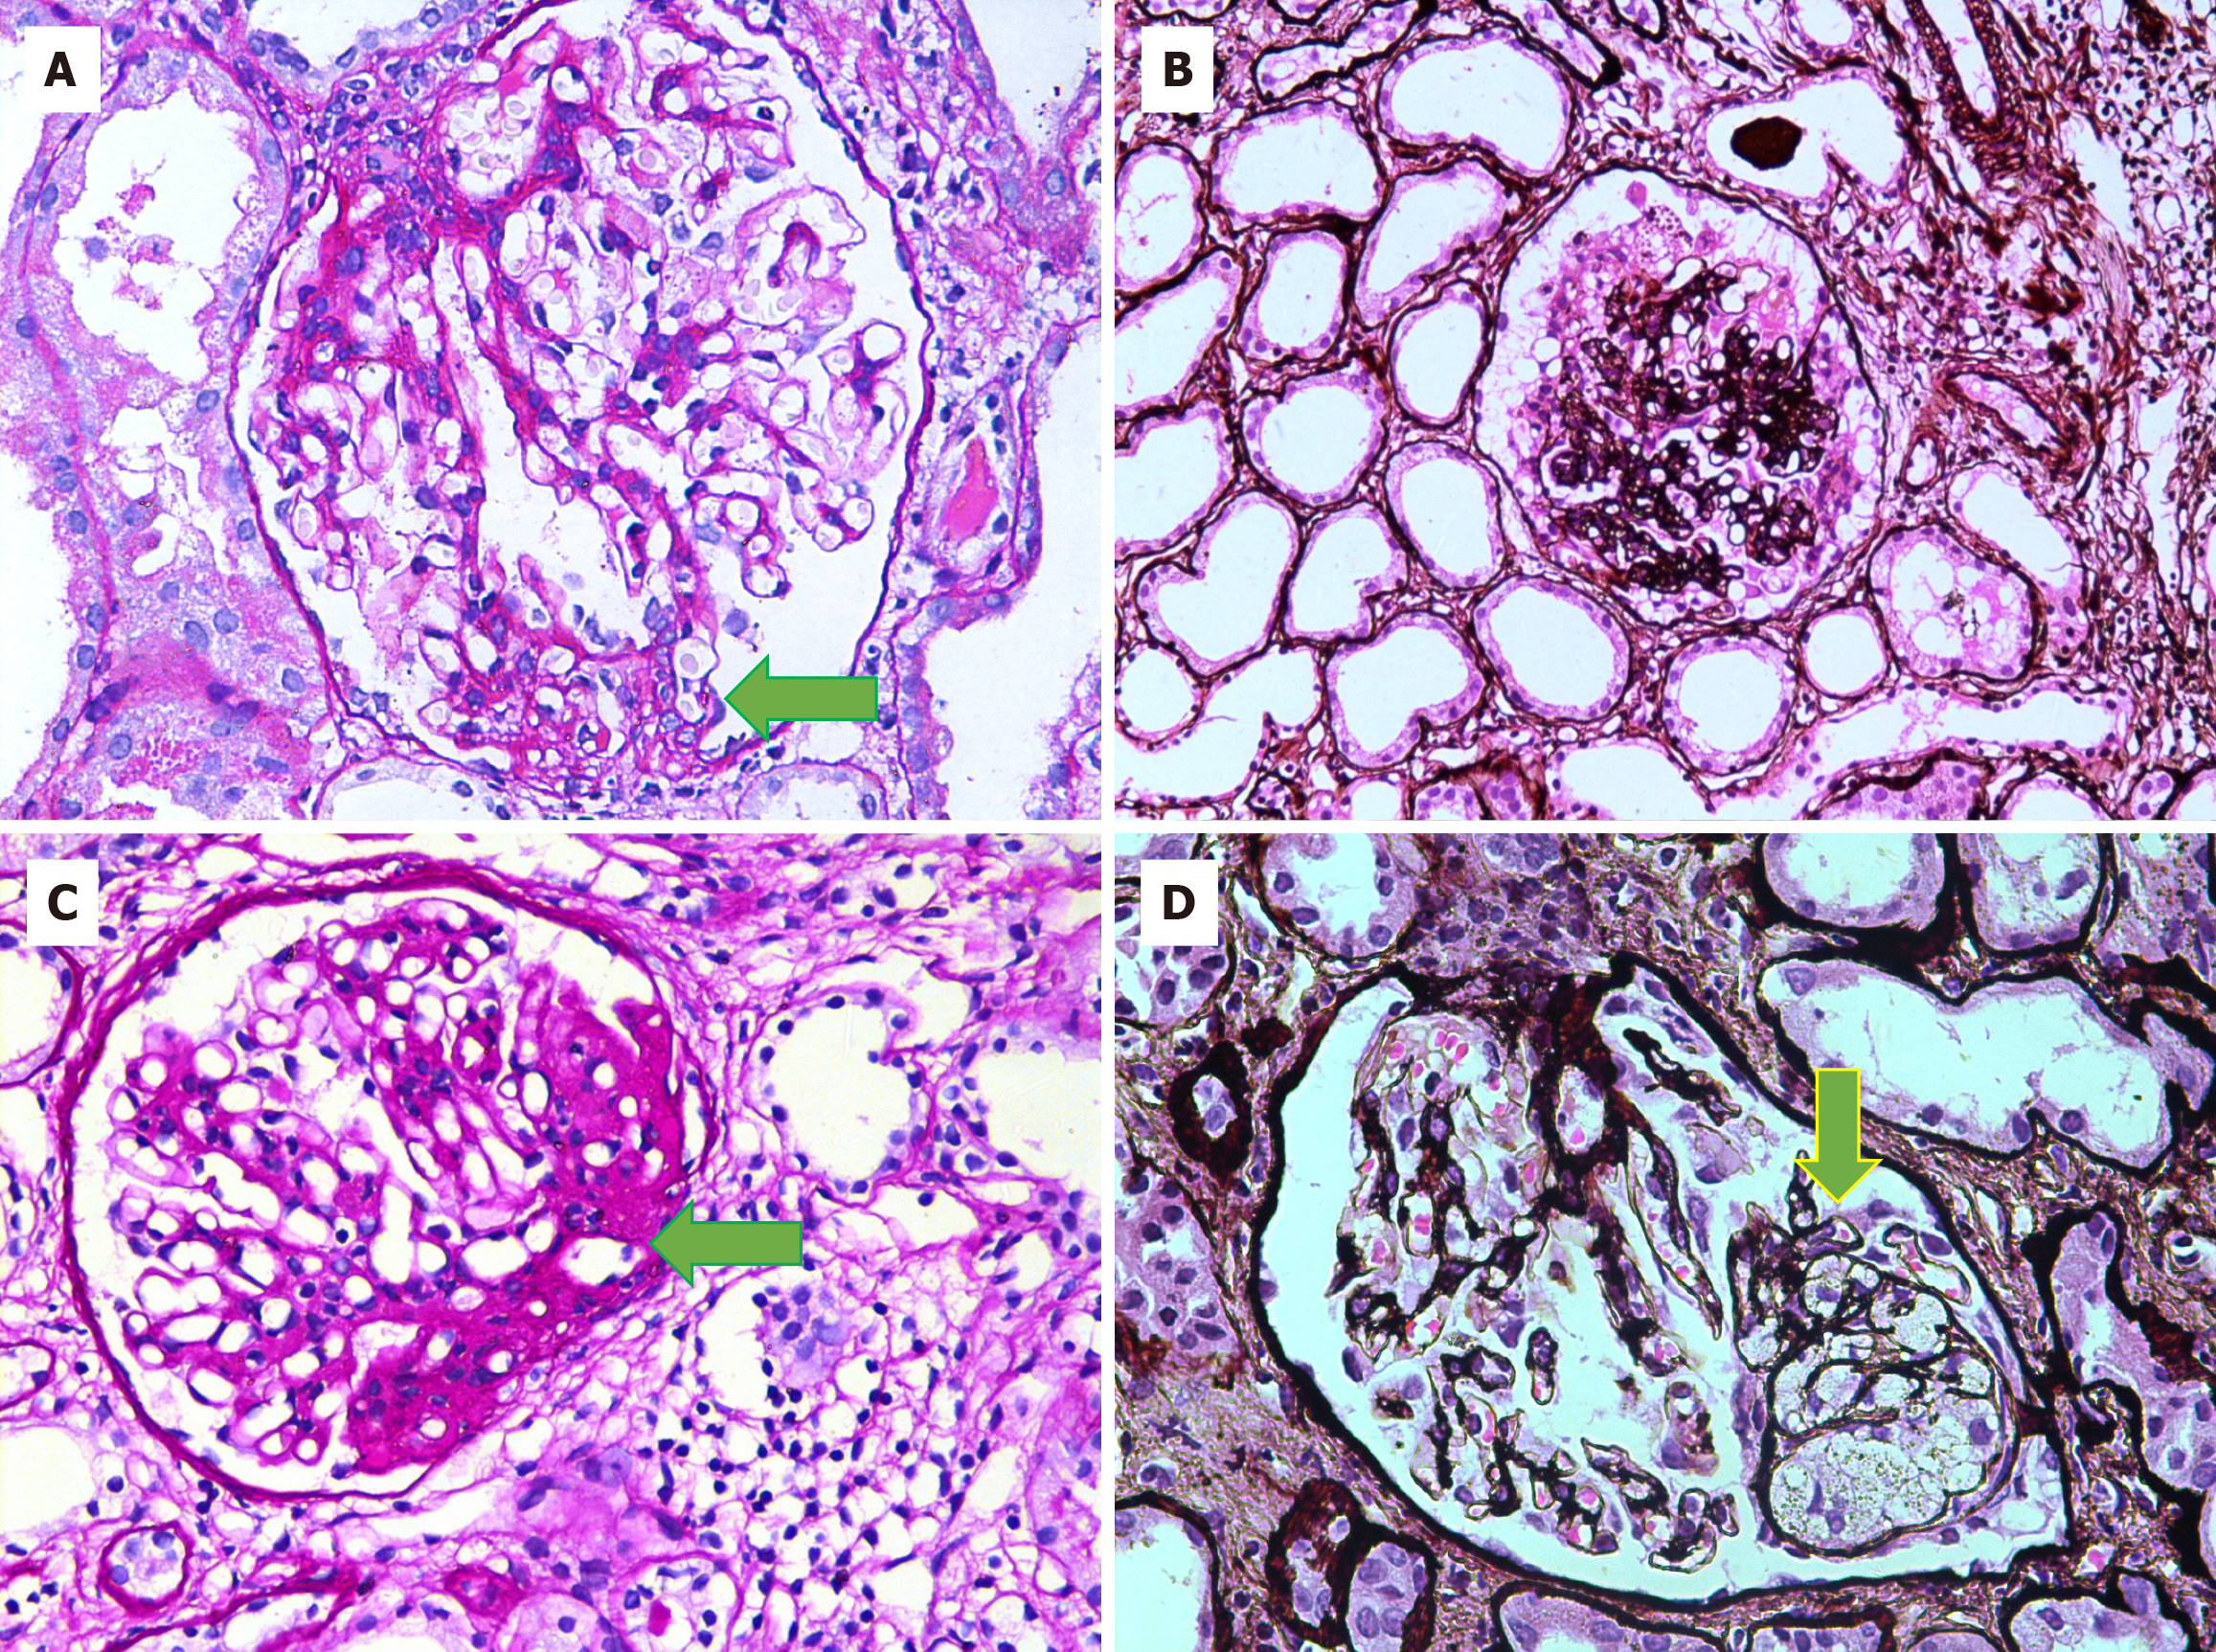
Figure 2 Histopathological features of focal segmental glomerulosclerosis variants.
A: Tip variant showing segmental scarring involving the tip domain of the glomerulus opposite the vascular pole (green arrow) [periodic acid-Schiff (PAS) stain, 400 ×]; B: Collapsing focal segmental glomerulosclerosis showing global collapse of capillary tufts associated with podocyte hypertrophy and hyperplasia [Jones Methenamine silver (JMS) stain, 200 ×]; C: Perihilar variant showing segmental scarring involving the vascular pole of the glomerulus (green arrow) (PAS stain, 400 ×); D: Cellular variant showing the expansion of a segment of glomerulus by endocapillary hypercellularity associated with mild podocyte hyperplasia (green arrow) (JMS stain, 400 ×).
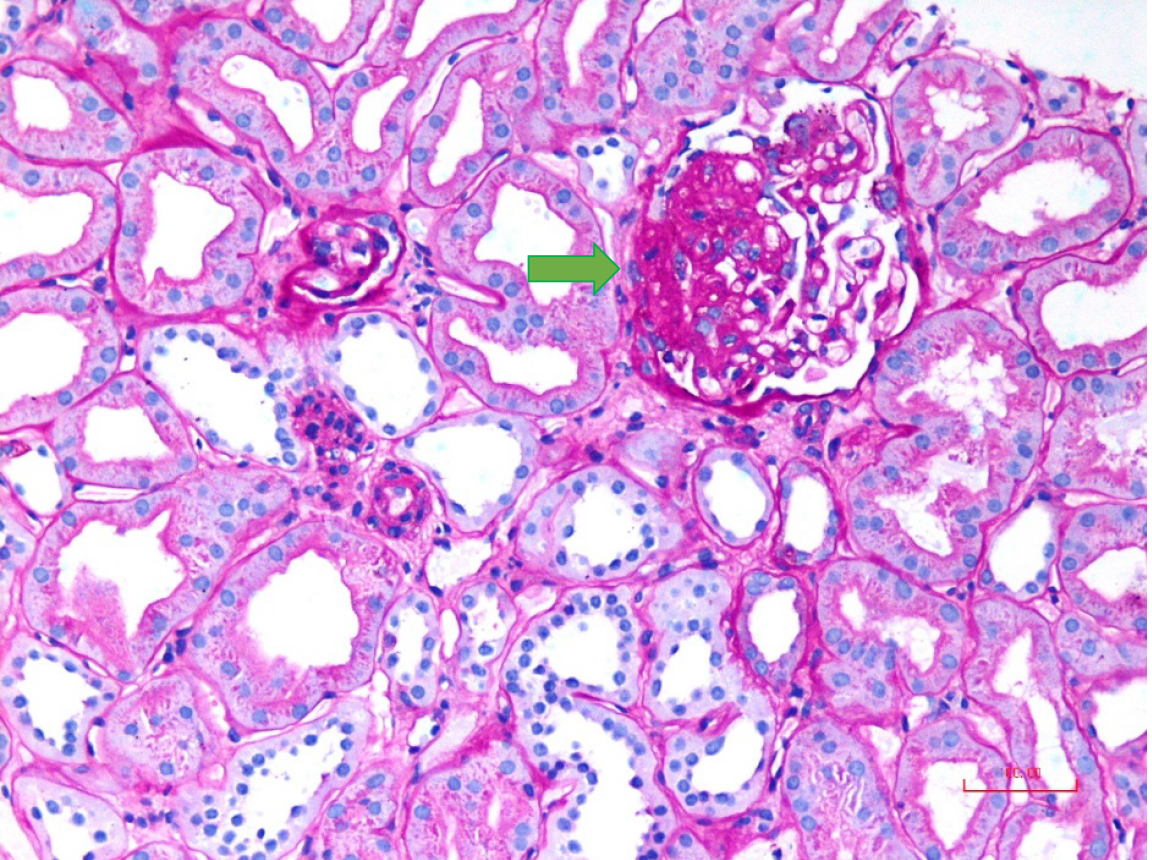
Figure 3 Focal segmental glomerulosclerosis, not otherwise specified variant.
The glomerulus is showing segmental scarring involving no specific location of the glomerulus and associated with adhesion to the Bowman’s capsule (green arrow). No podocyte hypertrophy or hyperplasia is noted (periodic acid-Schiff stain, 200 ×).
Figure 4 Scatterbox charts comparing the final serum creatinine and estimated glomerular filtration rate values among the steroid-responsive and steroid-non-responsive groups after steroid treatment.
A: The final serum creatinine; B: Estimated glomerular filtration rate (EGFR) values.
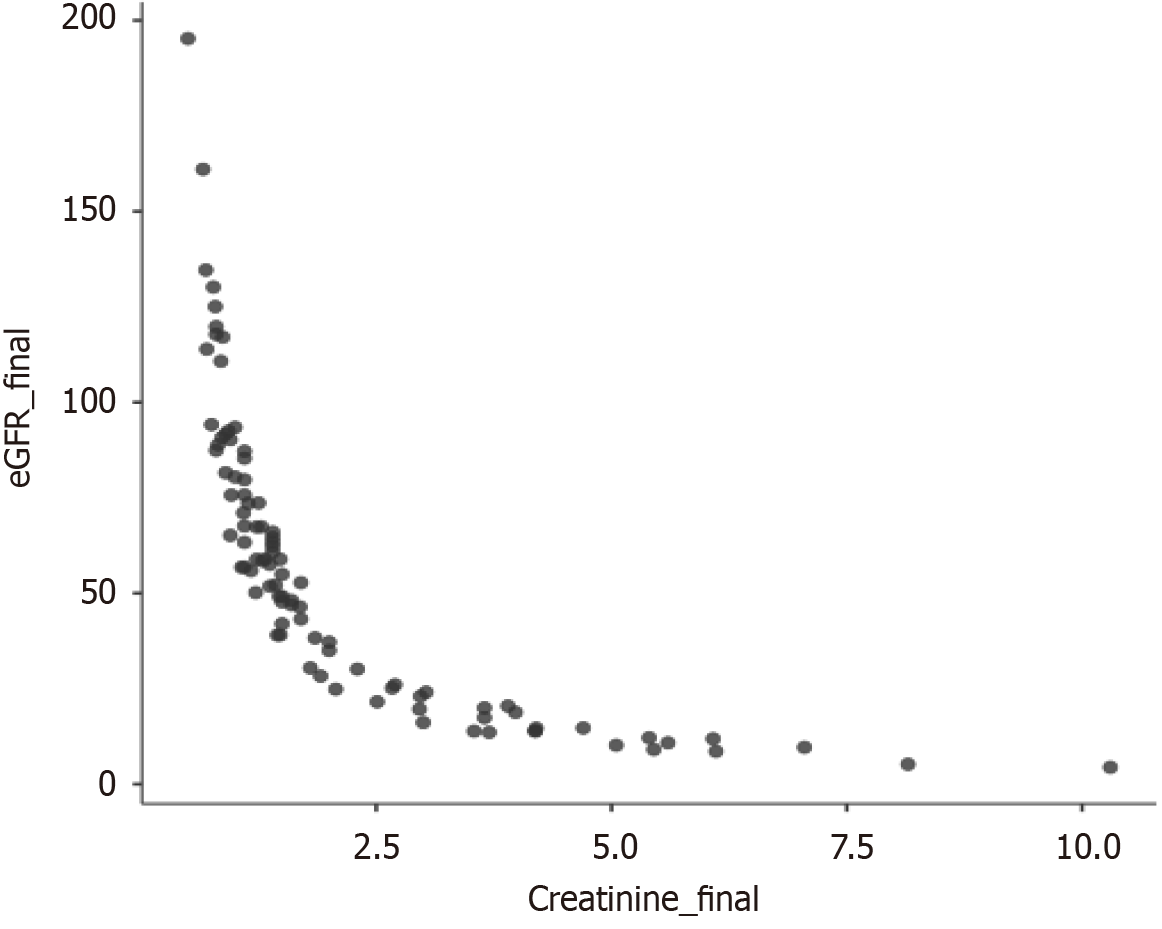
Figure 5 Scatter diagram showing an inverse relationship between serum creatinine and estimated glomerular filtration rate after steroid treatment.
EGFR: Estimated glomerular filtration rate.
- Citation: Jafry NH, Sarwar S, Waqar T, Mubarak M. Clinical course and outcome of adult patients with primary focal segmental glomerulosclerosis with kidney function loss on presentation. World J Nephrol 2024; 13(4): 98932
- URL: https://www.wjgnet.com/2220-6124/full/v13/i4/98932.htm
- DOI: https://dx.doi.org/10.5527/wjn.v13.i4.98932


