Copyright
©The Author(s) 2024.
World J Nephrol. Sep 25, 2024; 13(3): 99105
Published online Sep 25, 2024. doi: 10.5527/wjn.v13.i3.99105
Published online Sep 25, 2024. doi: 10.5527/wjn.v13.i3.99105
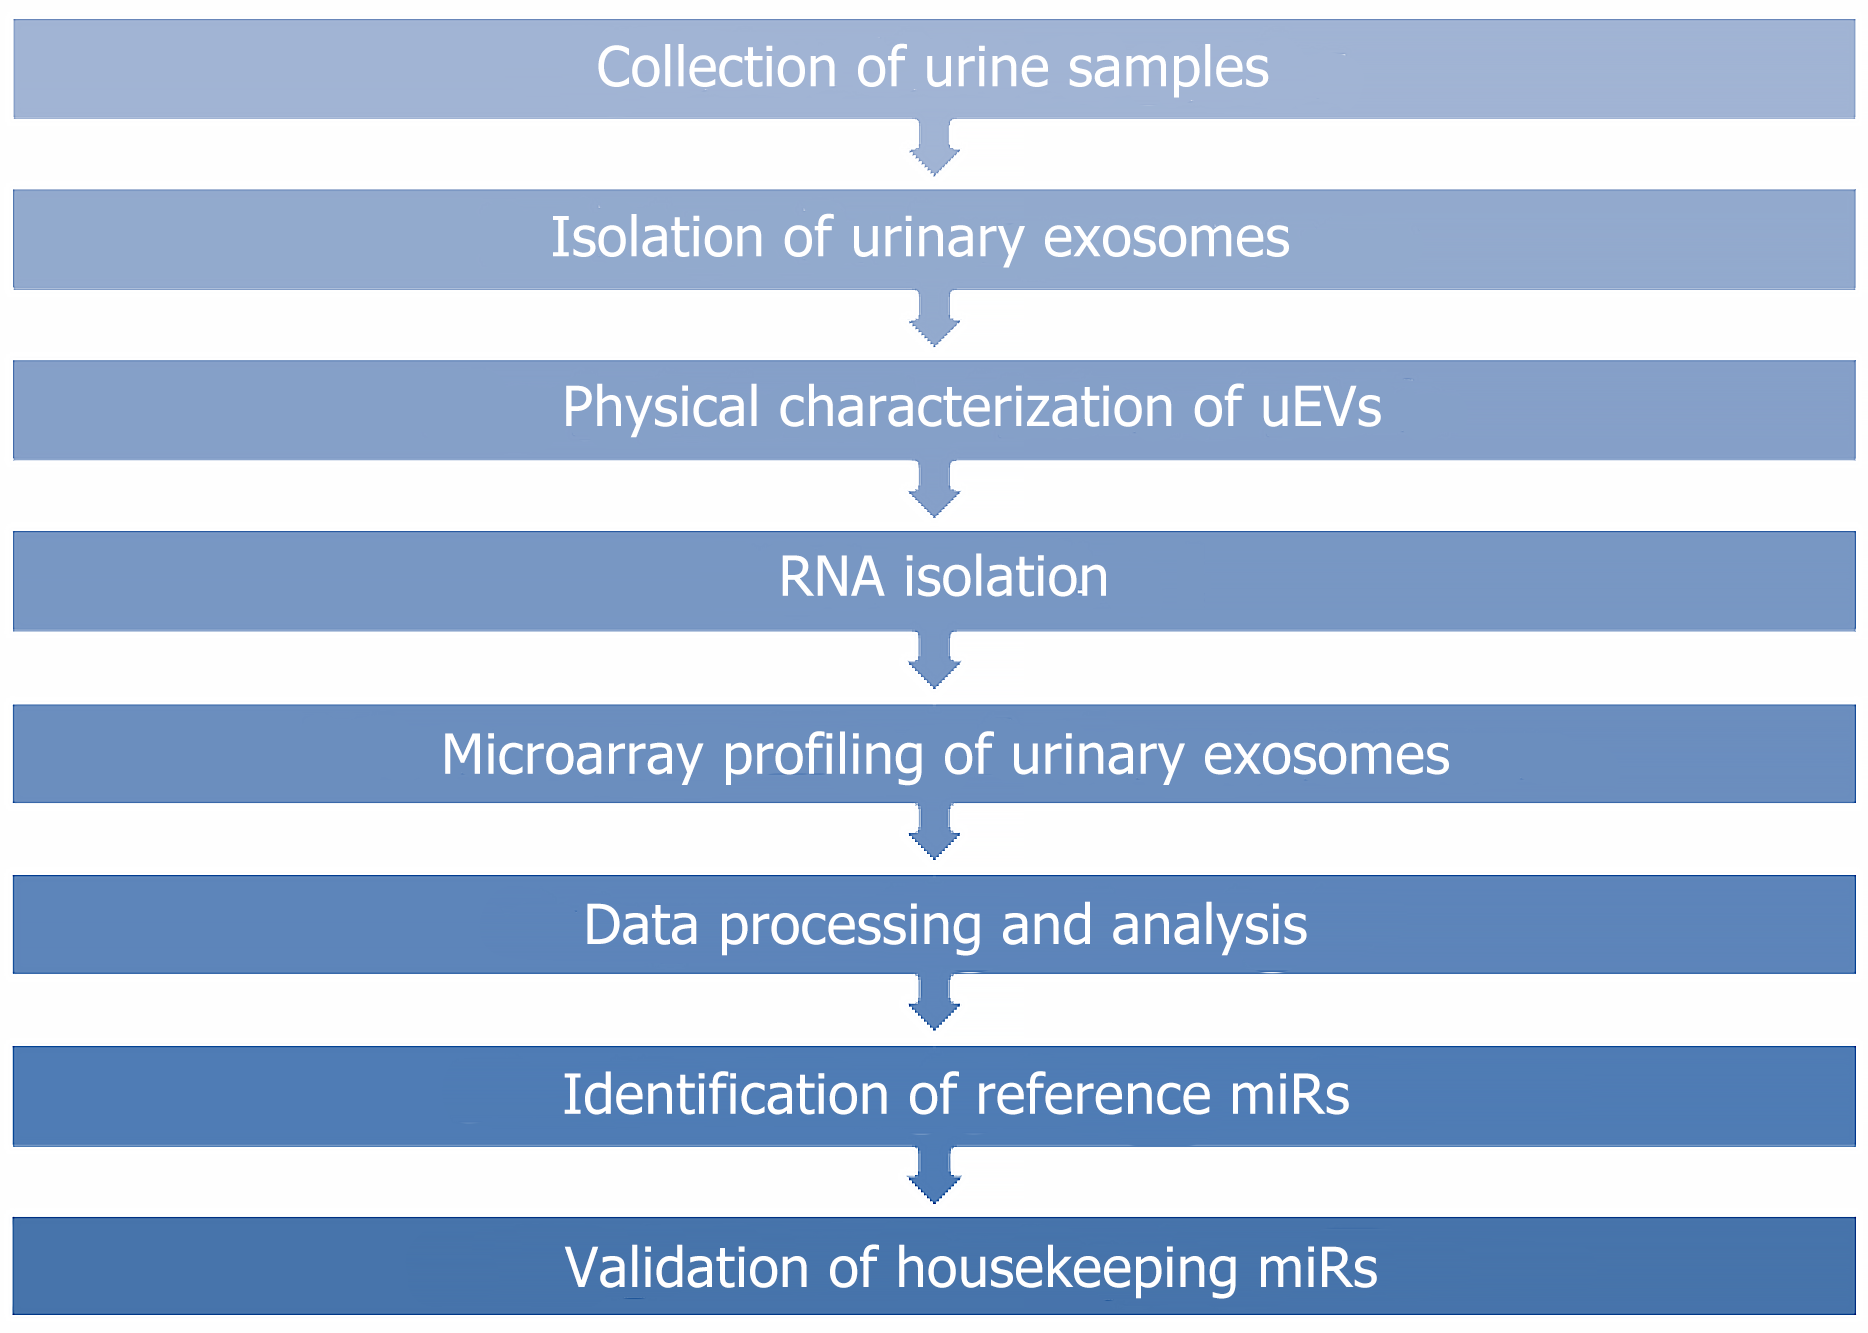
Figure 1 Flow chart for selecting housekeeping miRNAs.
miRs: miRNAs.
Figure 2 Characterization of urinary exosomes.
A: Representative nanoparticle tracking analysis of urinary exosomes (UEs) showing exosome concentration (particles/mL)/size in pellets; B: Scattering distribution (intensity/size) profile; C: Representative immunoblot showing the presence of exosome-specific marker proteins, CD9, CD63 and CD81 in the UE protein samples. UEs were isolated from human urine samples via differential ultracentrifugation methods.
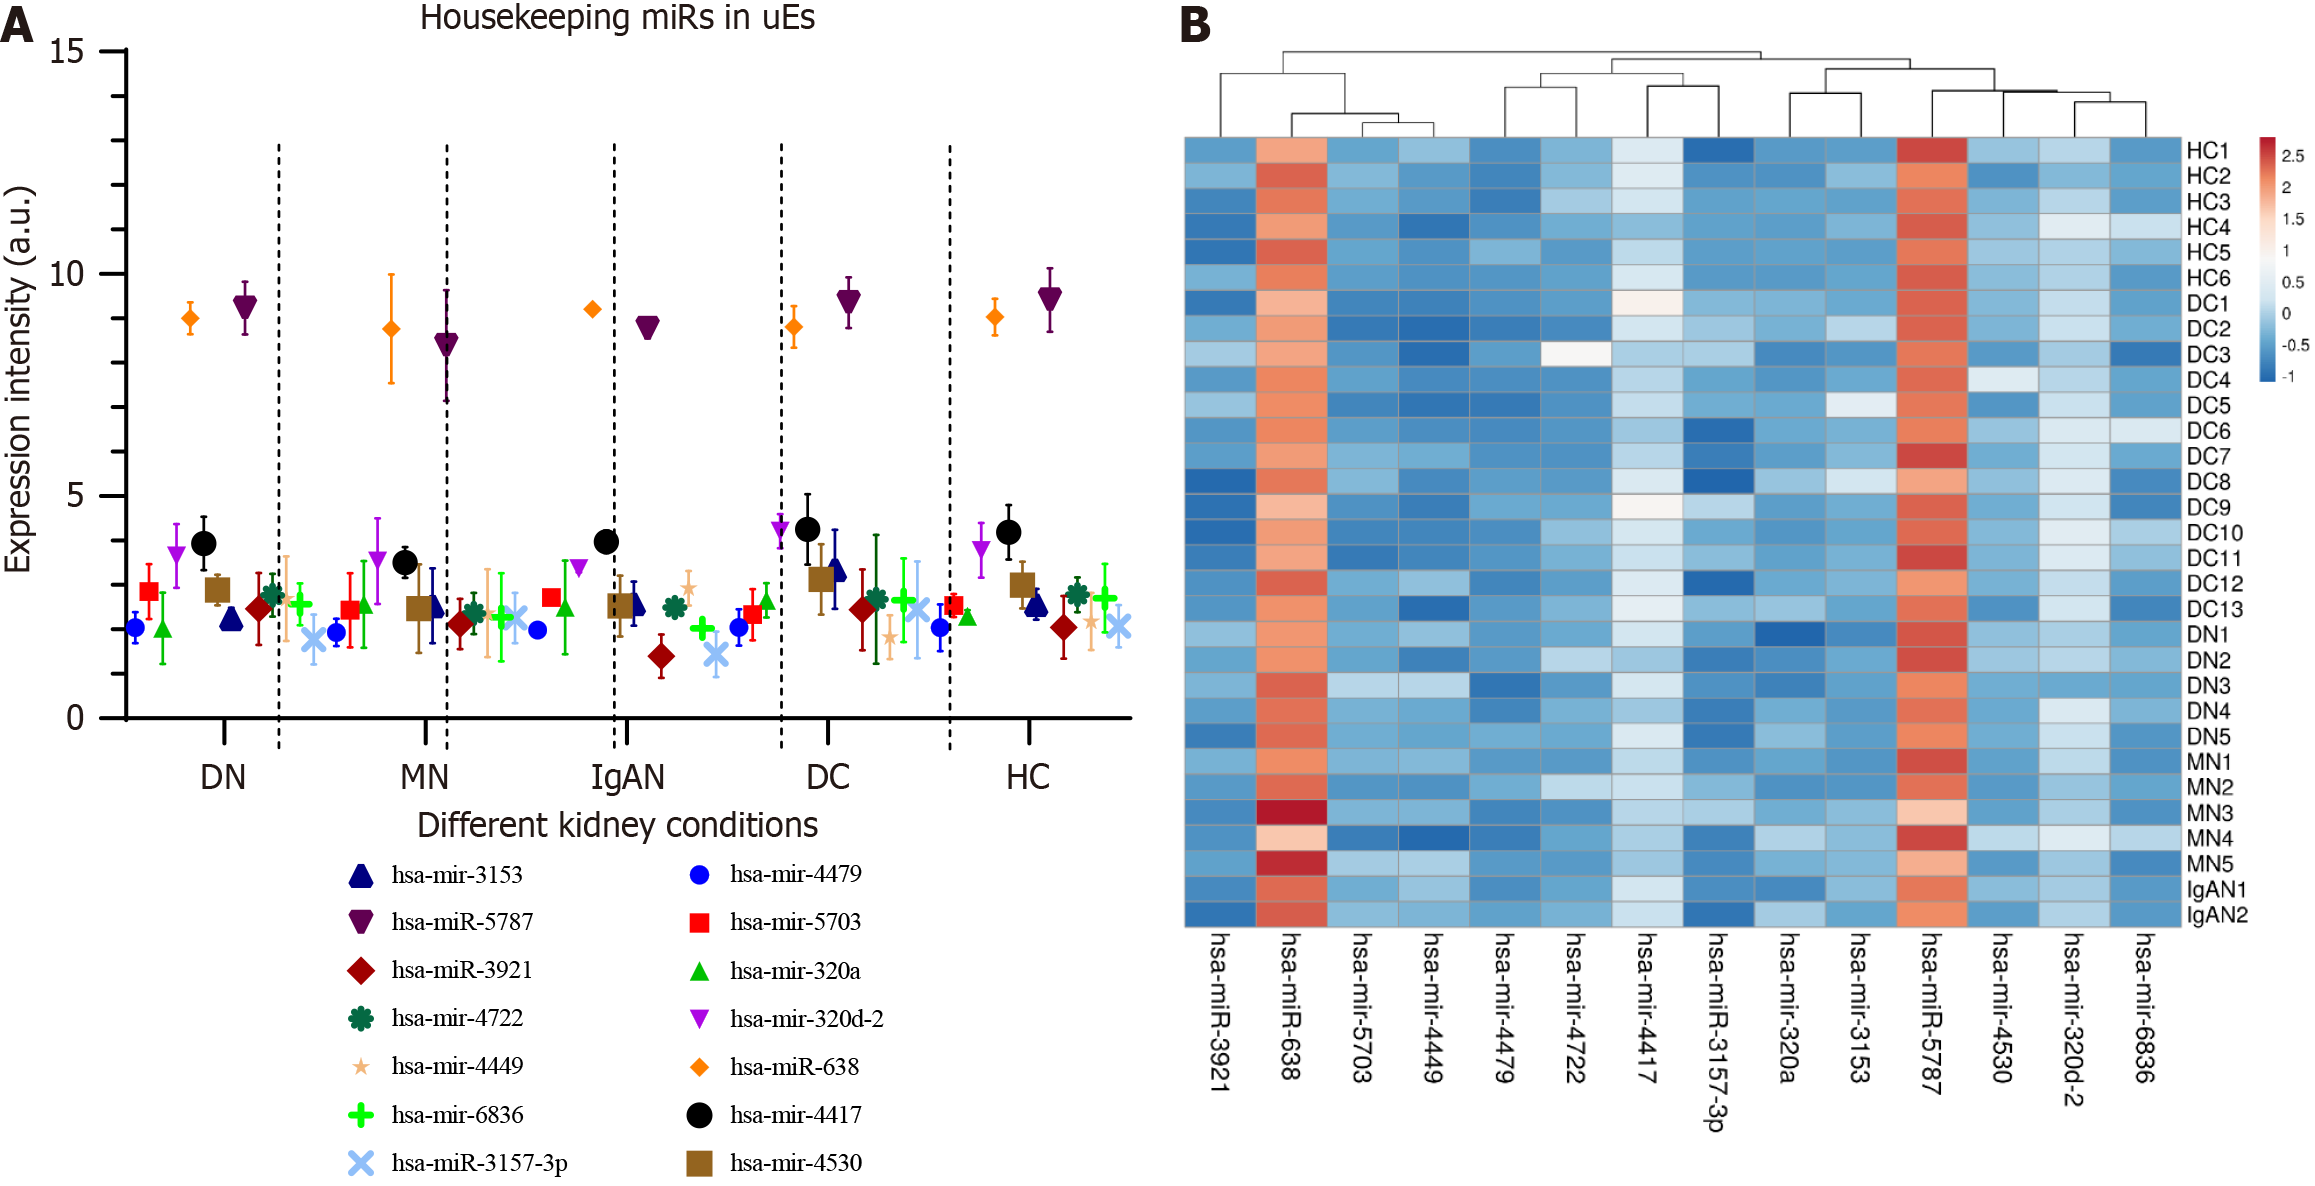
Figure 3 Expression of housekeeping miRNAs in different kidney conditions.
A: Housekeeping miRNAs depicting stable expression among different kidney conditions. Error bars represent the SEM of five different conditions; B: Heat map showing the expression of 14 homologous miRNA signatures among 31 samples of different kidney conditions.
Figure 4 Enrichment analysis and annotation of housekeeping miRNAs.
A: Heatmap displaying the top 100 local interactions of housekeeping miRNAs; B: Word cloud analysis displaying the top 100 sites of expression annotations for housekeeping miRNAs, based on a P value threshold < 0.05.
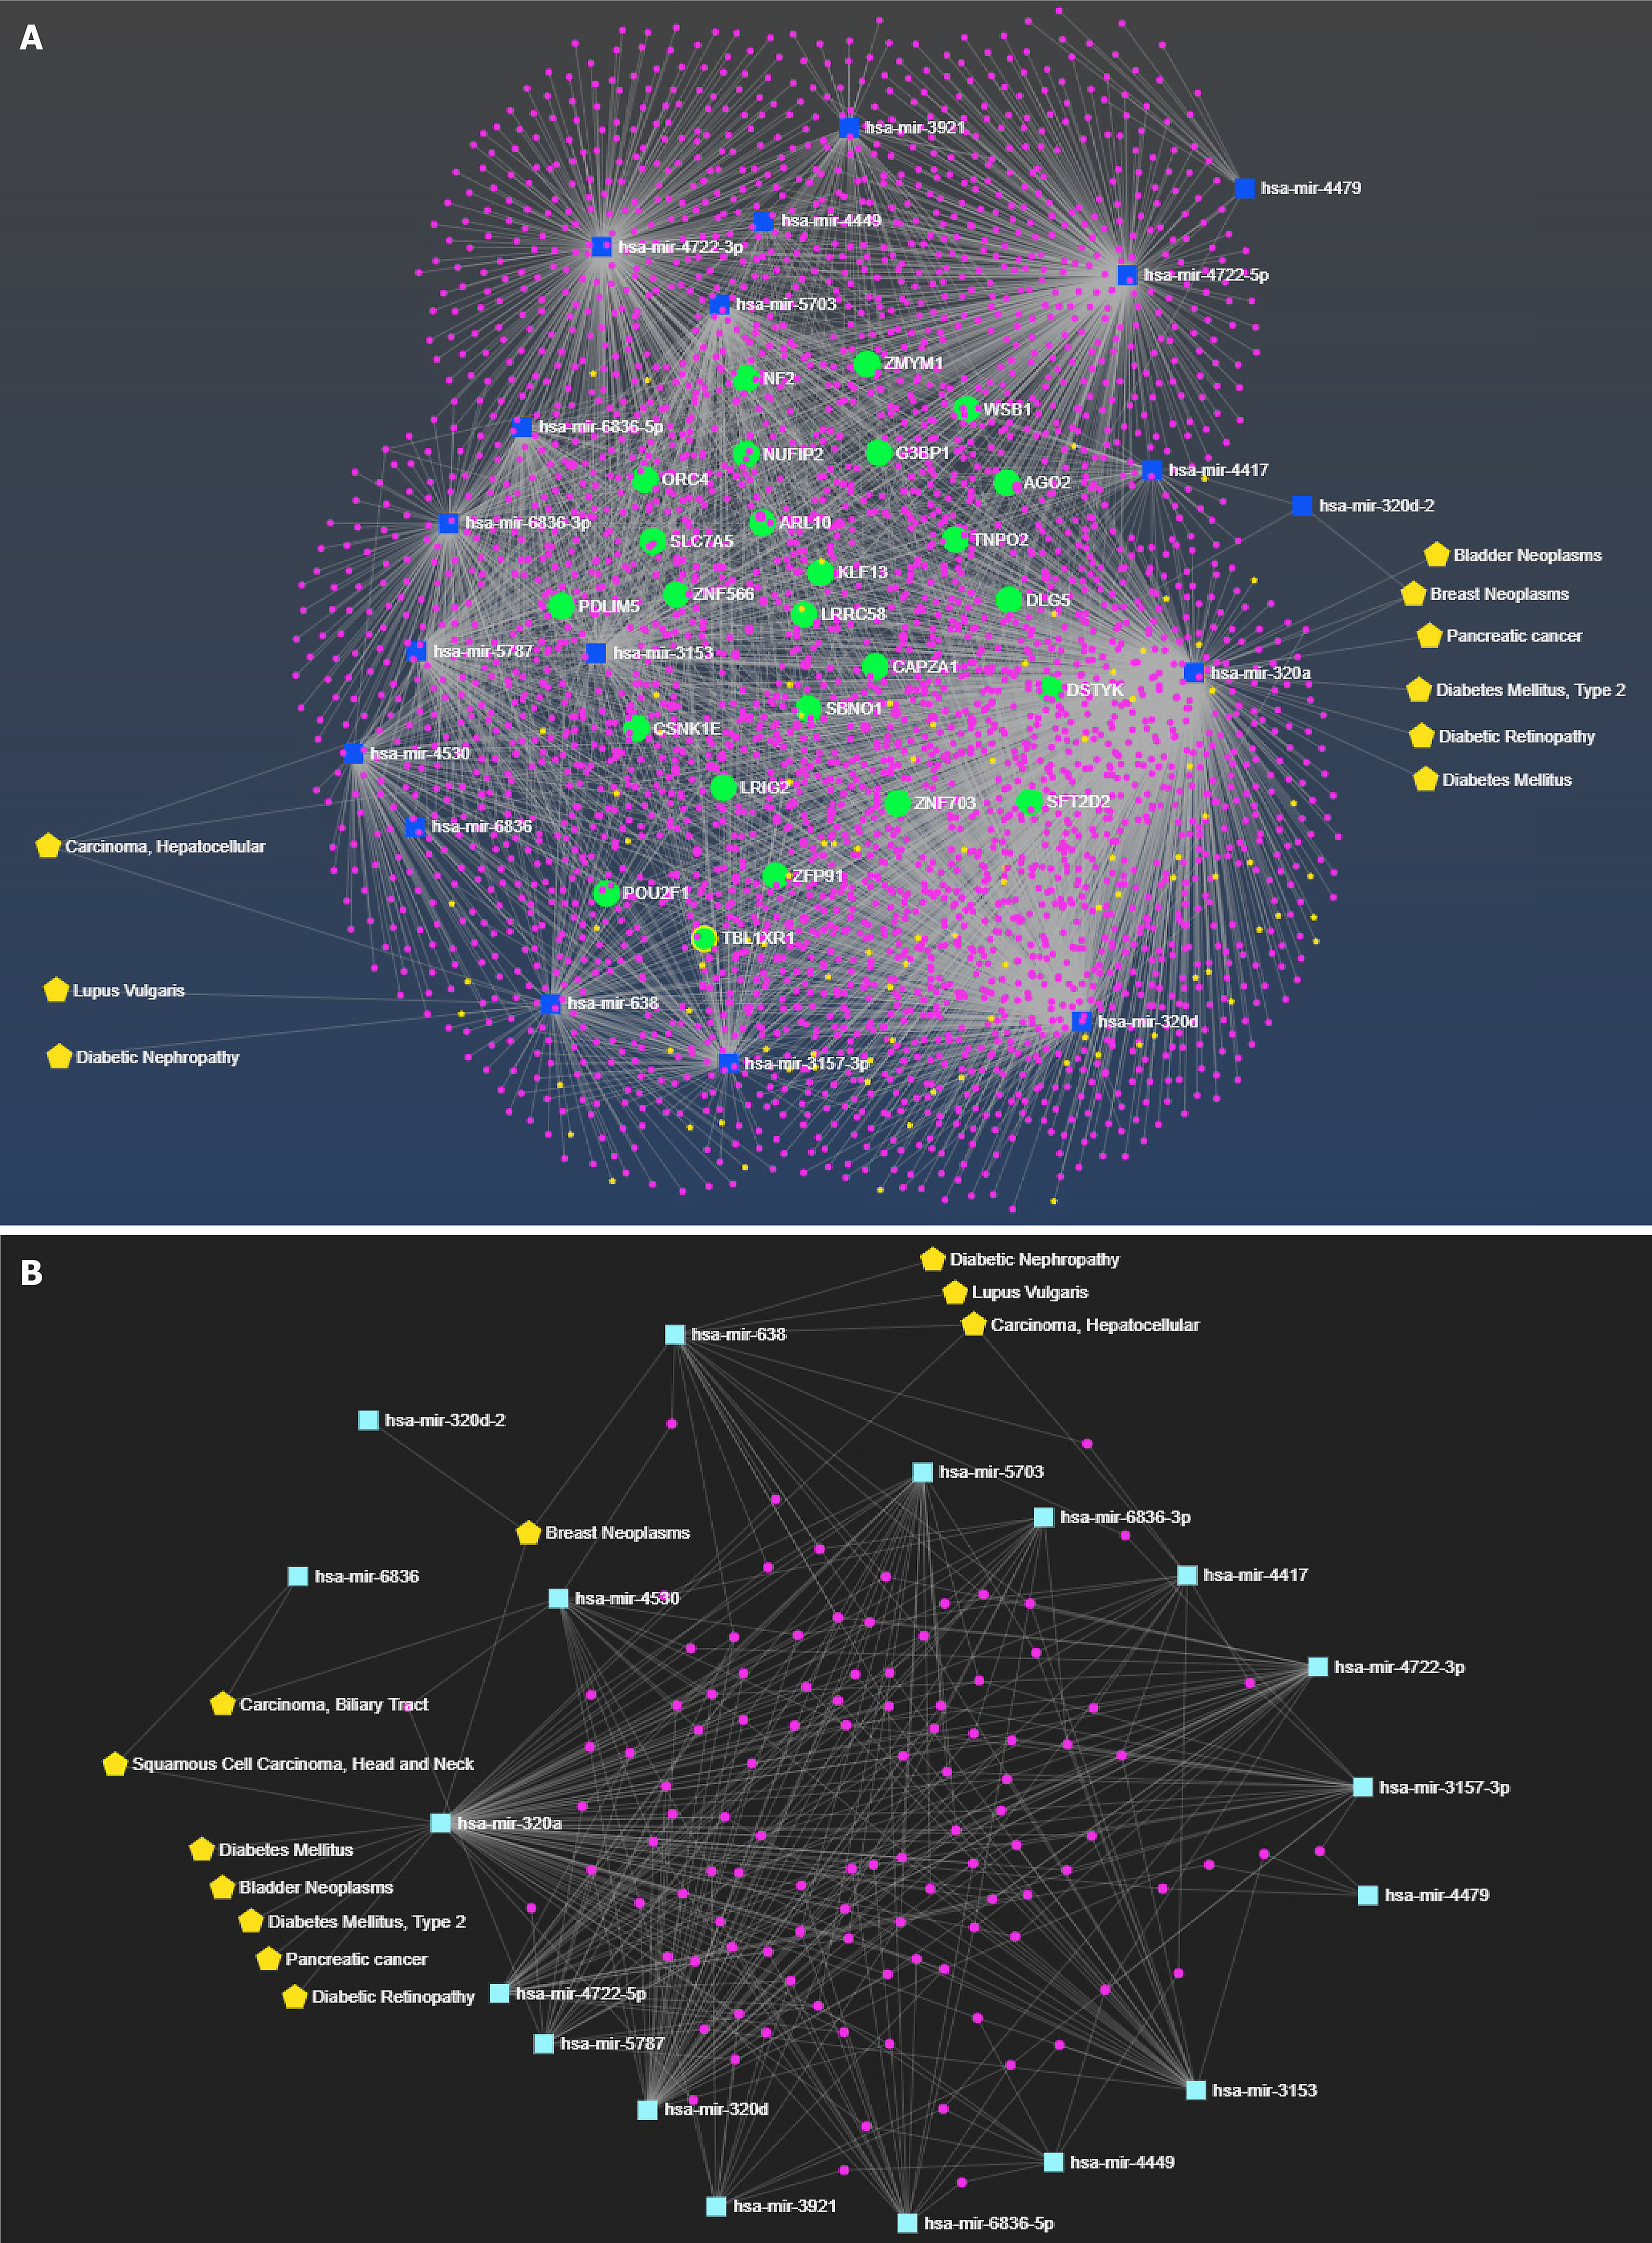
Figure 5 miRNA-centric network of miRNAs showing interactor gene, and diseases associations.
A: Allied network of miRNA and its interactors with disease annotation. Green color nodes represent the interactor gene, blue nodes represent the respective miRNAs, and yellow color nodes represent the associated disease conditions; B: Subnetwork of miRNA and its common interactors with disease annotation. Pink color nodes represent the interactor gene, light blue color node shows the respective miRNAs and yellow color nodes represent the associated disease conditions.
- Citation: Mishra DD, Maurya PK, Tiwari S. Reference gene panel for urinary exosome-based molecular diagnostics in patients with kidney disease. World J Nephrol 2024; 13(3): 99105
- URL: https://www.wjgnet.com/2220-6124/full/v13/i3/99105.htm
- DOI: https://dx.doi.org/10.5527/wjn.v13.i3.99105


