Copyright
©The Author(s) 2023.
World J Nephrol. Dec 25, 2023; 12(5): 159-167
Published online Dec 25, 2023. doi: 10.5527/wjn.v12.i5.159
Published online Dec 25, 2023. doi: 10.5527/wjn.v12.i5.159
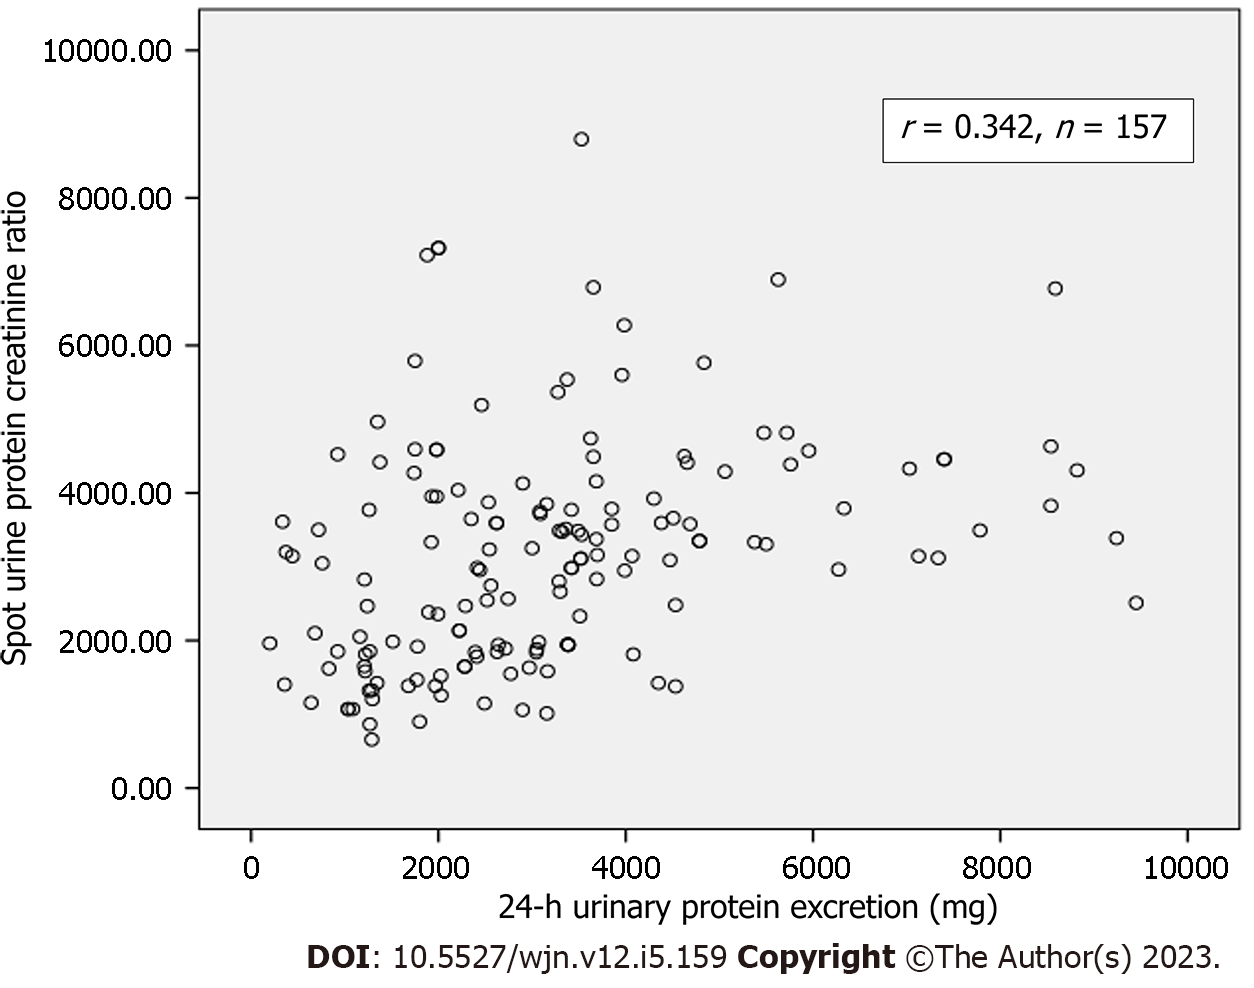
Figure 1 Correlation between spot urine protein-to-creatinine ratio and 24-h urinary protein excretion in all patients (n = 157).
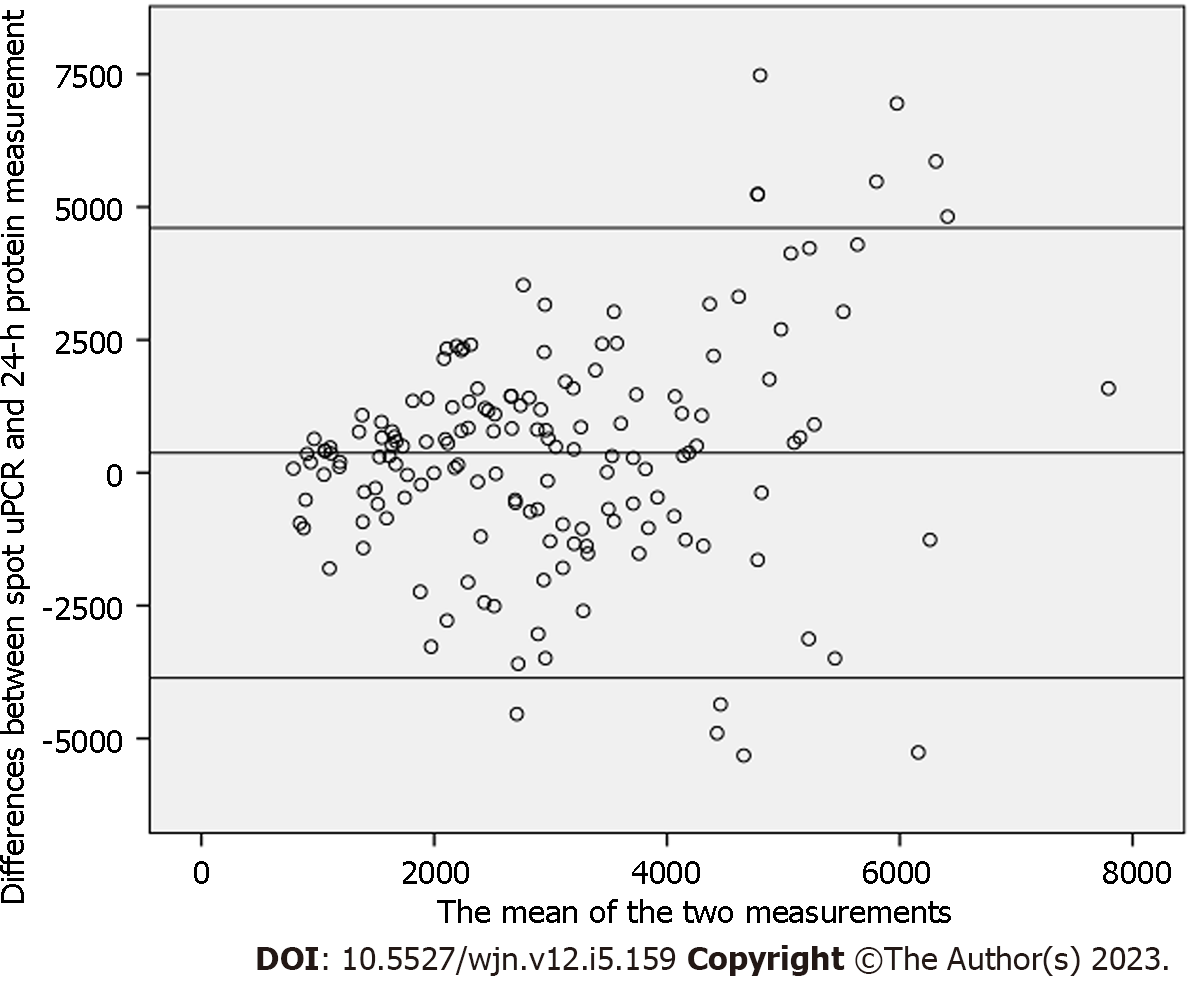
Figure 2 Bland and Altman plot comparing the differences between spot urine protein-to-creatinine ratio and 24-h protein measurement against the mean of the measurement by the two methods.
The mean bias is 373 mg; however, the limits of agreement are fairly wide (from -3682 to 4069 mg), particularly as the mean of the two methods rises.
Figure 3 The mean bias and limits of agreement in the group of patients with protein excretion of less than 3000 mg.
The mean bias is -93.64 mg and the limits of agreement are -2861.53 to 2674.25 mg in this group of patients.
Figure 4 The mean bias and limits of agreement in the group of patients with more than 3000 mg protein excretion.
The mean bias is 158.36 mg and the limits of agreement are -4738.46 to 5035.18 mg in this group of patients.
- Citation: Raza A, Nawaz SH, Rashid R, Ahmed E, Mubarak M. The correlation of spot urinary protein-to-creatinine ratio with 24-h urinary protein excretion in various glomerulopathies. World J Nephrol 2023; 12(5): 159-167
- URL: https://www.wjgnet.com/2220-6124/full/v12/i5/159.htm
- DOI: https://dx.doi.org/10.5527/wjn.v12.i5.159


