Copyright
©The Author(s) 2018.
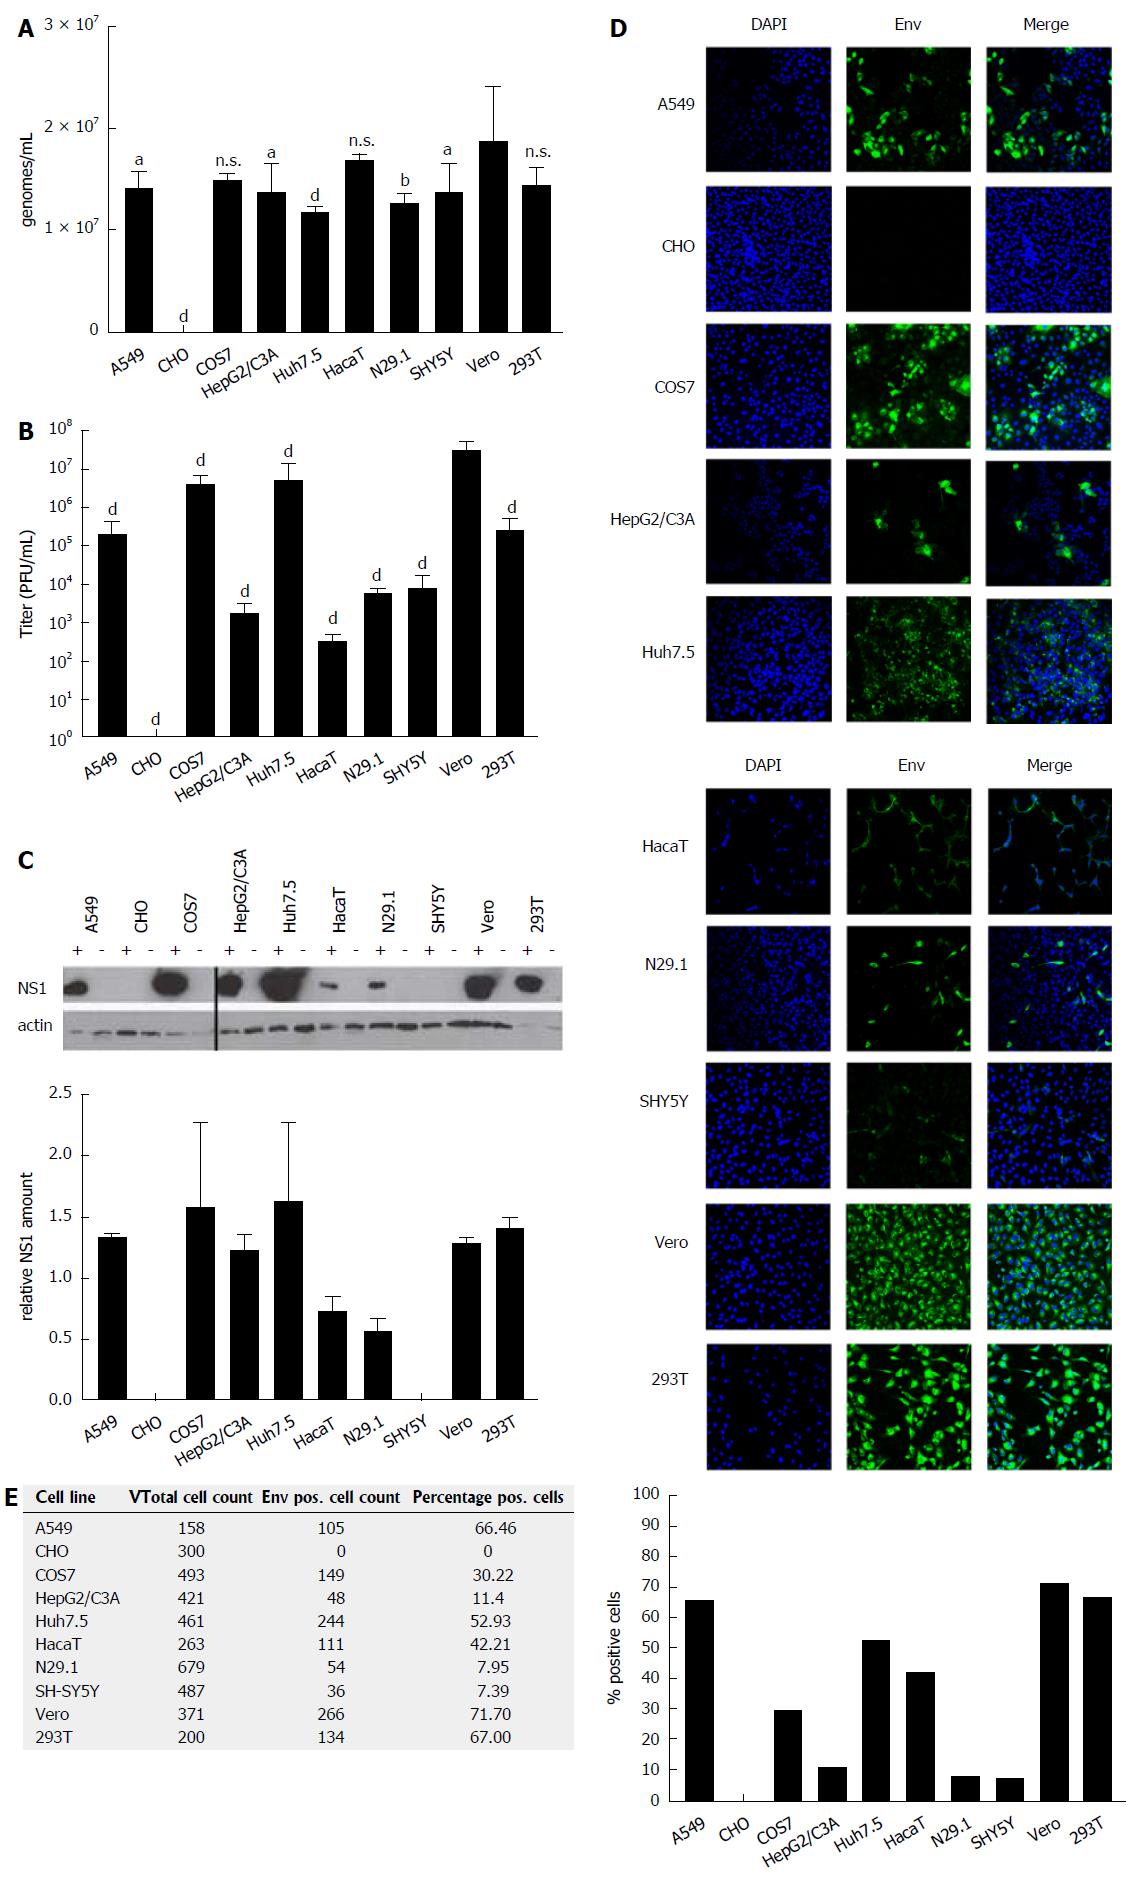
Figure 1 ZIKV-infected cells differ significantly with respect to the intracellular amount of infectious viral particles.
A: Cells were infected with an identical MOI of 0.1, using ZIKV Polynesia strain. Forty-eight hours after infection the intracellular amount of ZIKV-specific genomes was determined by RT-PCR. The data are the mean from four independent experiments. Amounts of Zika genomes are calculated using a Zika virus standard. A threshold value of 10 viral genomes was used. The bars represent the standard deviation of the mean. Statistical analysis was done by using 2-way ANOVA with Vero cells as reference value. aP < 0.05, bP < 0.01, dP < 0.0001; B: Cells were infected with an identical MOI of 0.1, using ZIKV Polynesia strain. Forty-eight hours after infection the cells were lysed and intracellular amount of infectious viral particles was determined by plaques assay using Vero cells. The data are the mean from four independent experiments. A threshold value of 10 plaques was used. The bars represent the standard deviation of the mean. Statistical analysis was done by using 2-way ANOVA with Vero cells as reference value. dP < 0.0001; C: Cells were infected with an identical MOI of 0.1, using ZIKV Polynesia strain. Forty-eight hours after infection the cells were lysed and intracellular amount of NS1 was determined by western blot analysis and referred to the amount of actin. The experiment was done in triplicate; one representative experiment is shown. Two different western blots from two independent experiments were quantified using Image J software. The relative NS1 amount represents the ratio between NS1 and actin; D: Cells were grown on cover slips and infected with an identical MOI of 0.1 using ZIKV Polynesia strain. Forty-eight hours after infection the cells were fixed by ethanol. To quantify the intracellular amount of ZIKV envelope protein and to analyze the subcellular distribution of the envelope protein in the different cell lines, confocal immunofluorescence microscopy was performed using an envelope-specific antibody (green fluorescence). Nuclei were stained by DAPI (blue fluorescence). The pictures were taken at 450-fold magnification; E: In two visual fields the total number of cells was determined by counting the number of DAPI-labeled cells. For quantification of ZIKV-positive cells immunofluorescence microscopy was performed using the envelope protein specific antibody 4G2. The percentage of ZIKV-positive cells was calculated and depicted in a diagram. ZIKV: Zika virus.
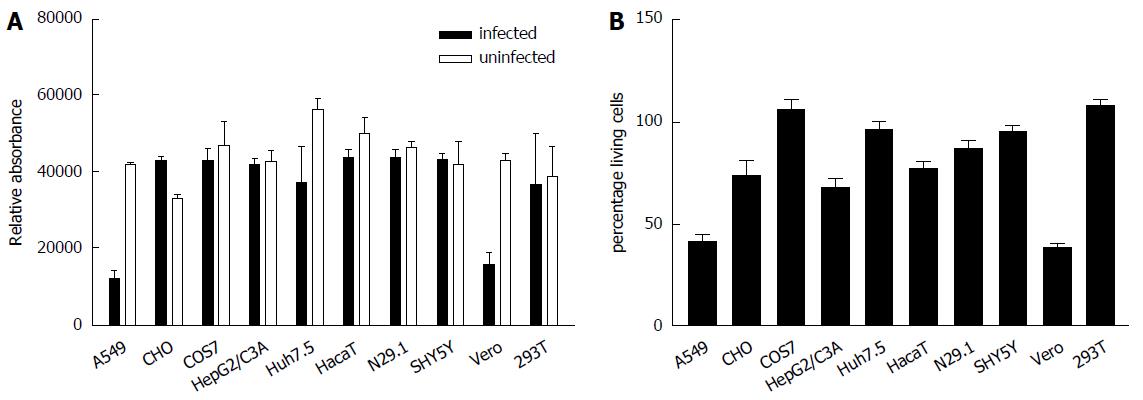
Figure 2 In A549 and Vero cells Zika virus exerts a pronounced cytopathogenic effect.
Cells were infected with ZIKV. A: Forty-eight hours post infection cell viability was analyzed by Presto blue assay; B: Cell integrity was analyzed by determination of the LDH-level in the cell culture supernatant. The data are the mean from three independent experiments. The bars represent the standard deviation of the mean.
Figure 3 Zika virus-infected cells release comparable amounts of viral genomes but differ significantly with respect to the intracellular amount of infectious viral particles.
A: The indicated cell lines were infected with a MOI = 0.1, RNA was isolated from the supernatant 48 h post infection and analyzed by qPCR. Amounts of Zika genomes are calculated using a Zika virus standard. Shown are the amounts of genomes/mL in the supernatant from four independent experiments. A threshold value of 10 viral genomes was used. The bars represent the standard errors of the mean. Statistical analysis was done by using 2-way ANOVA with Vero cells as reference value. bP < 0.01, dP < 0.0001; B: The indicated cells were infected with a MOI = 0.1 and supernatant was harvested 48 h post infection. To quantify the amount of released infectious viral particles, the obtained supernatants were used for plaque assays on Vero cells. Plaques were visualized and counted 4 d after infection. The data are from four independent experiments. A threshold value of 10 plaques was used. The bars represent the standard errors of the mean. Statistical analysis was done by using 2-way ANOVA with Vero cells as reference value. aP < 0.05.
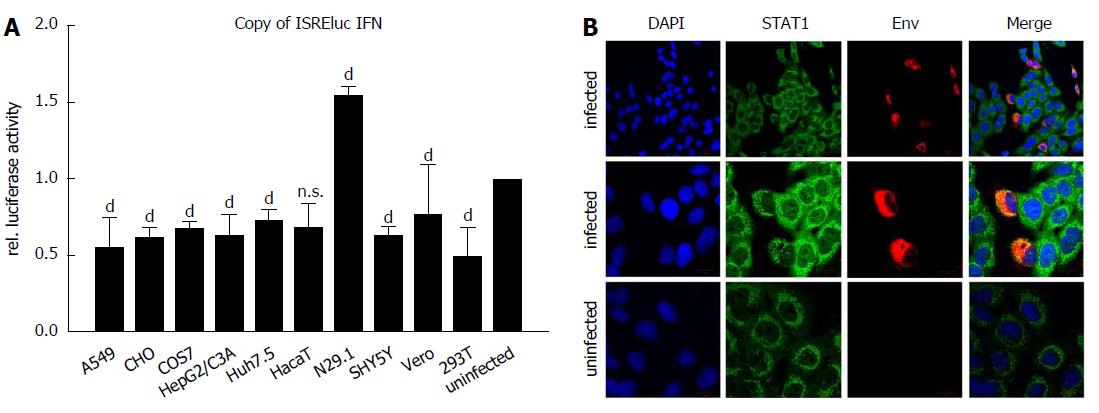
Figure 4 Delocalization of STAT1 in Zika virus-infected cells.
A: The indicated cell lines were either infected with a MOI = 0.1 or left uninfected and directly afterwards transfection with the pISREluc reporter was performed. 16 h later the cells were washed once with PBS and luciferase activity was measured 48 hpi. The data are from three independent experiments and for each cell line the uninfected controls were set as one, acting as the reference. The bars represent the standard errors of the mean. Statistical analysis was done by using 2-way ANOVA with Vero cells as reference value. bP < 0.01, dP < 0.0001; B: Detection of STAT1 by confocal immunofluorescence microscopy of ZIKV-infected and uninfected A549 cells. Cells were grown on cover slips and infected with a MOI of 0.1 using ZIKV Polynesia strain. 6 h after infection the cells were fixed with ethanol. Detection of STAT1 was performed using the green channel and Zika specific staining was performed using an envelope-specific antibody (green fluorescence). Nuclei were stained by DAPI (blue fluorescence). The pictures were taken at 450-fold and 1000-fold magnification respectively (scale bars represent 10 μm). ZIKV: Zika virus.
- Citation: Himmelsbach K, Hildt E. Identification of various cell culture models for the study of Zika virus. World J Virol 2018; 7(1): 10-20
- URL: https://www.wjgnet.com/2220-3249/full/v7/i1/10.htm
- DOI: https://dx.doi.org/10.5501/wjv.v7.i1.10


