Copyright
©The Author(s) 2025.
World J Transplant. Mar 18, 2025; 15(1): 96025
Published online Mar 18, 2025. doi: 10.5500/wjt.v15.i1.96025
Published online Mar 18, 2025. doi: 10.5500/wjt.v15.i1.96025
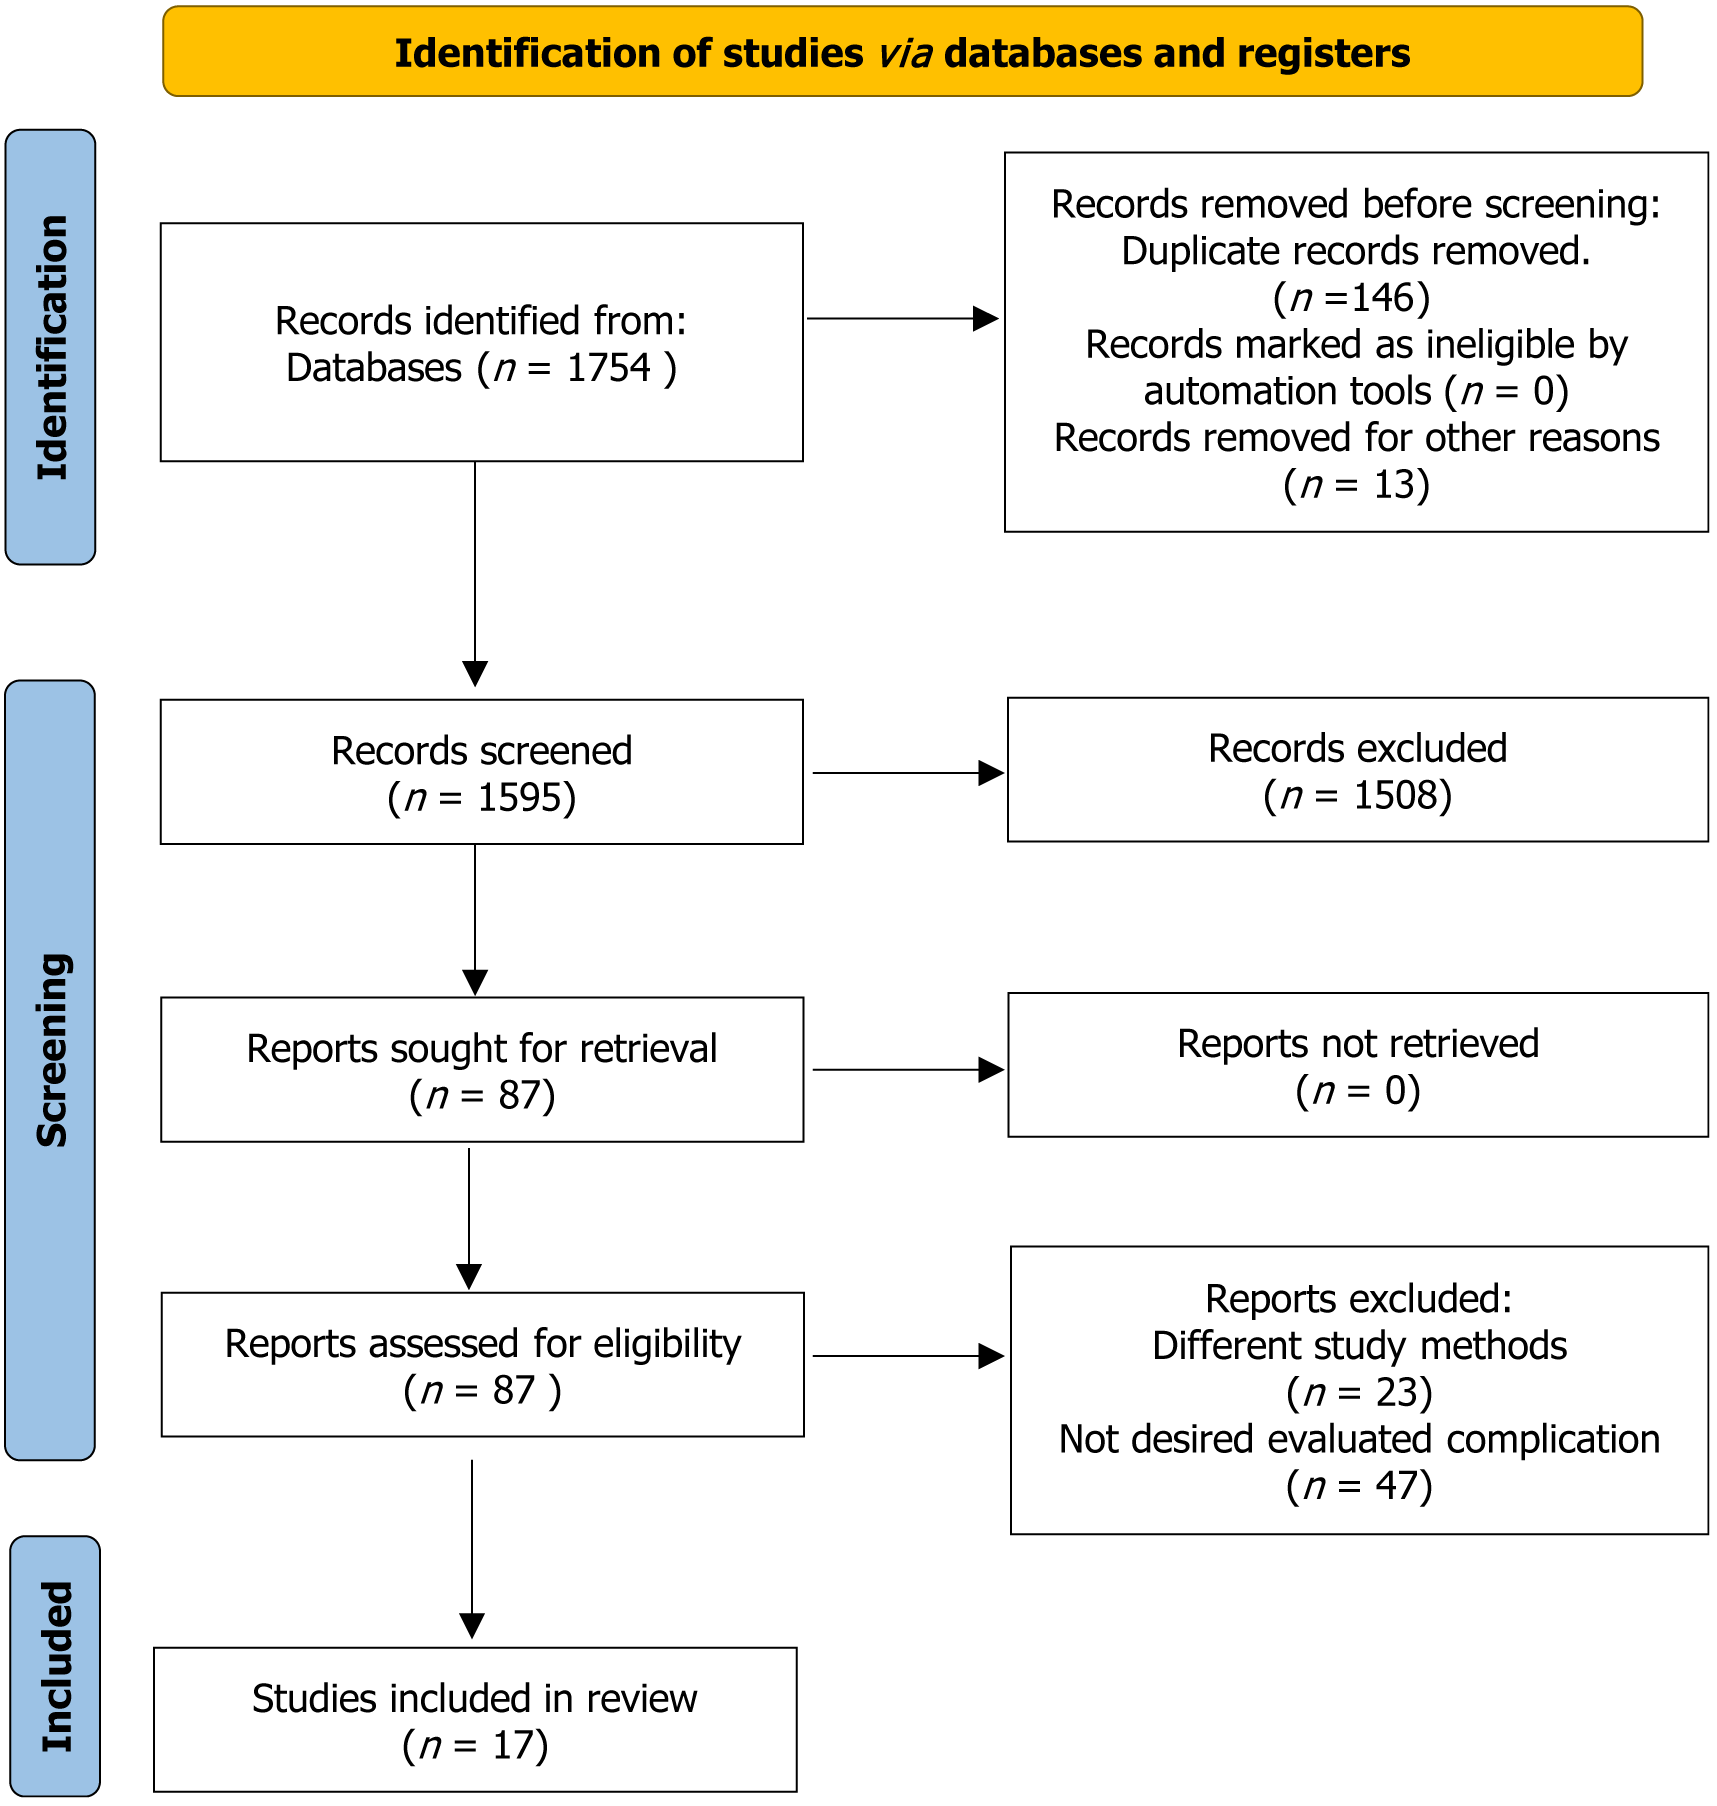
Figure 1 Prisma flow chart.
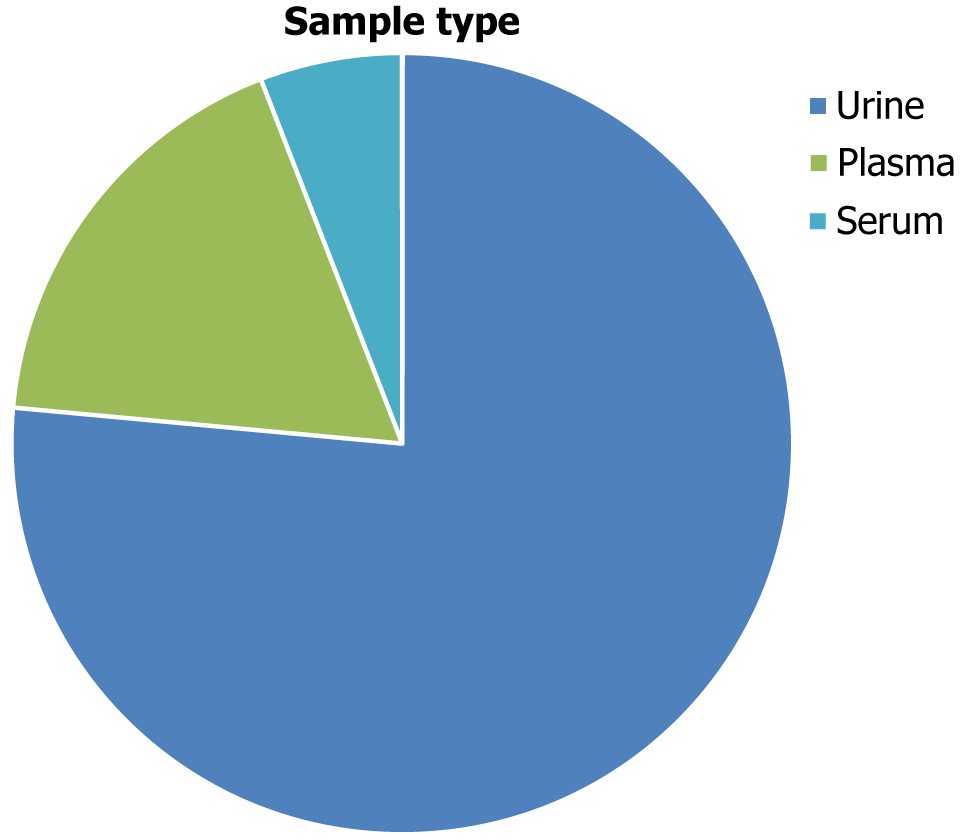
Figure 2 Quantitative data about the biological sample selection in all the included samples.
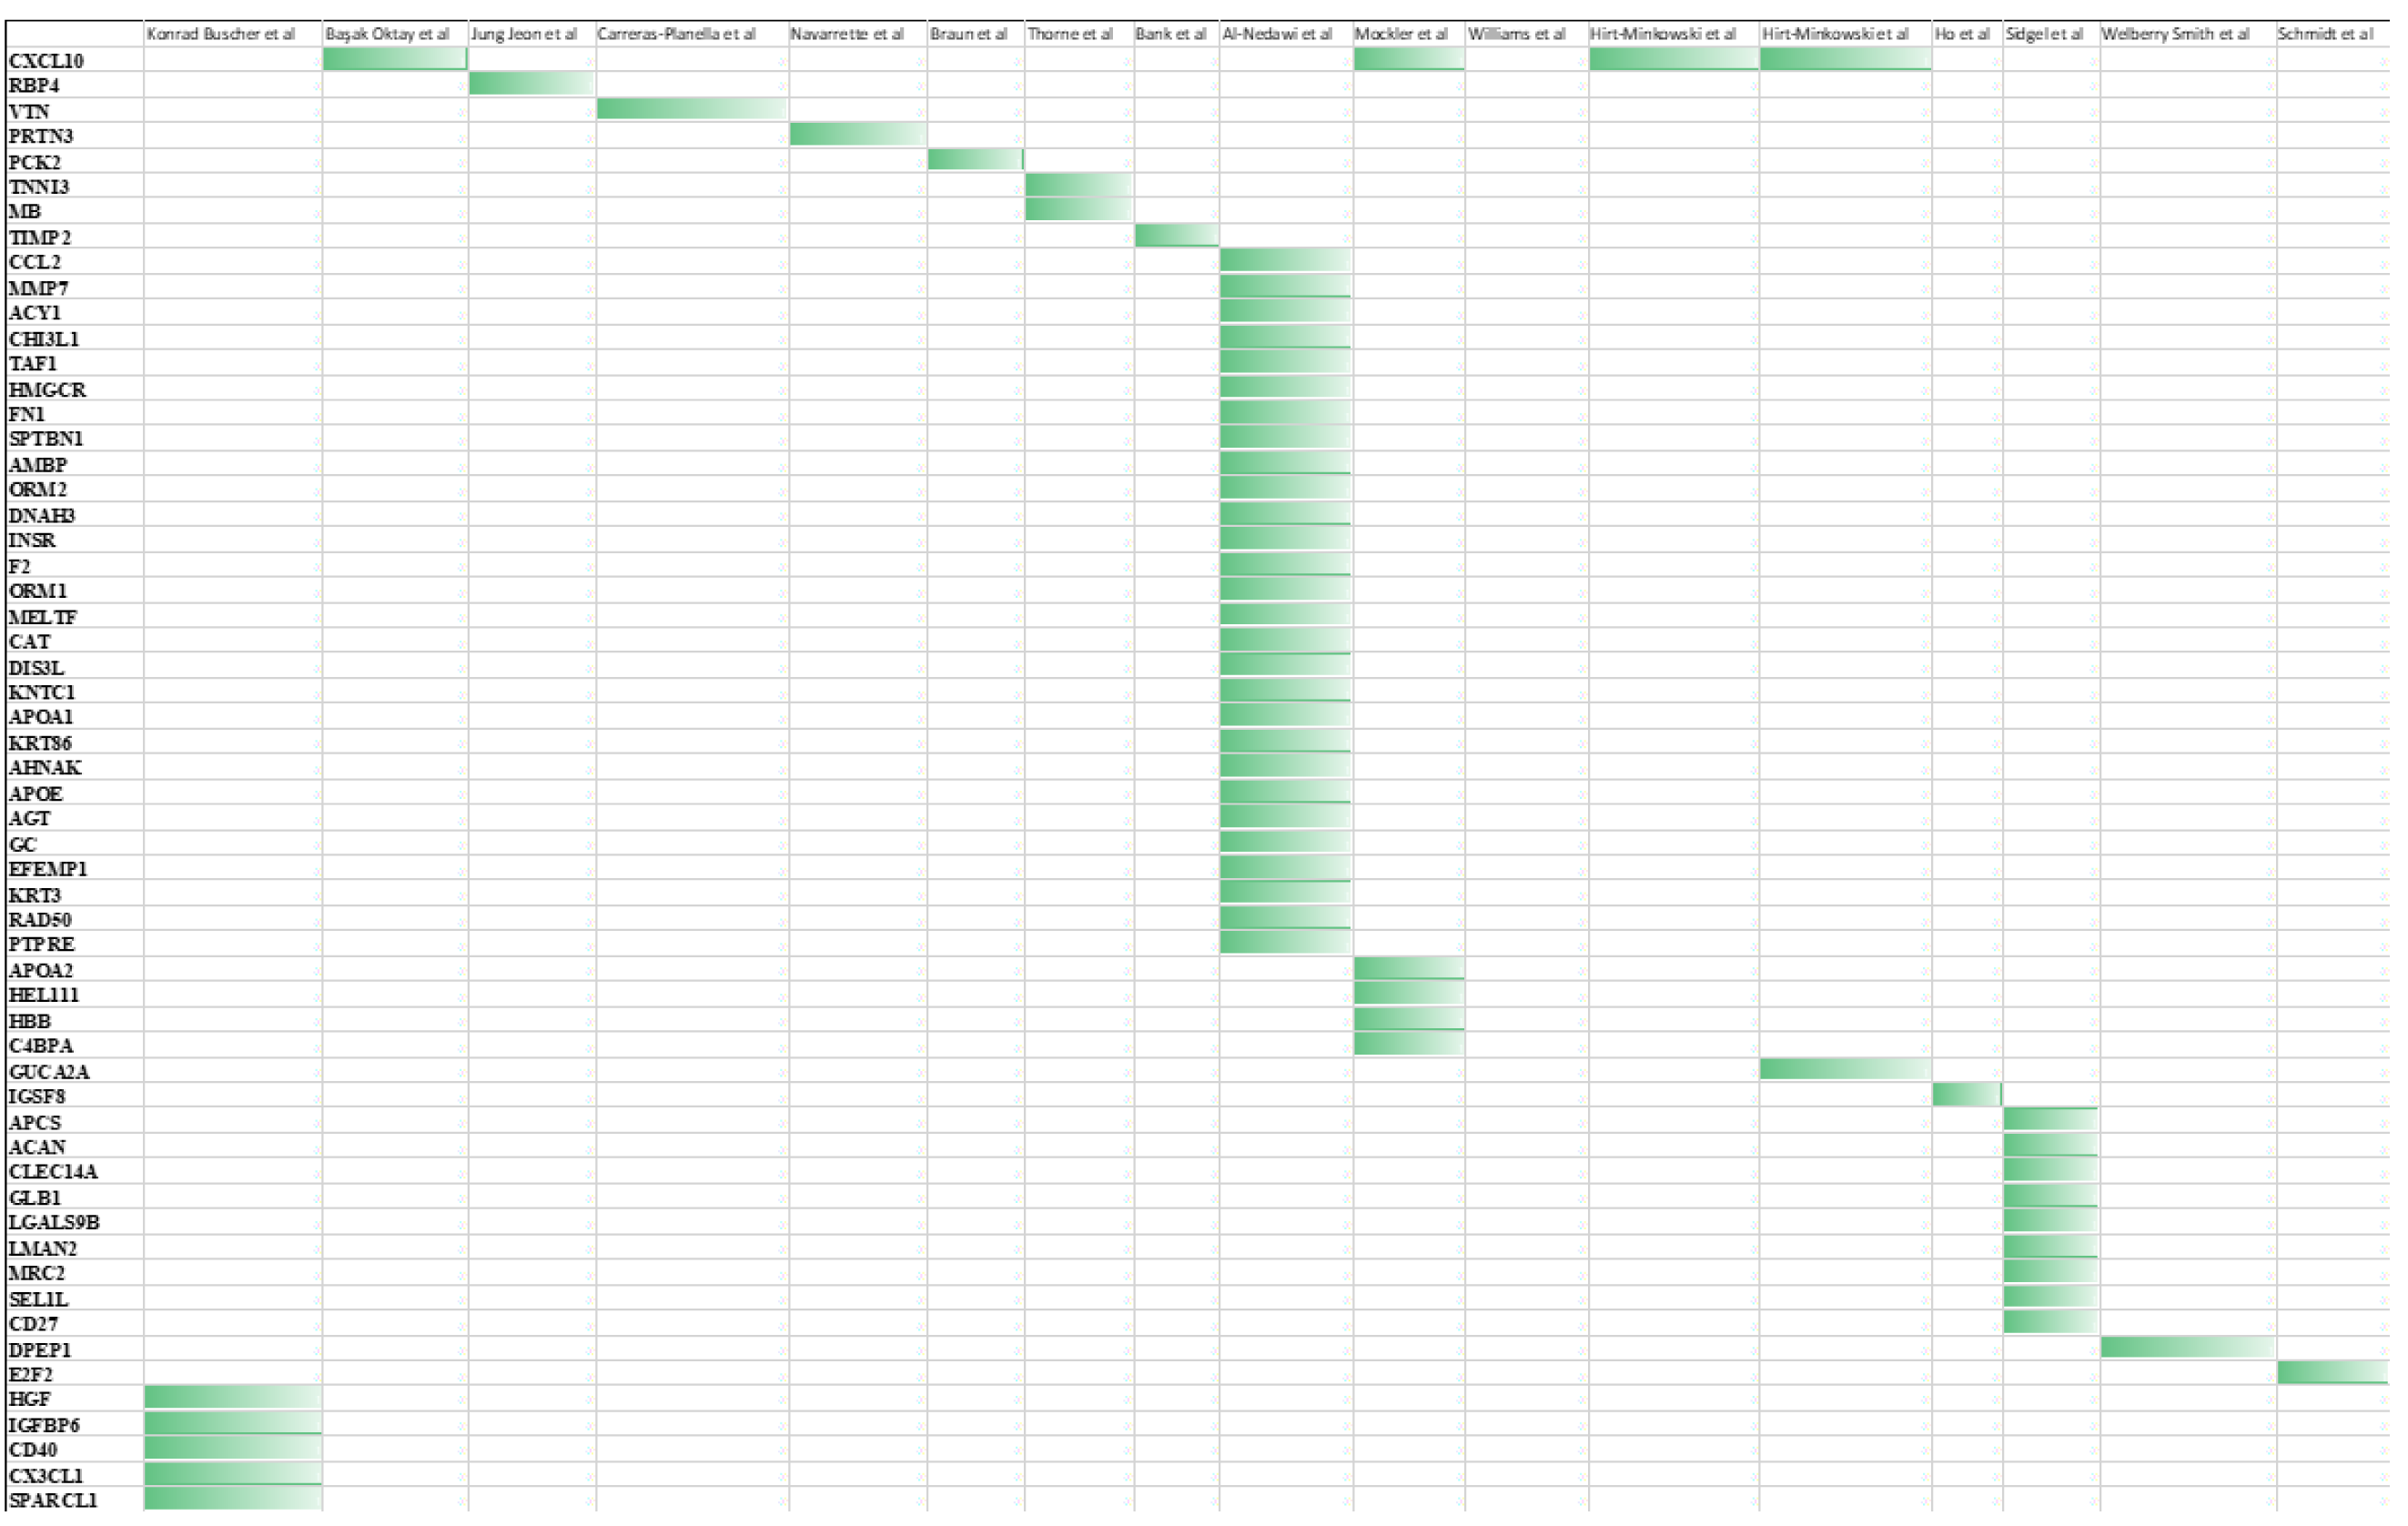
Figure 3 Heatmap representation of proteins detected across various studies related to kidney transplantation.
Each column represents a different study or dataset, and each row represents a specific protein. Green color indicates the protein detection within each study.
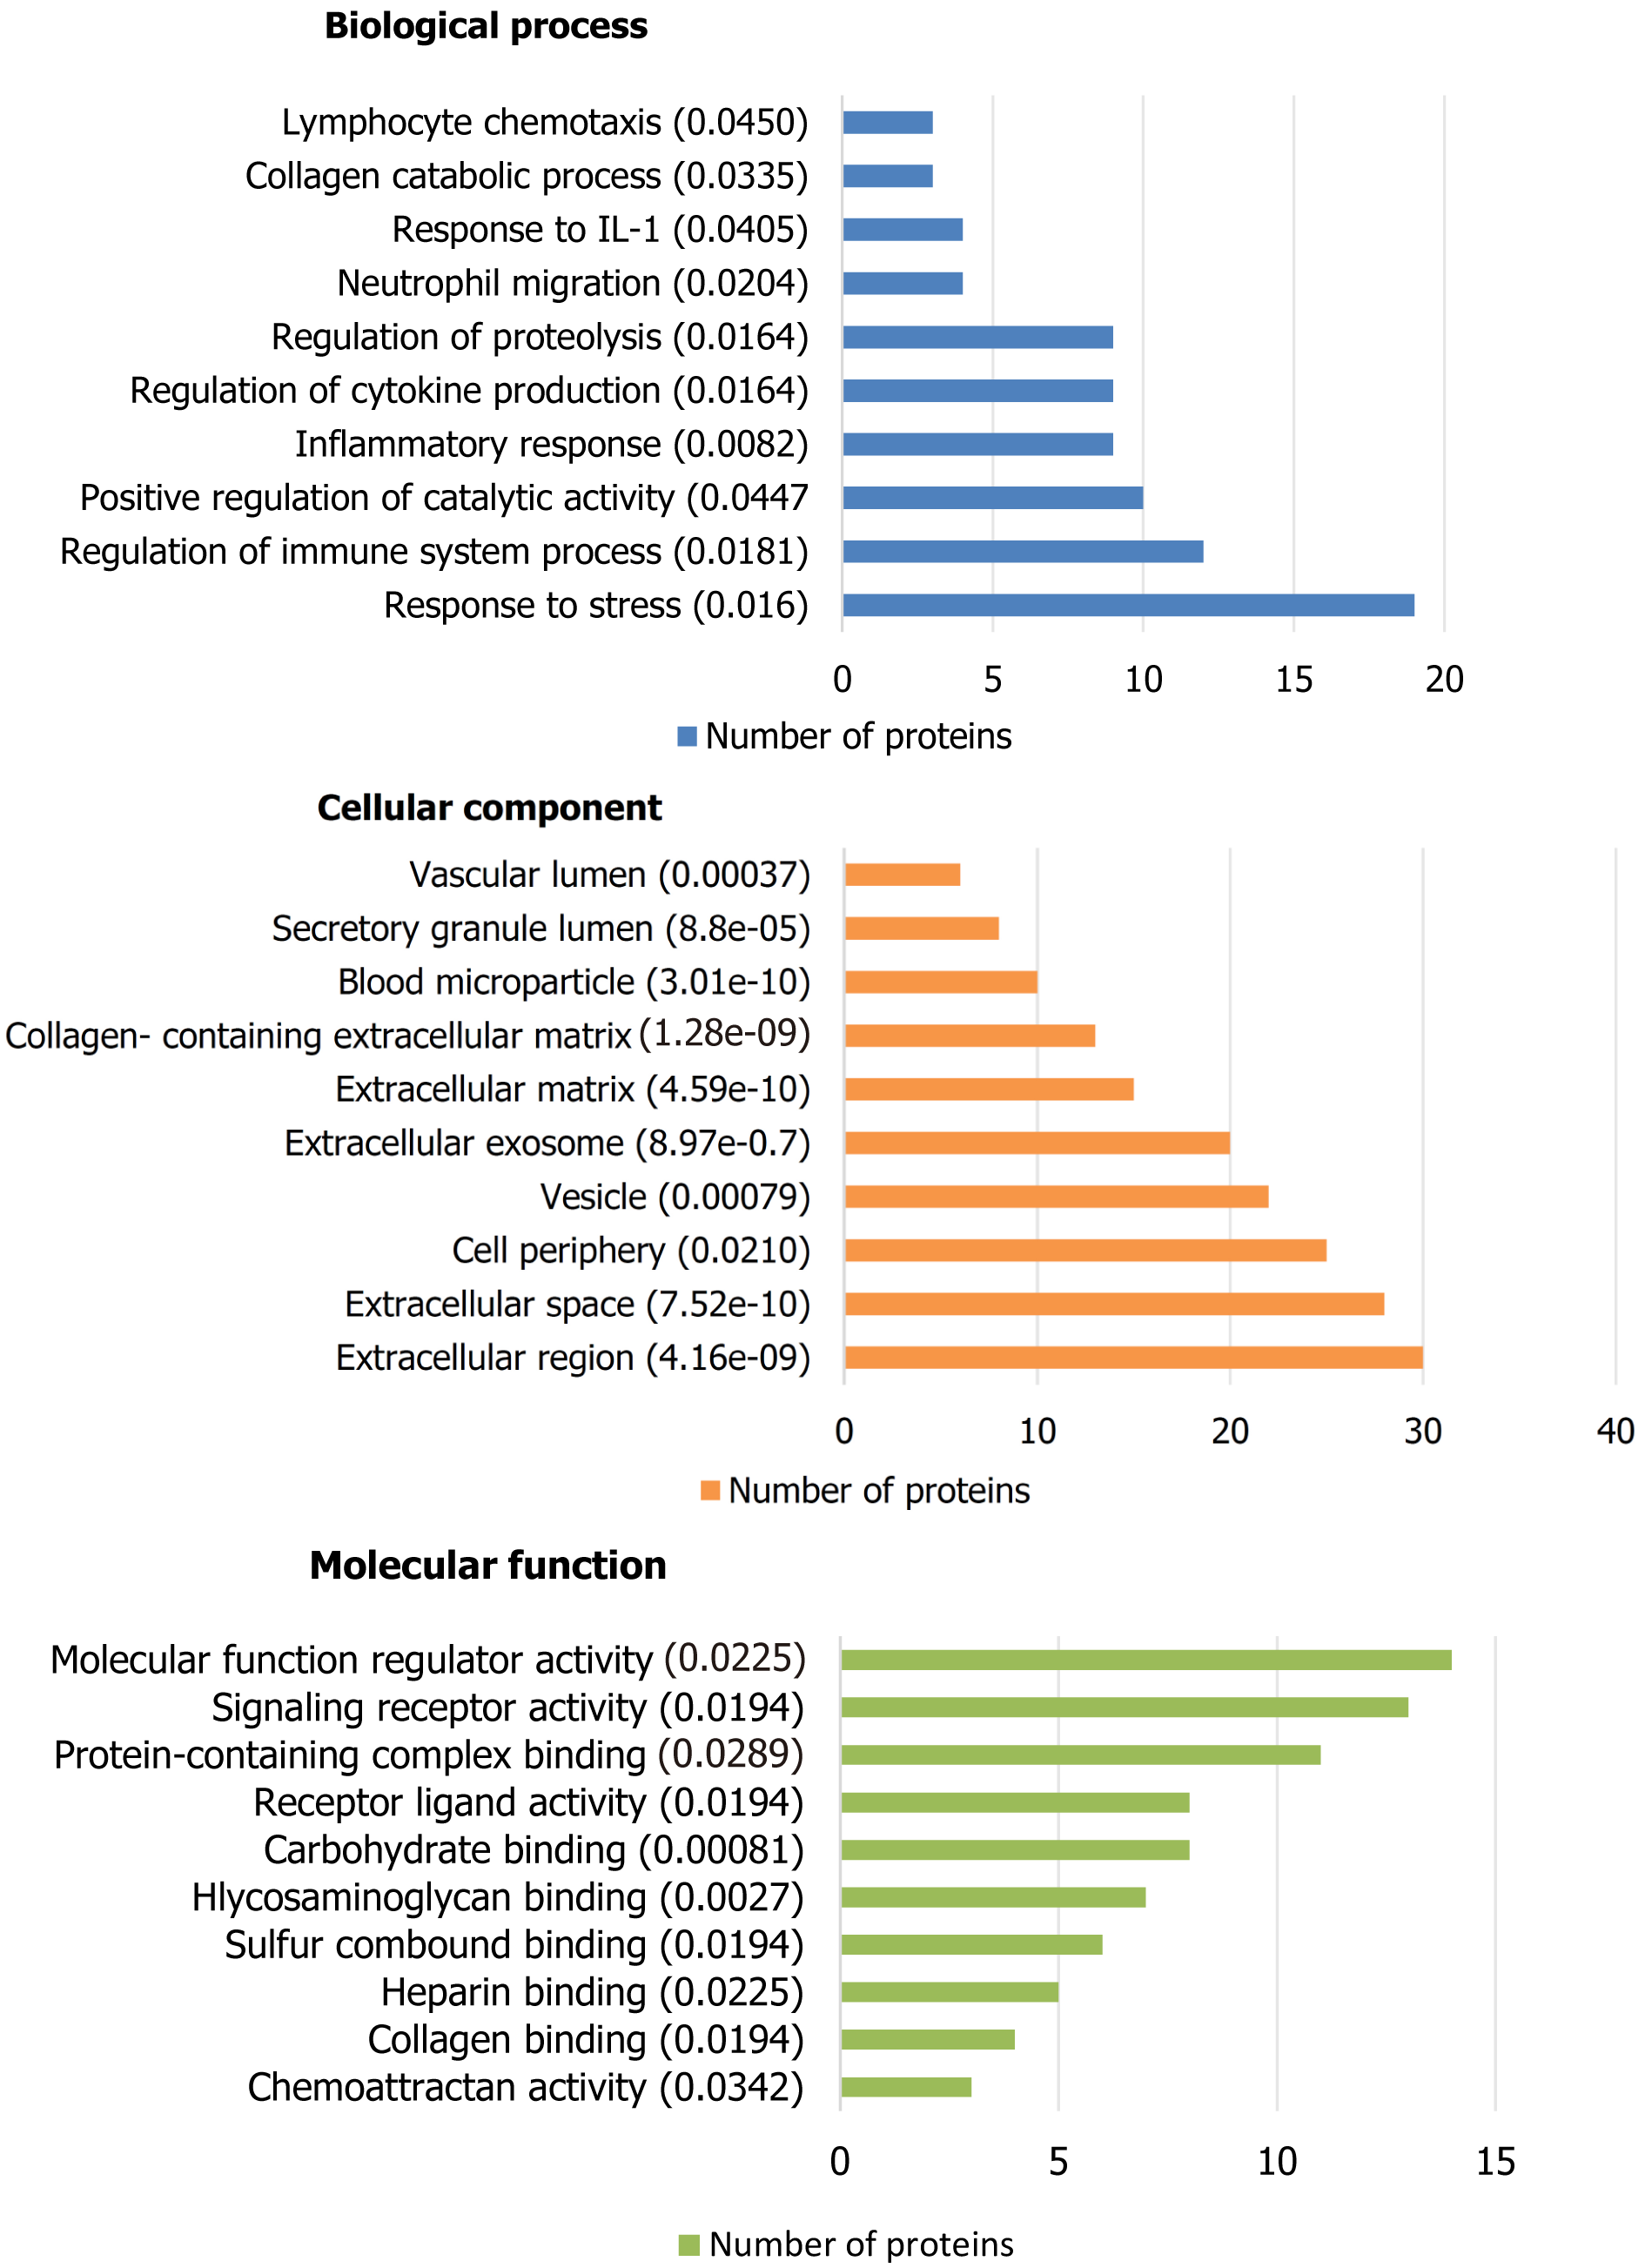
Figure 4 Gene ontology analysis of upregulated proteins detected on samples of kidney transplant recipients with graft injury or dysfunction.
False discovery rate is mentioned in the parenthesis.
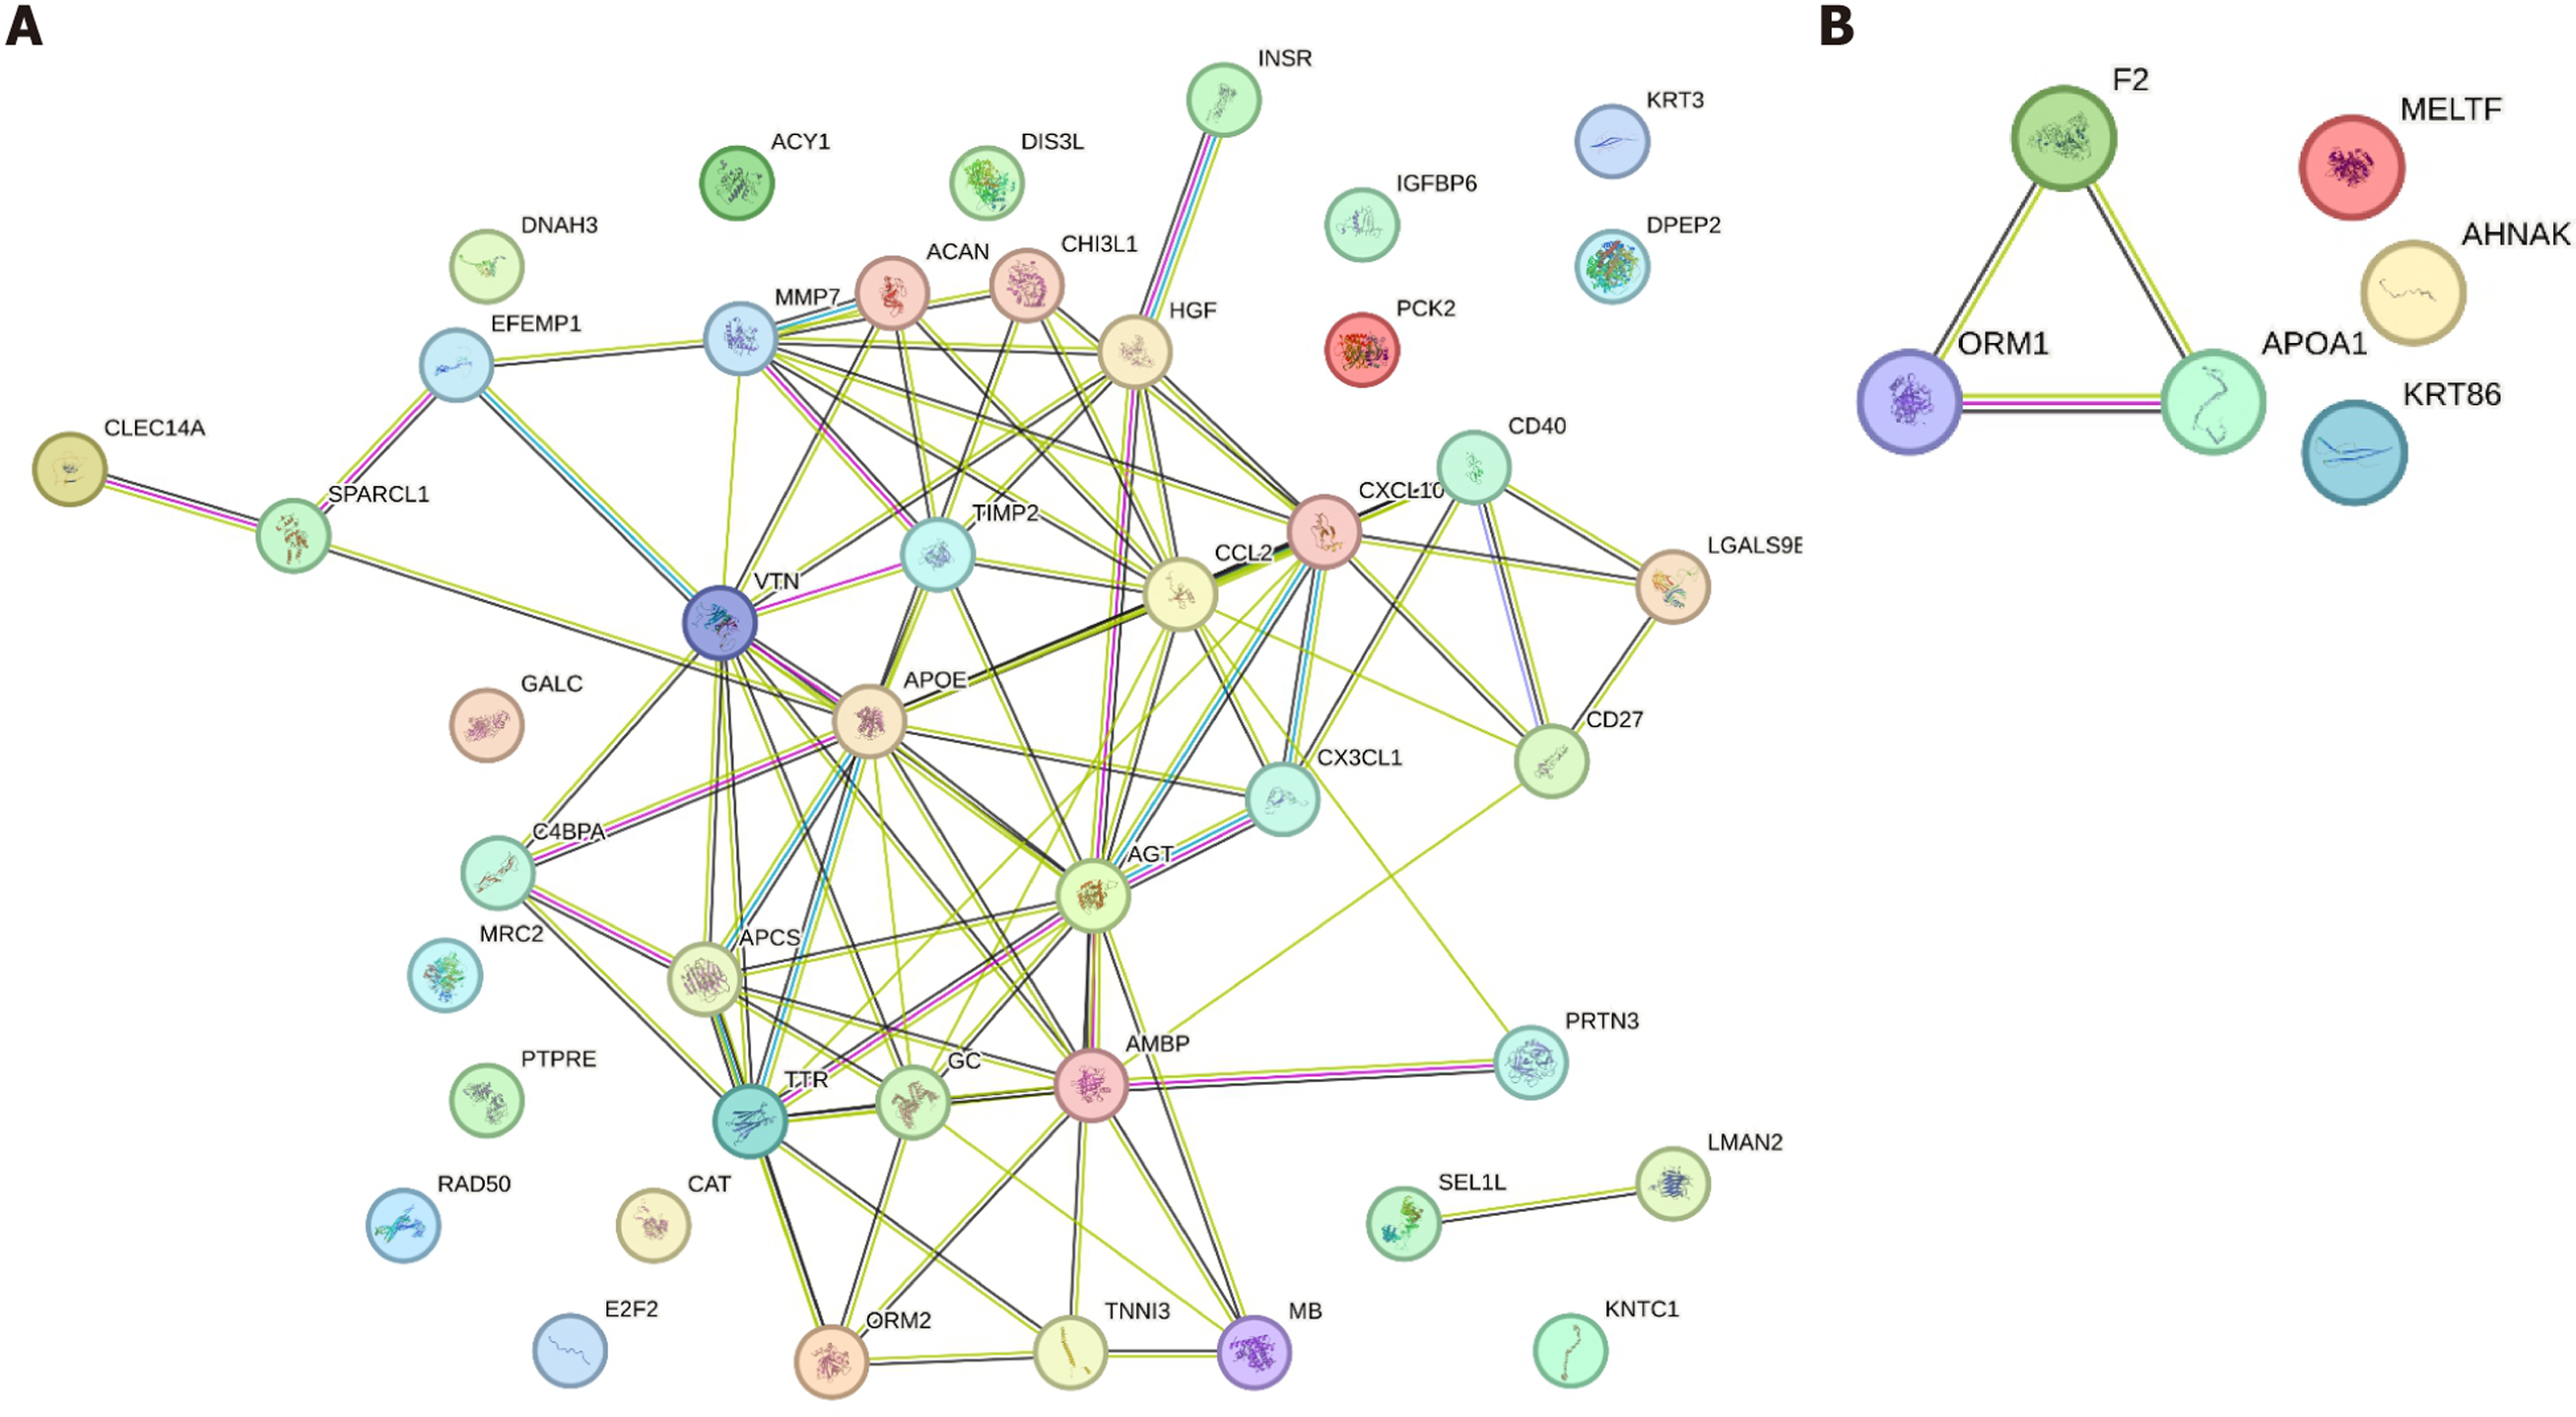
Figure 5 Protein interaction network analysis.
A: A protein interaction network of upregulated proteins detected in biological fluids of recipients with complicated transplantations. The proteins related to immune biological pathways are highlighted; B: A protein interaction network of proteins related to normal kidney function.
- Citation: Avramidou E, Psatha K, St John K, Tsoulfas G, Aivaliotis M. Future of non-invasive graft evaluation: A systematic review of proteomics in kidney transplantation. World J Transplant 2025; 15(1): 96025
- URL: https://www.wjgnet.com/2220-3230/full/v15/i1/96025.htm
- DOI: https://dx.doi.org/10.5500/wjt.v15.i1.96025


