Copyright
©The Author(s) 2023.
World J Transplant. Dec 18, 2023; 13(6): 331-343
Published online Dec 18, 2023. doi: 10.5500/wjt.v13.i6.331
Published online Dec 18, 2023. doi: 10.5500/wjt.v13.i6.331
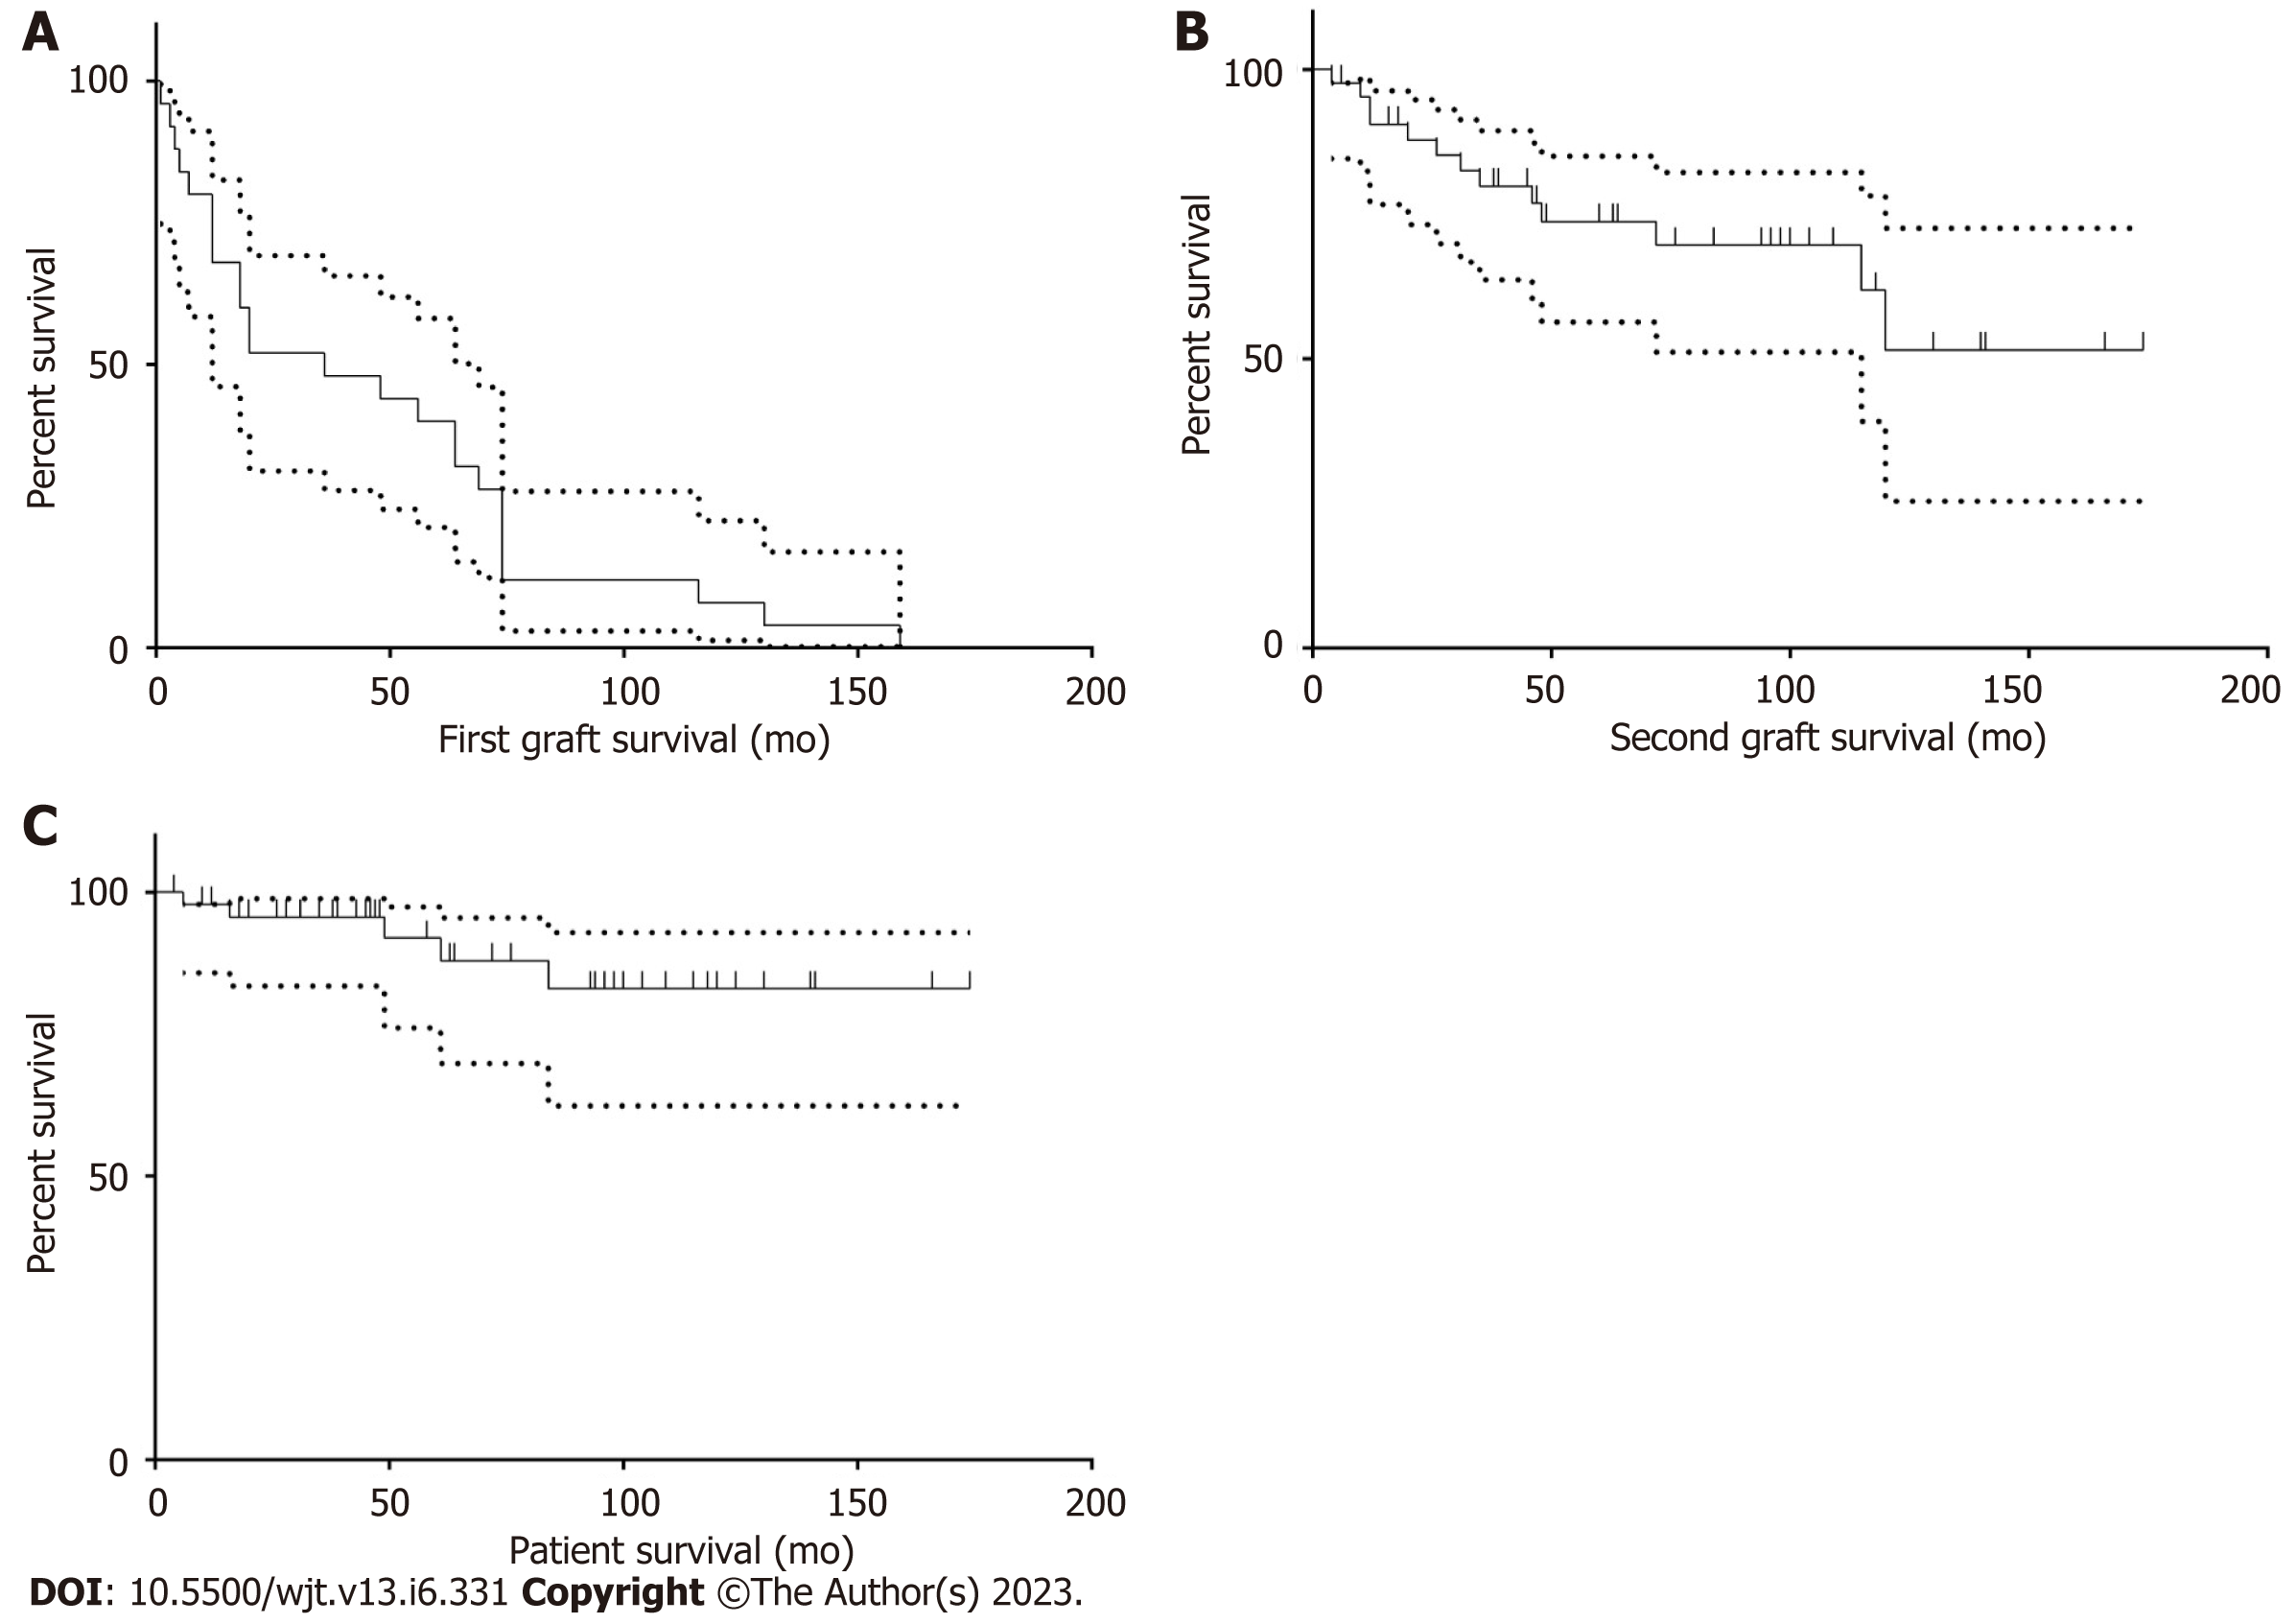
Figure 1 Kaplan-Meier curve for overall survival rates.
A: First graft survival with 95% confidence bands. Twenty-three cases were excluded from the analysis due to primary non-function grafts. All 25 cases had the event; B: Second graft survival with 95% confidence bands. Five cases were excluded from the analysis due to primary non-function grafts. Thirteen cases had the event, while 30 cases were censored; C: Patient survival after the second kidney transplantation with 95% confidence bands. Only five patients died, while 43 patients were censored.
Figure 2 Kaplan-Meier curves for the second graft survival stratified by the mode of graft function.
A: In the first kidney transplantation; B: In the second kidney transplantation.
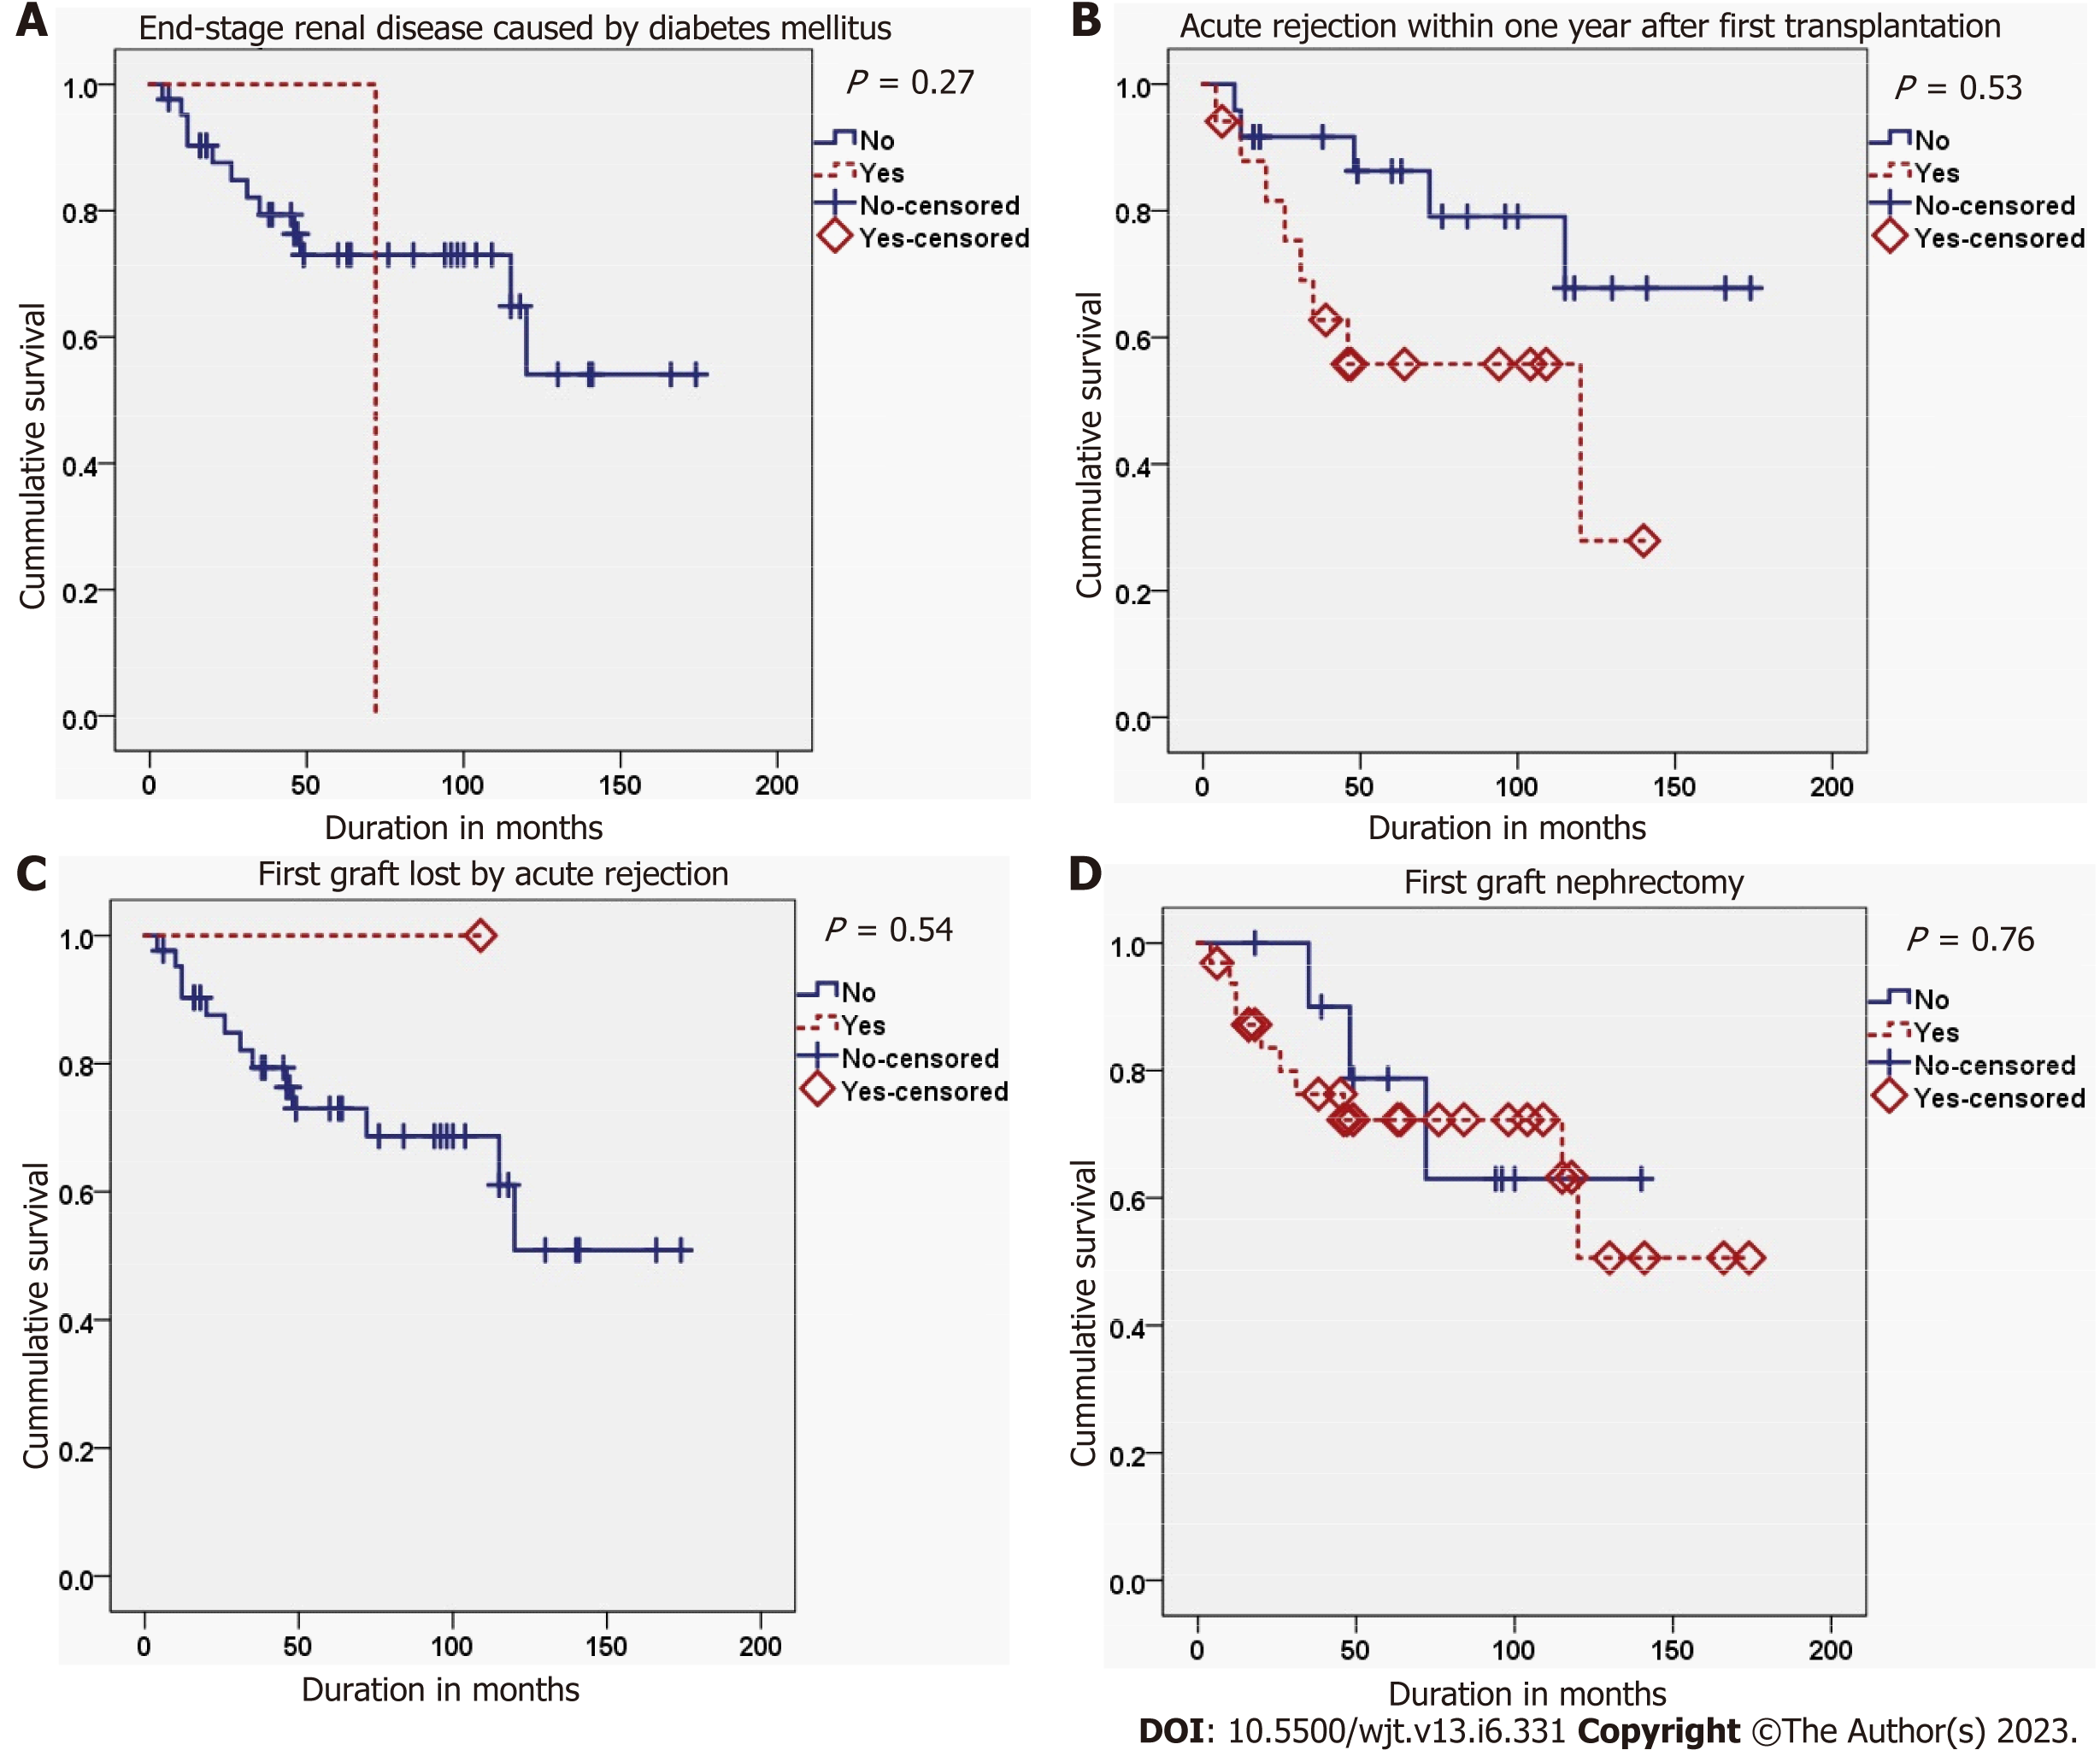
Figure 3 Kaplan-Meier curves for the second graft survival stratified by four non-significant predictors related to the first kidney transplantation.
A: End-stage renal disease caused by diabetes mellitus; B: Acute rejection within one year after first transplantation; C: First graft loss by acute rejection; D: First graft nephrectomy.
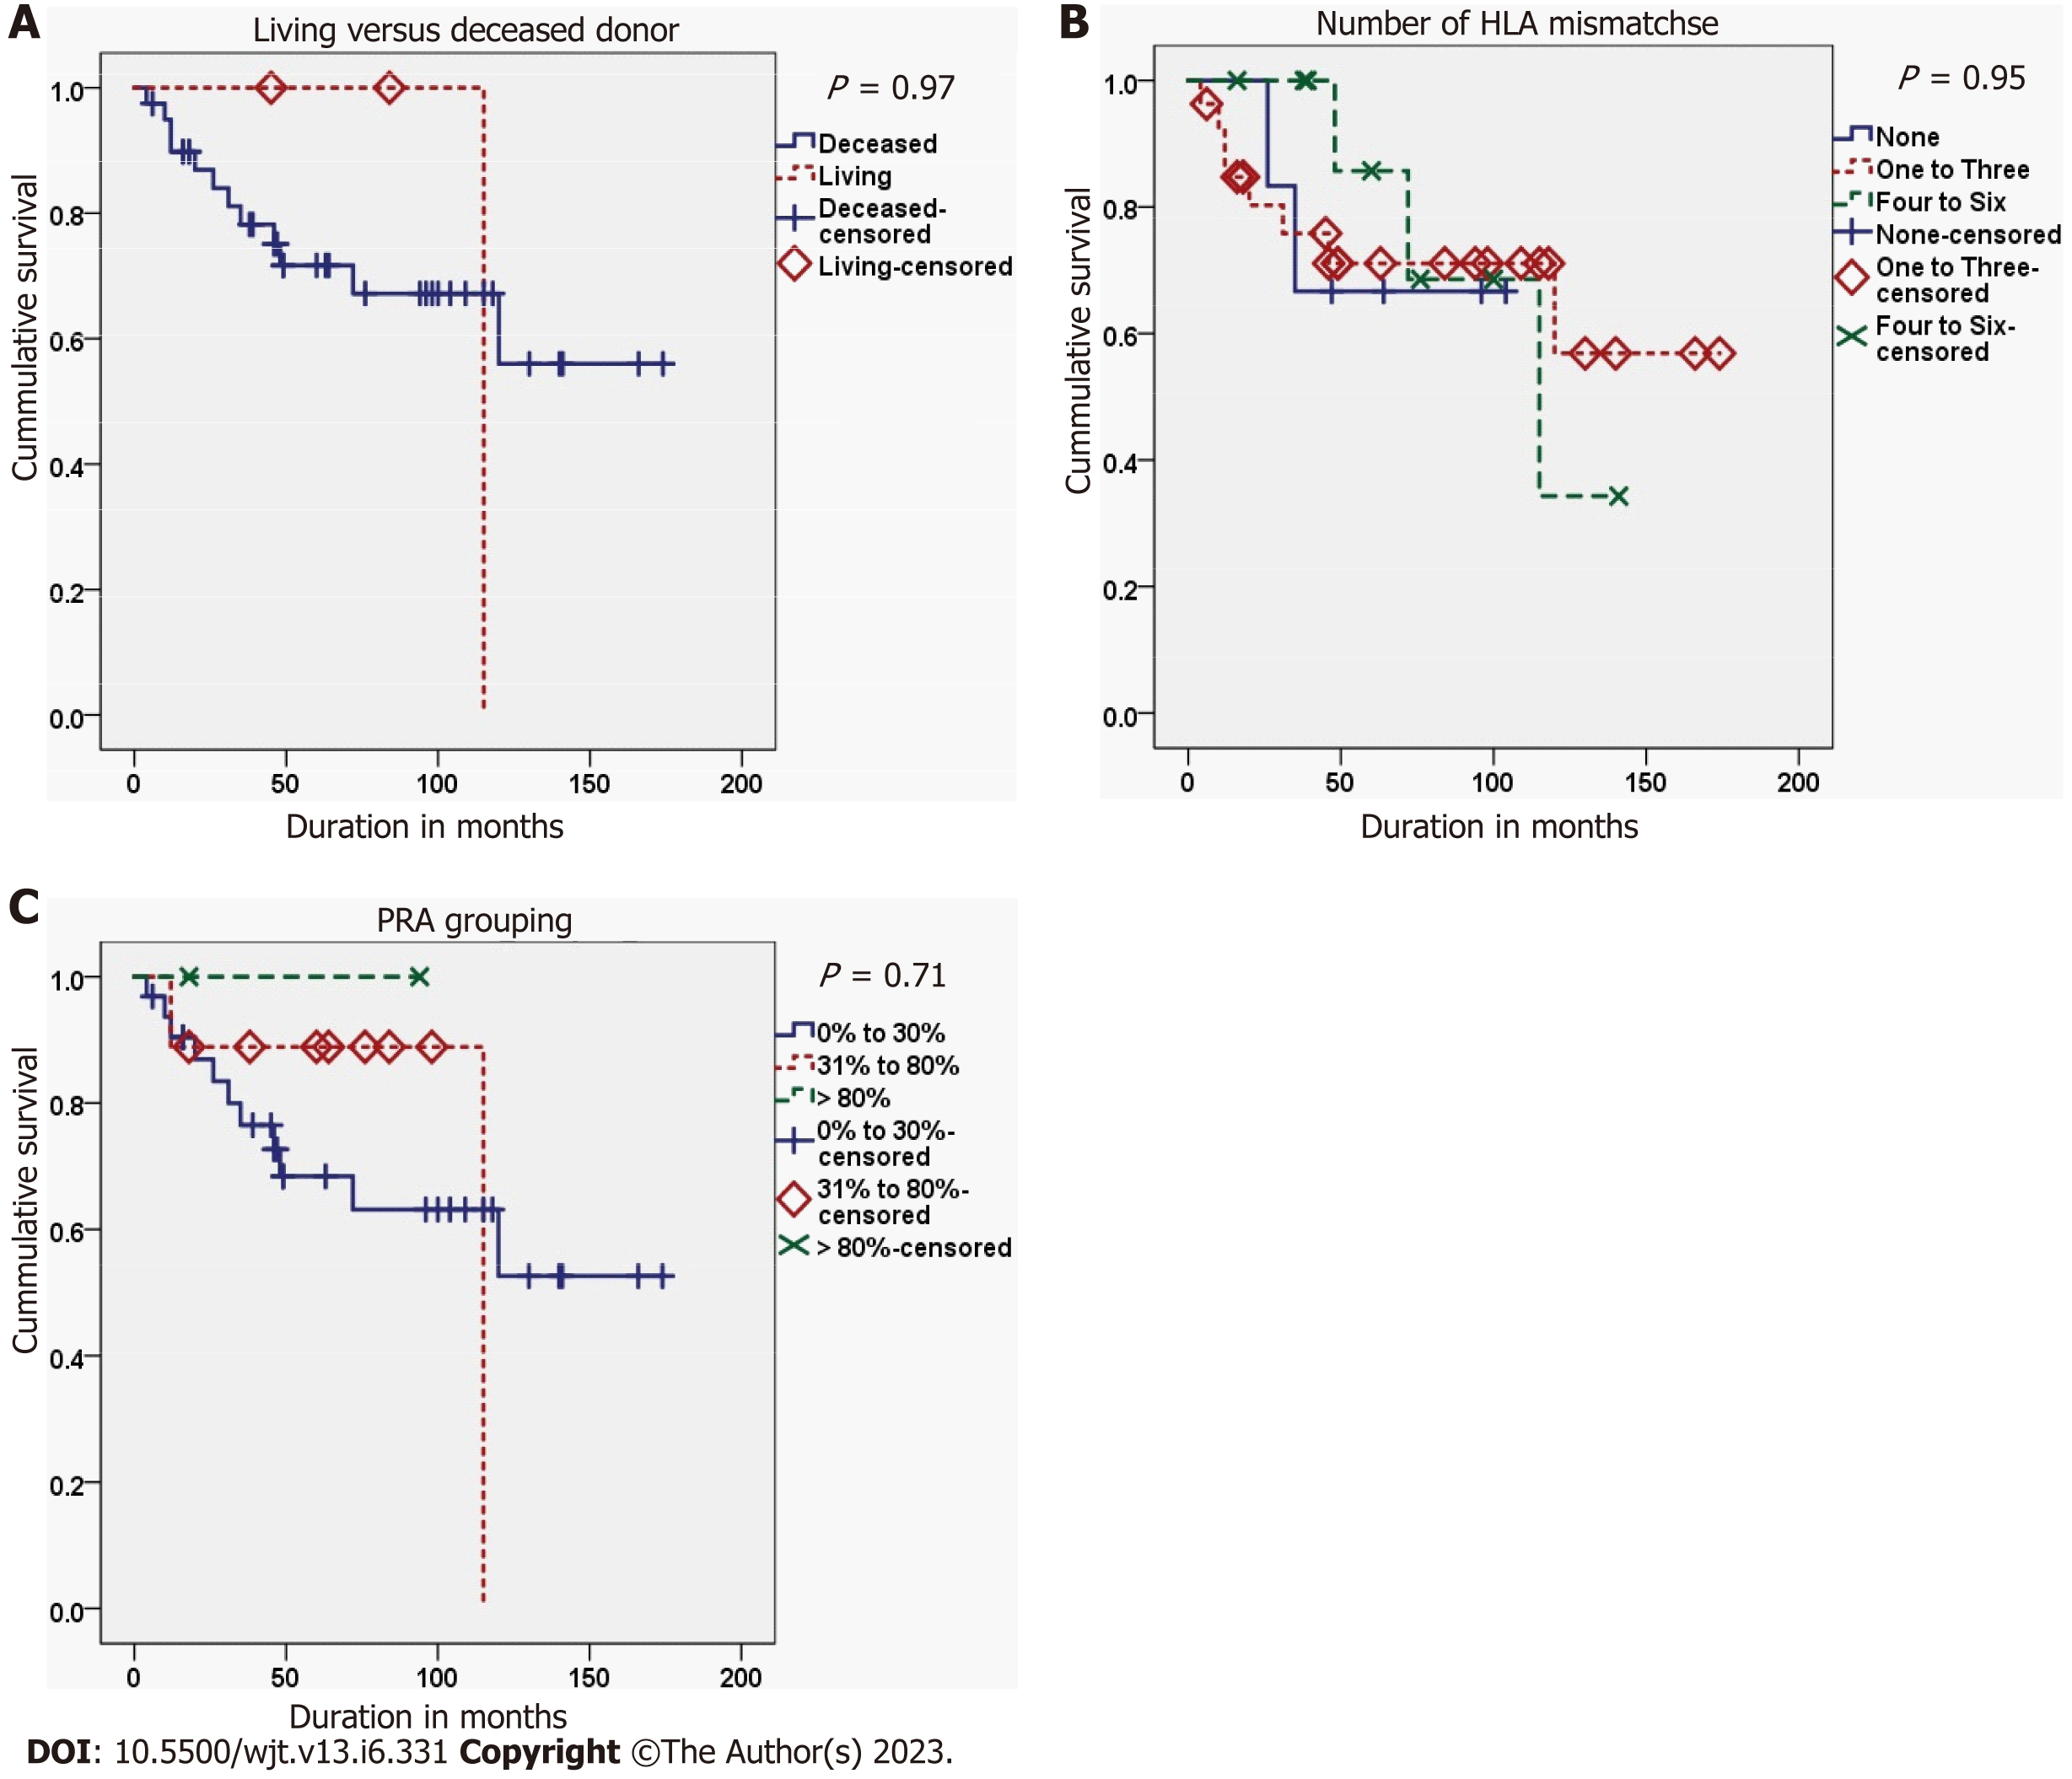
Figure 4 Kaplan-Meier curves for the second graft survival stratified by three non-significant predictors related to the donor of second kidney transplantation.
A: Living versus deceased donor; B: Number of human leukocytic antigens mismatches; C: Panel reactive antibodies. HLA: human leukocytic antigens; PRA: Panel reactive antibodies.
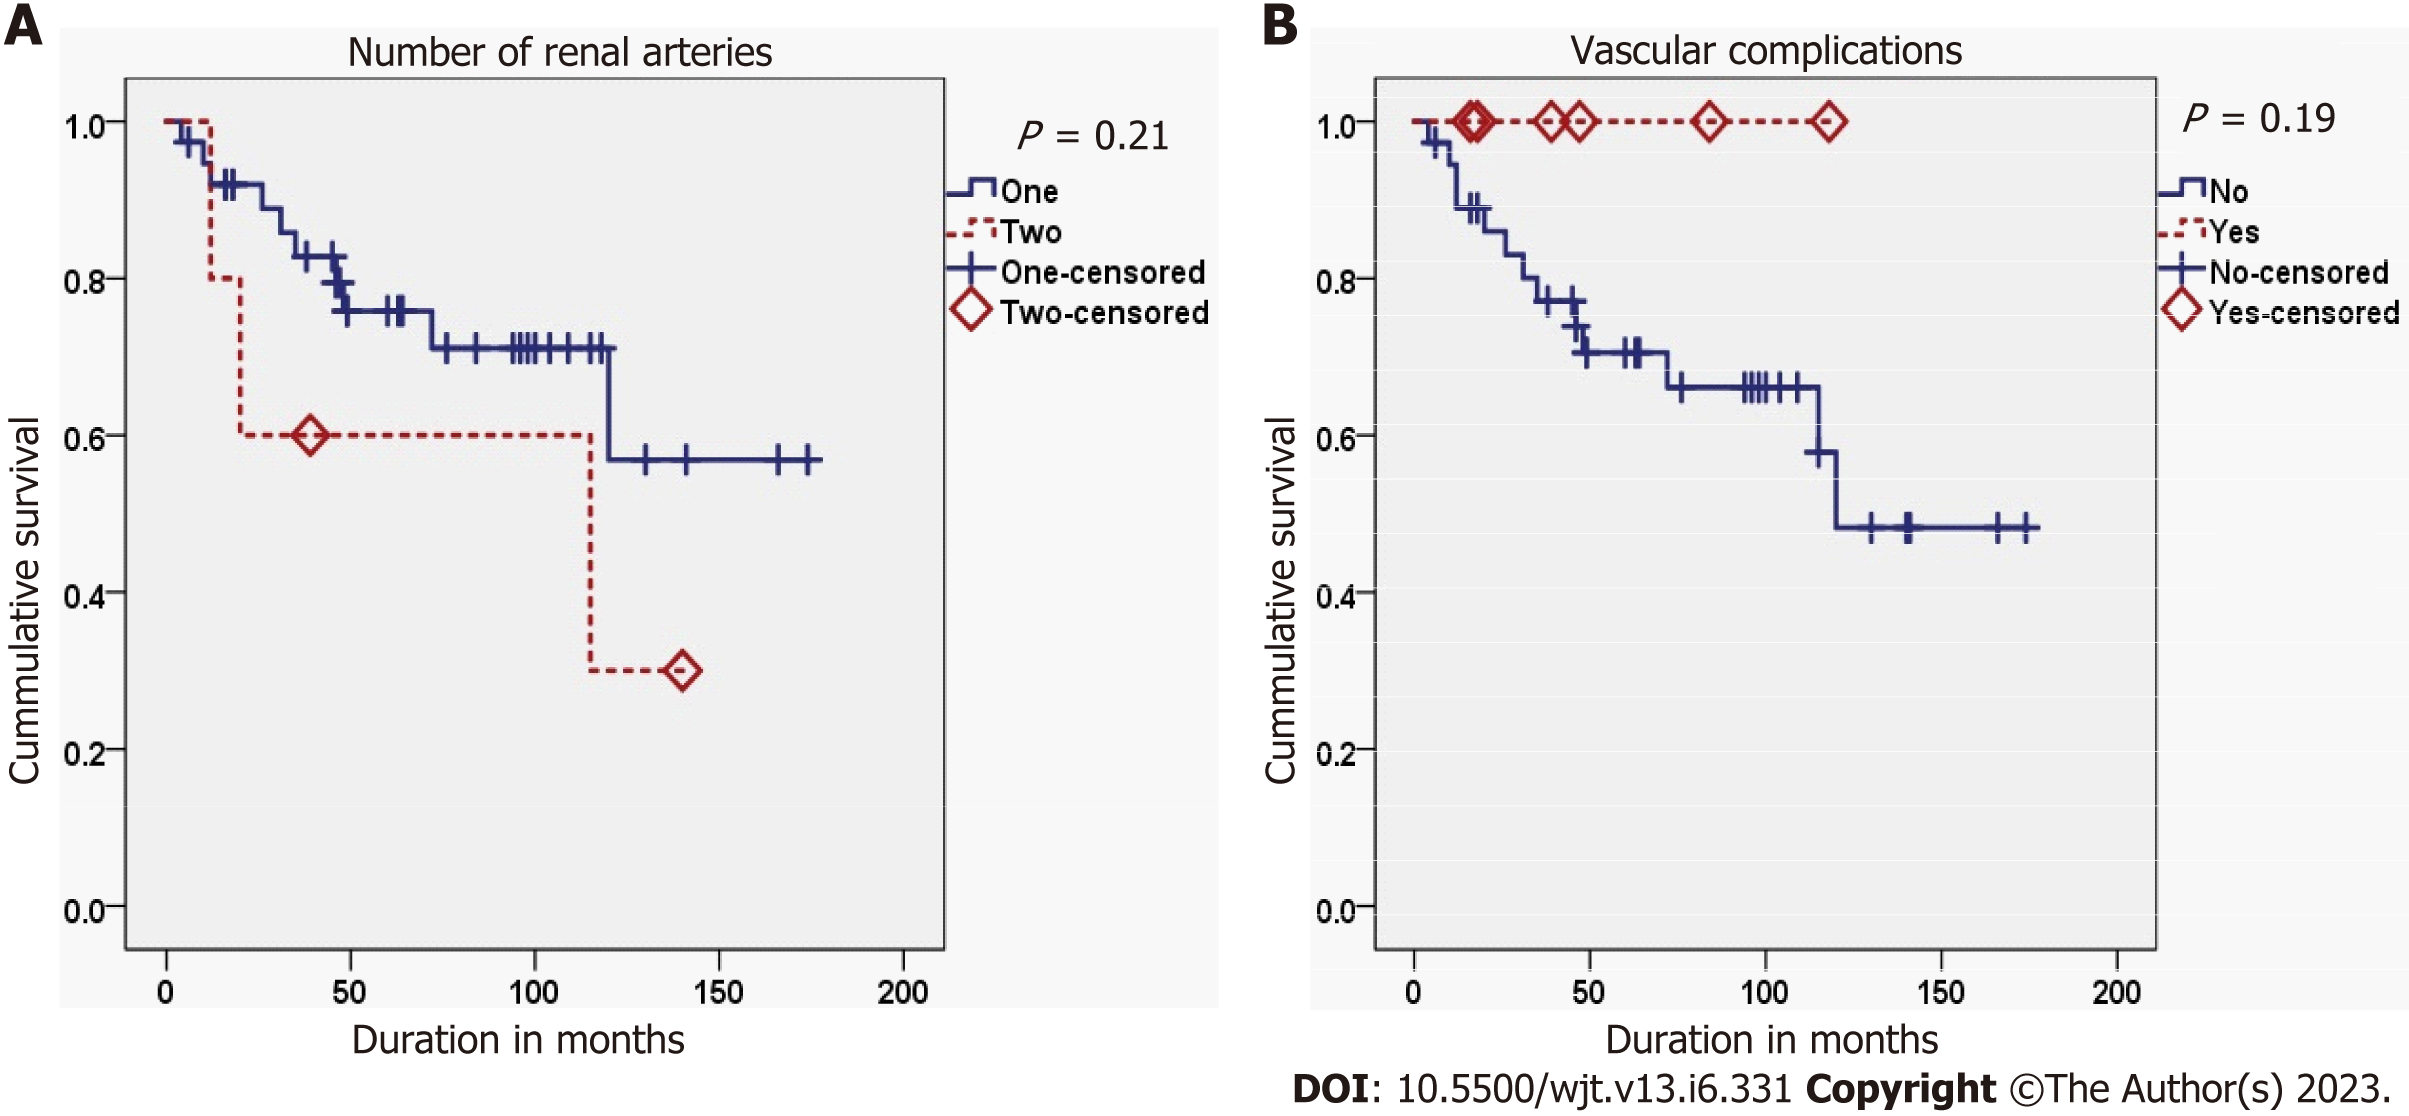
Figure 5 Kaplan-Meier curves for the second graft survival stratified by second non-significant predictors related to the second kidney transplantation recipient.
A: Number of renal arteries; B: Vascular complications.
- Citation: Khalil M, Gadelkareem RA, Abdallah MA, Sayed MAB, Elanany FG, Fornara P, Mohammed N. Predictors of graft function and survival in second kidney transplantation: A single center experience. World J Transplant 2023; 13(6): 331-343
- URL: https://www.wjgnet.com/2220-3230/full/v13/i6/331.htm
- DOI: https://dx.doi.org/10.5500/wjt.v13.i6.331


