Copyright
©The Author(s) 2024.
World J Psychiatry. Jan 19, 2025; 15(1): 98630
Published online Jan 19, 2025. doi: 10.5498/wjp.v15.i1.98630
Published online Jan 19, 2025. doi: 10.5498/wjp.v15.i1.98630
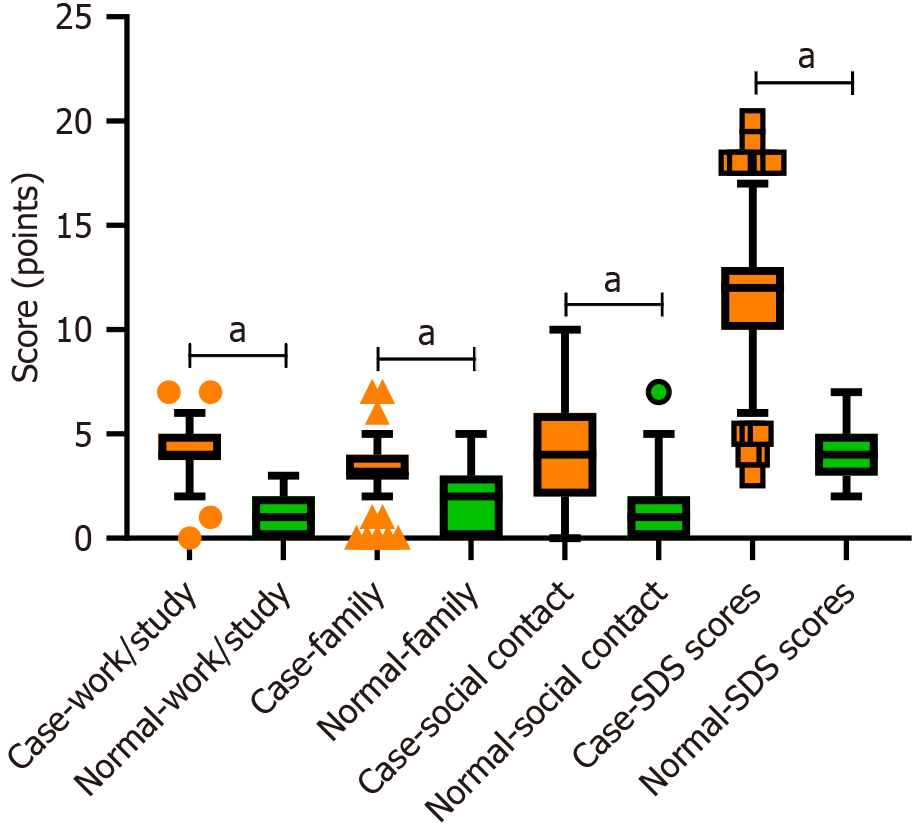
Figure 1 Sheehan Disability Scale scores of the two groups of subjects.
aP < 0.05. SDS: Sheehan Disability Scale.
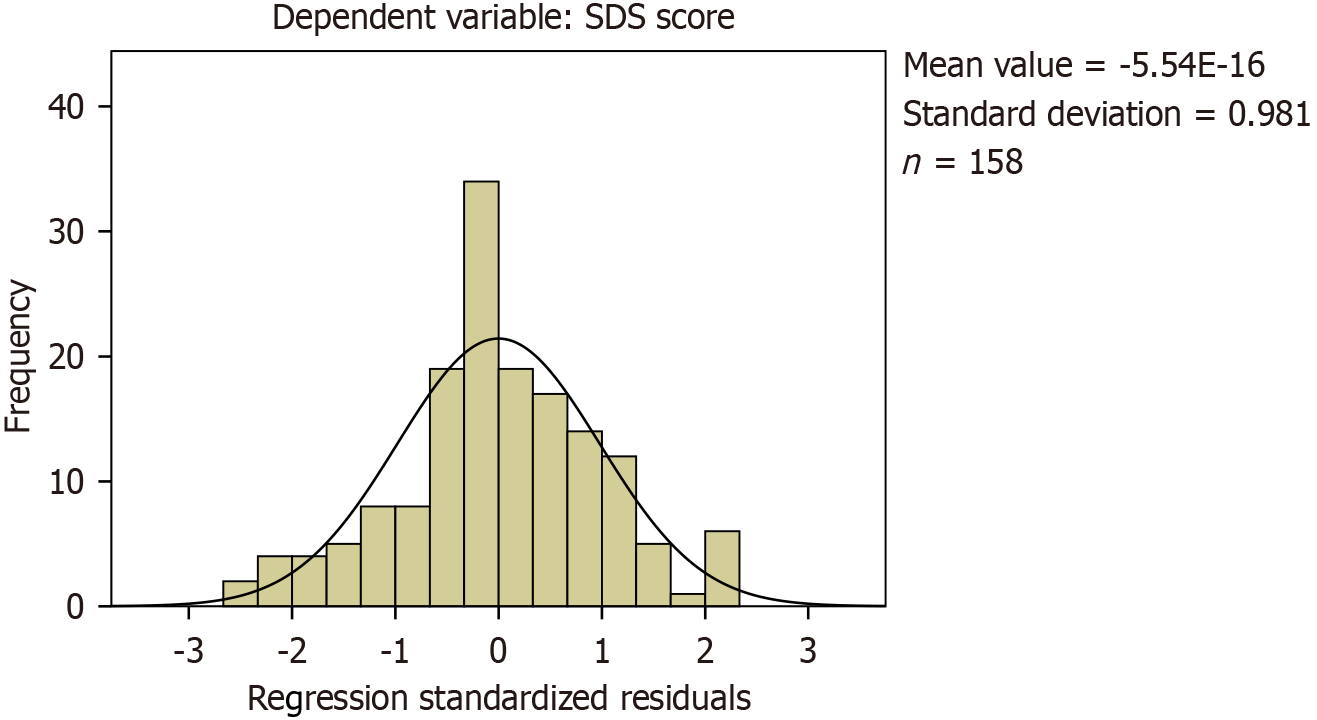
Figure 2 Multiple linear regression histogram of Sheehan Disability Scale scores of patients with residual depressive symptoms.
SDS: Sheehan Disability Scale.
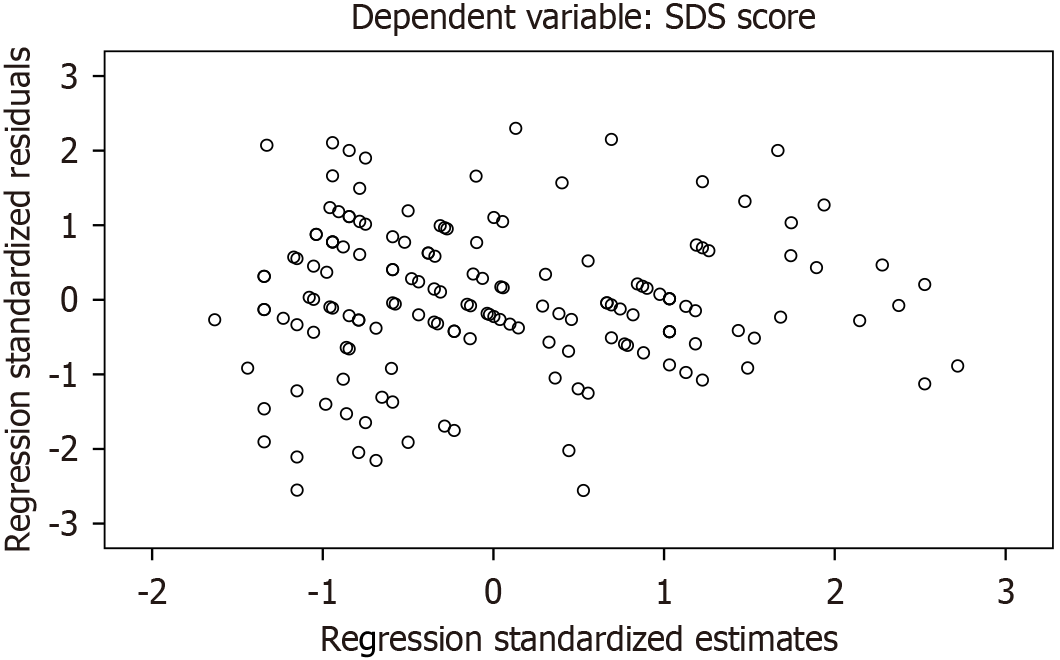
Figure 3 Multiple linear regression scatterplot of Sheehan Disability Scale scores of patients with residual depressive symptoms.
SDS: Sheehan Disability Scale.
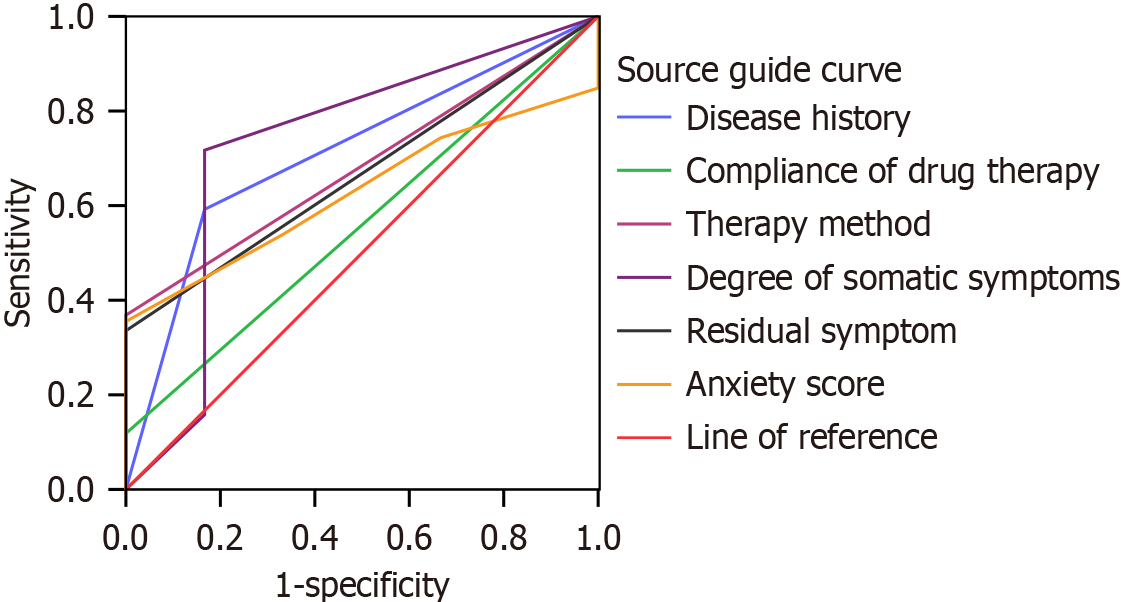
Figure 4
Receiver operating characteristic curve for predicting social function impairment in patients with residual depressive symptoms.
- Citation: Liao ZL, Pu XL, Zheng ZY, Luo J. Social function scores and influencing factors in patients with residual depressive symptoms. World J Psychiatry 2025; 15(1): 98630
- URL: https://www.wjgnet.com/2220-3206/full/v15/i1/98630.htm
- DOI: https://dx.doi.org/10.5498/wjp.v15.i1.98630


