Copyright
©The Author(s) 2024.
World J Psychiatry. Apr 19, 2024; 14(4): 563-581
Published online Apr 19, 2024. doi: 10.5498/wjp.v14.i4.563
Published online Apr 19, 2024. doi: 10.5498/wjp.v14.i4.563
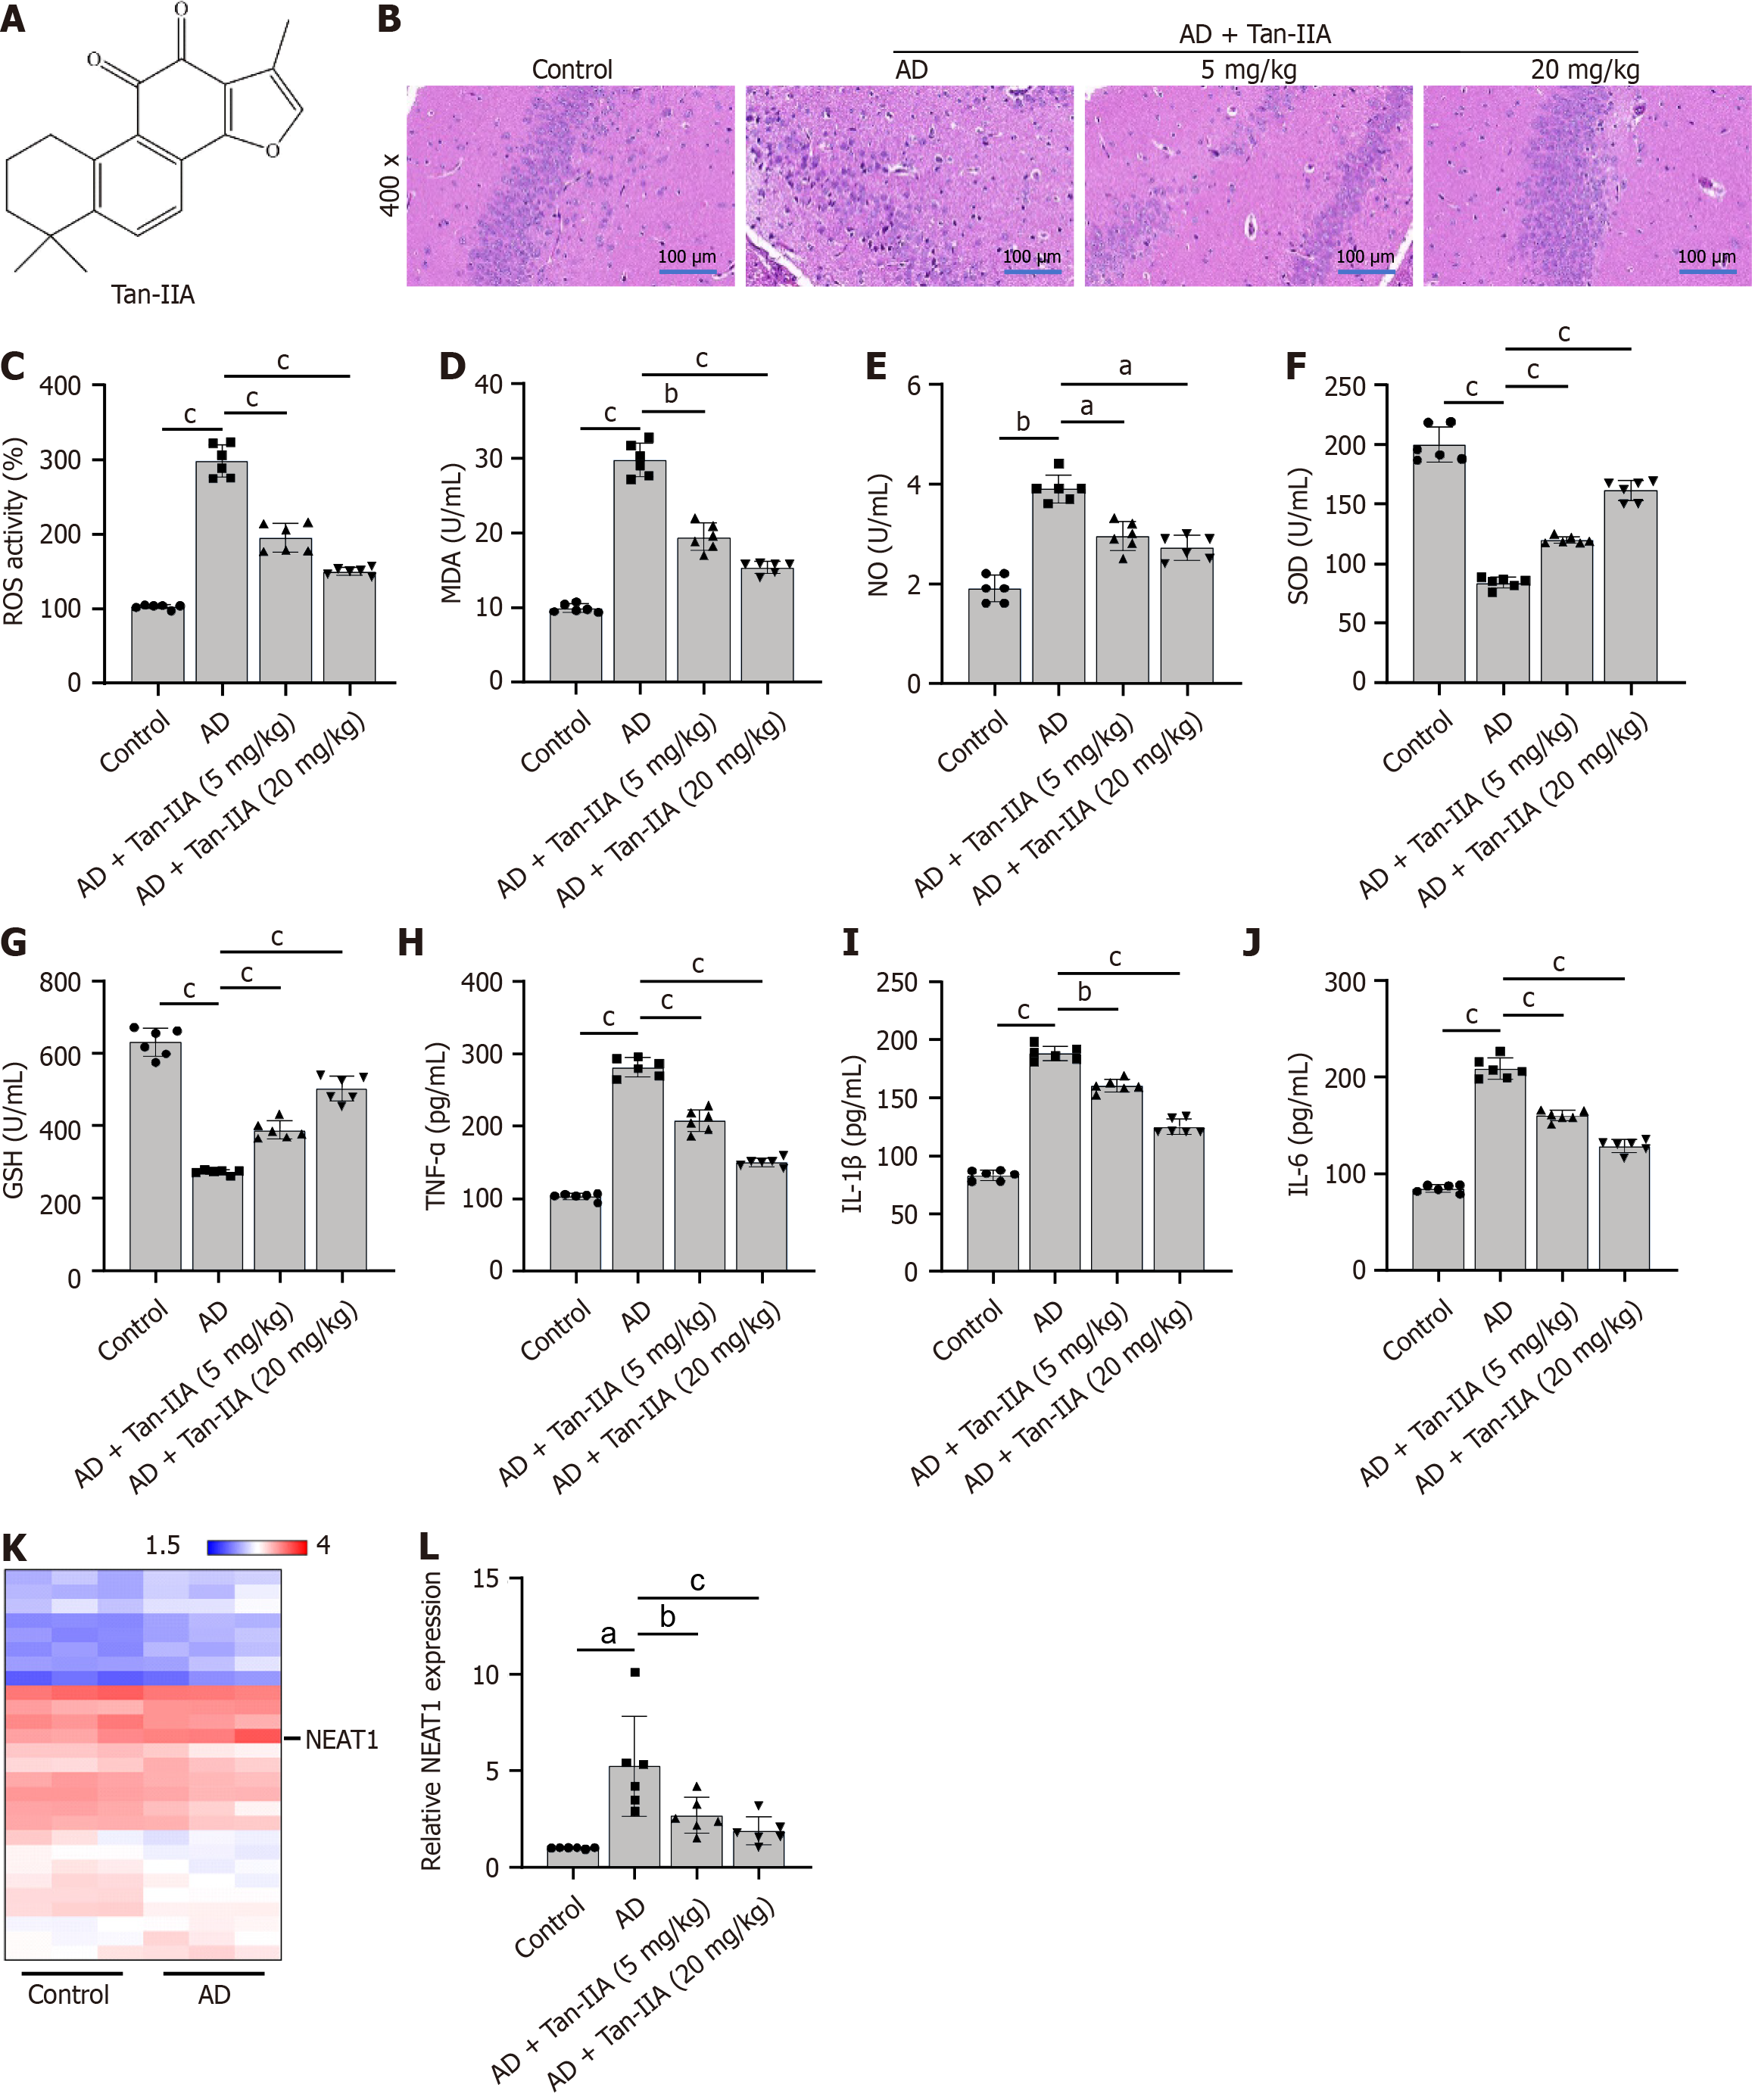
Figure 1 The impact of tanshinone IIA in a murine model of Alzheimer’s disease, with the long non-coding RNA nuclear-enriched abun
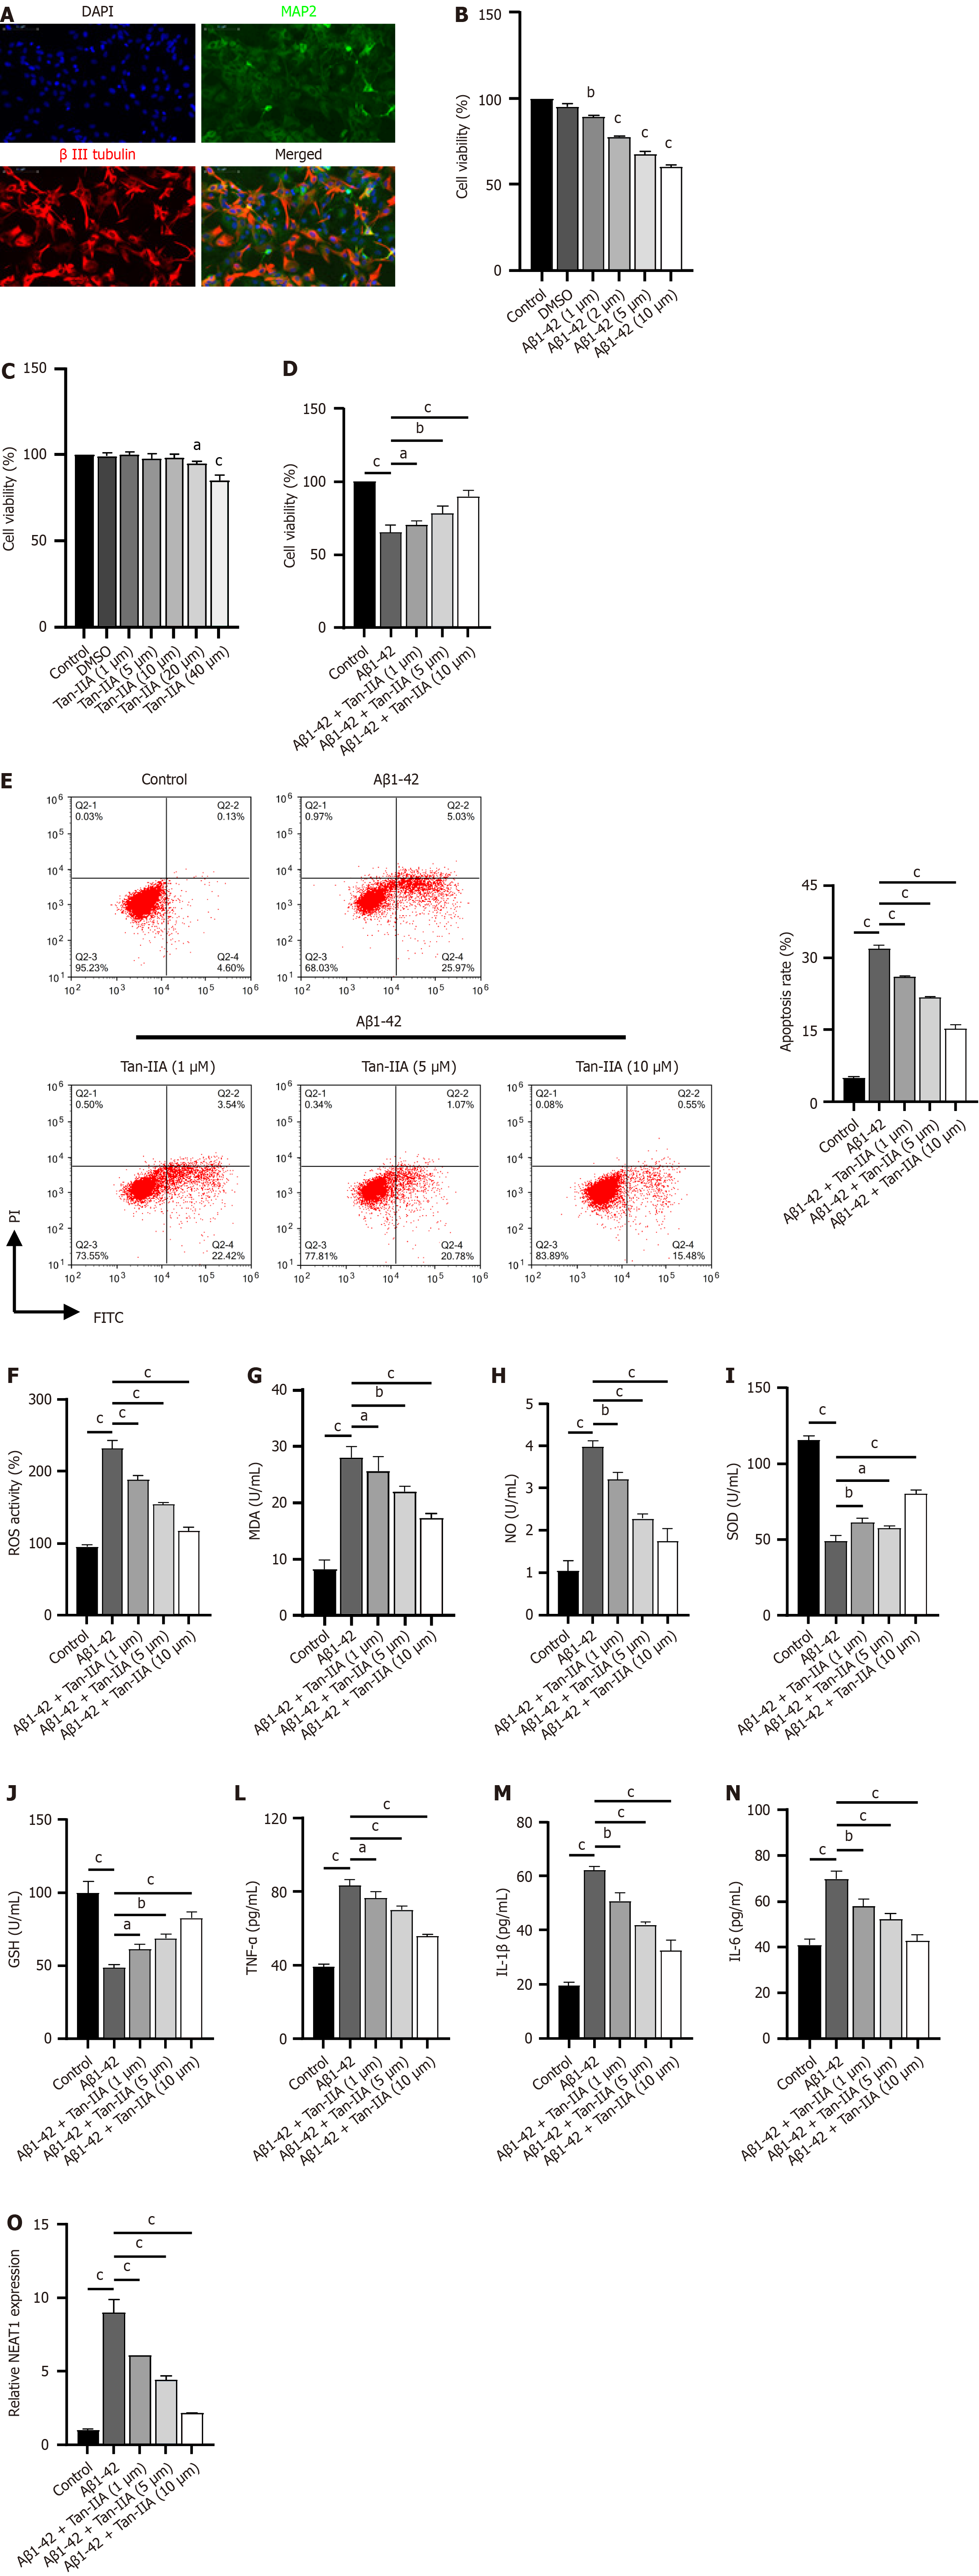
Figure 2 Protective effects of tanshinone IIA in murine neural stem cells induced with amyloid-beta 1-42 peptides.
A: Immunofluorescent identification of neural stem cells (NSCs) for isolation, using DAPI stain (blue), microtubule-associated protein 2 (green), and β III tubulin (red); B-D: 3-(4,5-dimethylthiazol-2-yl)-2,5-diphenyltetrazolium bromide assay of the effect of different amyloid-beta 1-42 (Aβ1-42) and tanshinone IIA (Tan-IIA) doses on NSC viability; E: Flow cytometry results indicating that different Tan-IIA doses improve the effect of Aβ1-42 on the apoptosis of NSCs; F: 2’,7’-dichlorofluorescin diacetate analysis of the reactive oxygen species ratio in NSCs, either with or without prior Tan-IIA treatment; G-N: Enzyme-linked immunosorbent assay results of different Tan-IIA doses in enhancing the effect of Aβ1-42 in improving levels of oxidative stress factors (malondialdehyde; nitric oxide; superoxide dismutase; glutathione) and neuroinflammation markers (tumor necrosis factor-alpha; interleukin 1β; interleukin 6) in NSCs; O: Reverse transcription quantitative polymerase chain reaction analysis of different Tan-IIA doses used to improve the effect of Aβ1-42 on nuclear-enriched abundant transcript 1 expression in NSCs. aP < 0.05, bP < 0.01, cP < 0.001. MAP2: Microtubule-associated protein 2; DMSO: Dimethyl sulfoxide; PI: Propidium iodide; FITC: Fluorescein isothiocyanate; Aβ1-42: Amyloid-beta 1-42; Tan-IIA: Tanshinone IIA; ROS: Reactive oxygen species; MDA: Malondialdehyde; NO: Nitric oxide; SOD: Superoxide dismutase; GSH: Glutathione; TNF-α: Tumor necrosis factor-alpha; IL-1β: Interleukin 1β; IL-6: Interleukin 6; NEAT1: Nuclear-enriched abundant transcript 1.
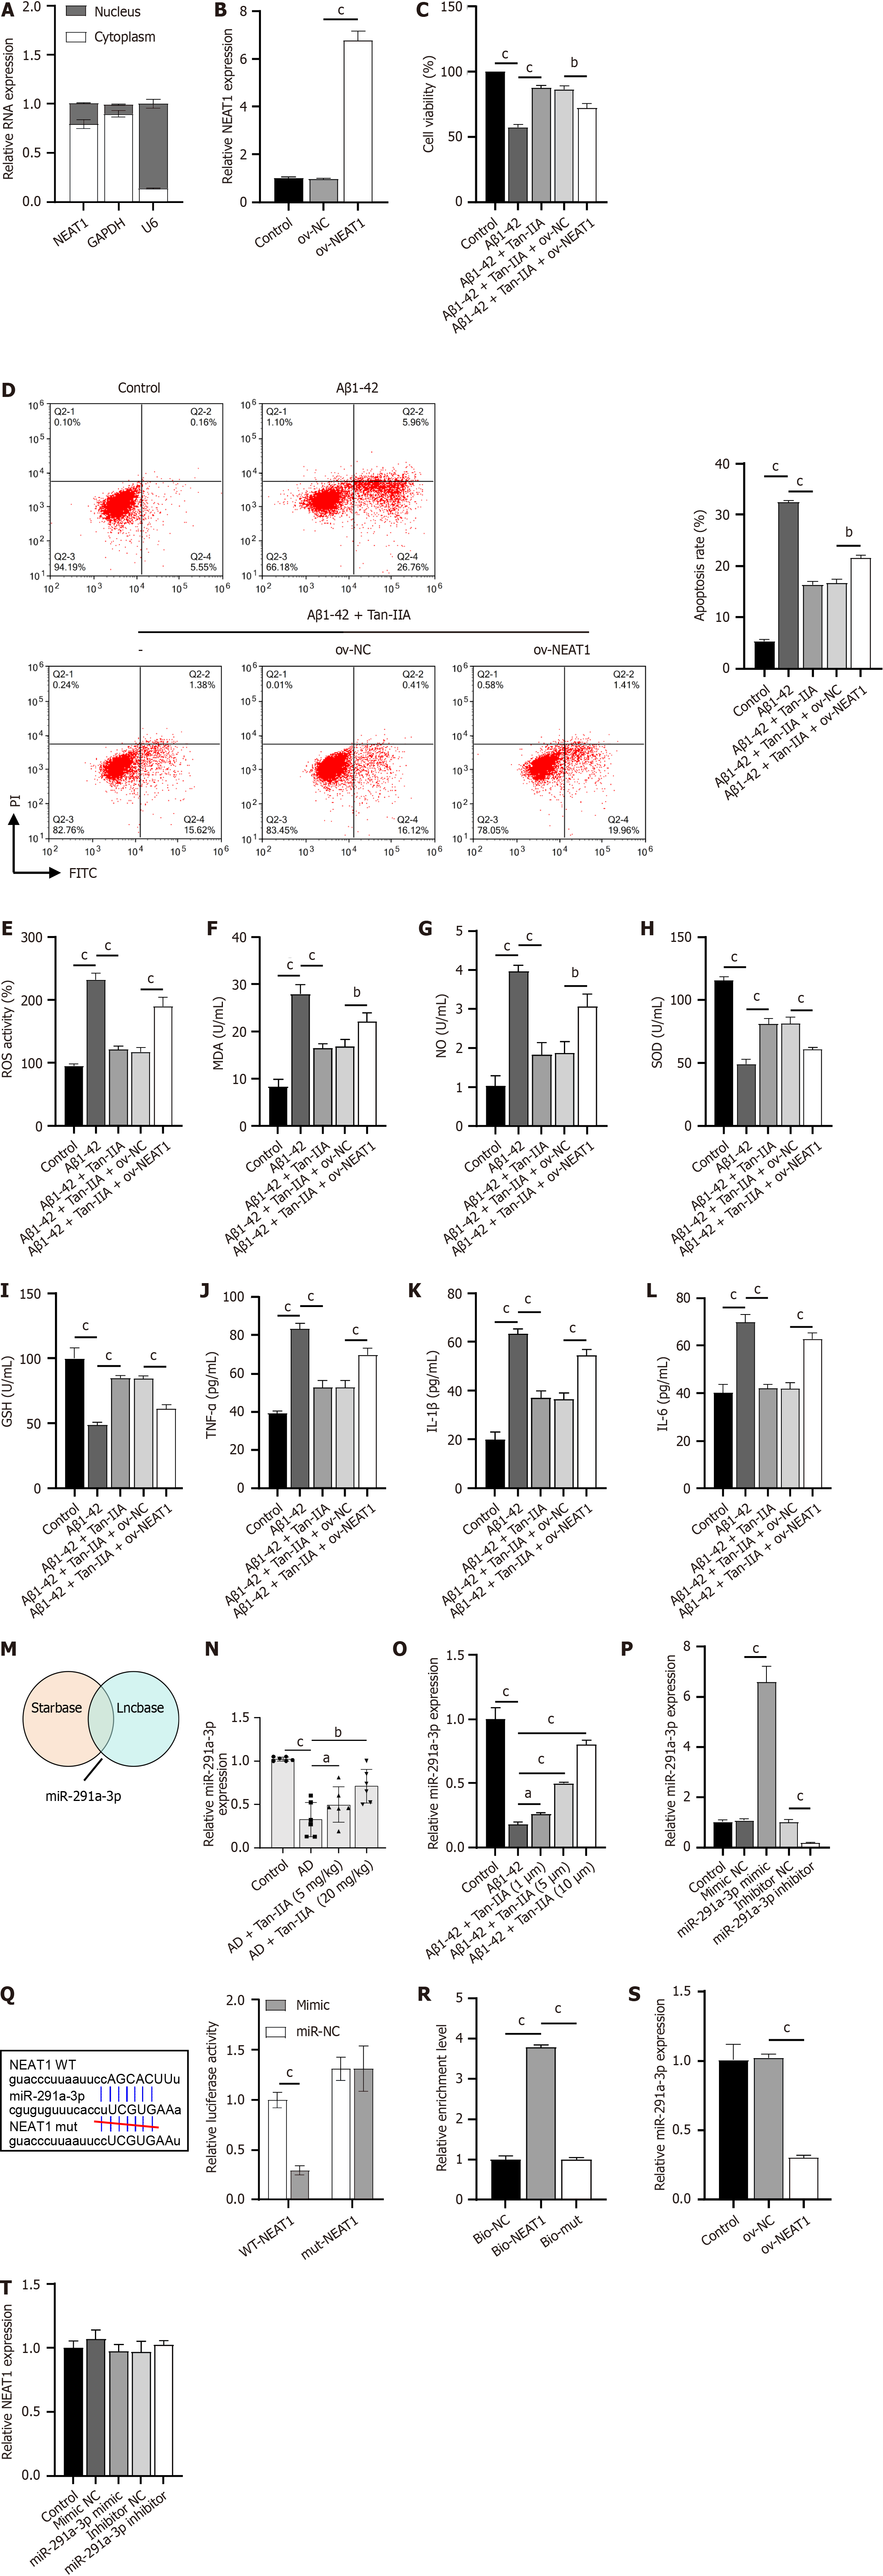
Figure 3 Localization of the long non-coding RNA nuclear-enriched abundant transcript 1 in the cytoplasm, and its interaction with the microRNA miR-291a-3p.
A: Nucleocytoplasmic separation was performed to detect the localization of the long non-coding RNA nuclear-enriched abundant transcript 1 (NEAT1) in neural stem cells (NSCs); B: Reverse transcription quantitative polymerase chain reaction validation of the NEAT1 overexpression vector; C: 3-(4,5-dimethylthiazol-2-yl)-2,5-diphenyltetrazolium bromide results of the effect of NEAT1 overexpression on the cell viability of amyloid-beta 1-42 (Aβ1-42)-induced NSCs that received tanshinone IIA (Tan-IIA) pretreatment; D: Flow cytometry results of the effect of NEAT1 overexpression on the apoptosis of Aβ1-42-induced NSCs that received Tan-IIA pretreatment; E: 2’,7’-dichlorofluorescin diacetate analysis of the effect of NEAT1 overexpression on the reactive oxygen species ratio of Aβ1-42-induced NSCs that received Tan-IIA pretreatment; F–L: Enzyme-linked immunosorbent assay results for the effect of NEAT1 overexpression on oxidative stress factors (malondialdehyde; nitric oxide; superoxide dismutase; glutathione) and neuroinflammation markers (tumor necrosis factor-alpha; interleukin 1β; interleukin 6) in Aβ1-42-induced NSCs that received Tan-IIA pretreatment; M: Starbase and Lncbase analysis, confirming miR-291a-3p as a potential target of NEAT1; N and O: Reverse transcription quantitative polymerase chain reaction (RT-qPCR) analysis of miR-291a-3p expression in the Alzheimer’s disease mouse model and Aβ1-42-induced NSCs; P: RT-qPCR analysis of the expression of synthesized miR-291a-3p mimic/inhibitor; Q: Dual-luciferase assay confirming binding between NEAT1 and miR-291a-3p; R: RNA pull-down assay showing miR-291a-3p enrichment in bio-NEAT1; S and T: RT-qPCR analysis of the expression levels of miR-291a-3p (S) and NEAT1 (T) in NSCs. aP < 0.05, bP < 0.01, cP < 0.001. PI: Propidium iodide; FITC: Fluorescein isothiocyanate; Aβ1-42: Amyloid-beta 1-42; Tan-IIA: Tanshinone IIA; ROS: Reactive oxygen species; MDA: Malondialdehyde; NO: Nitric oxide; SOD: Superoxide dismutase; GSH: Glutathione; TNF-α: Tumor necrosis factor-alpha; IL-1β: Interleukin 1β; IL-6: Interleukin 6; NEAT1: Nuclear-enriched abundant transcript 1.
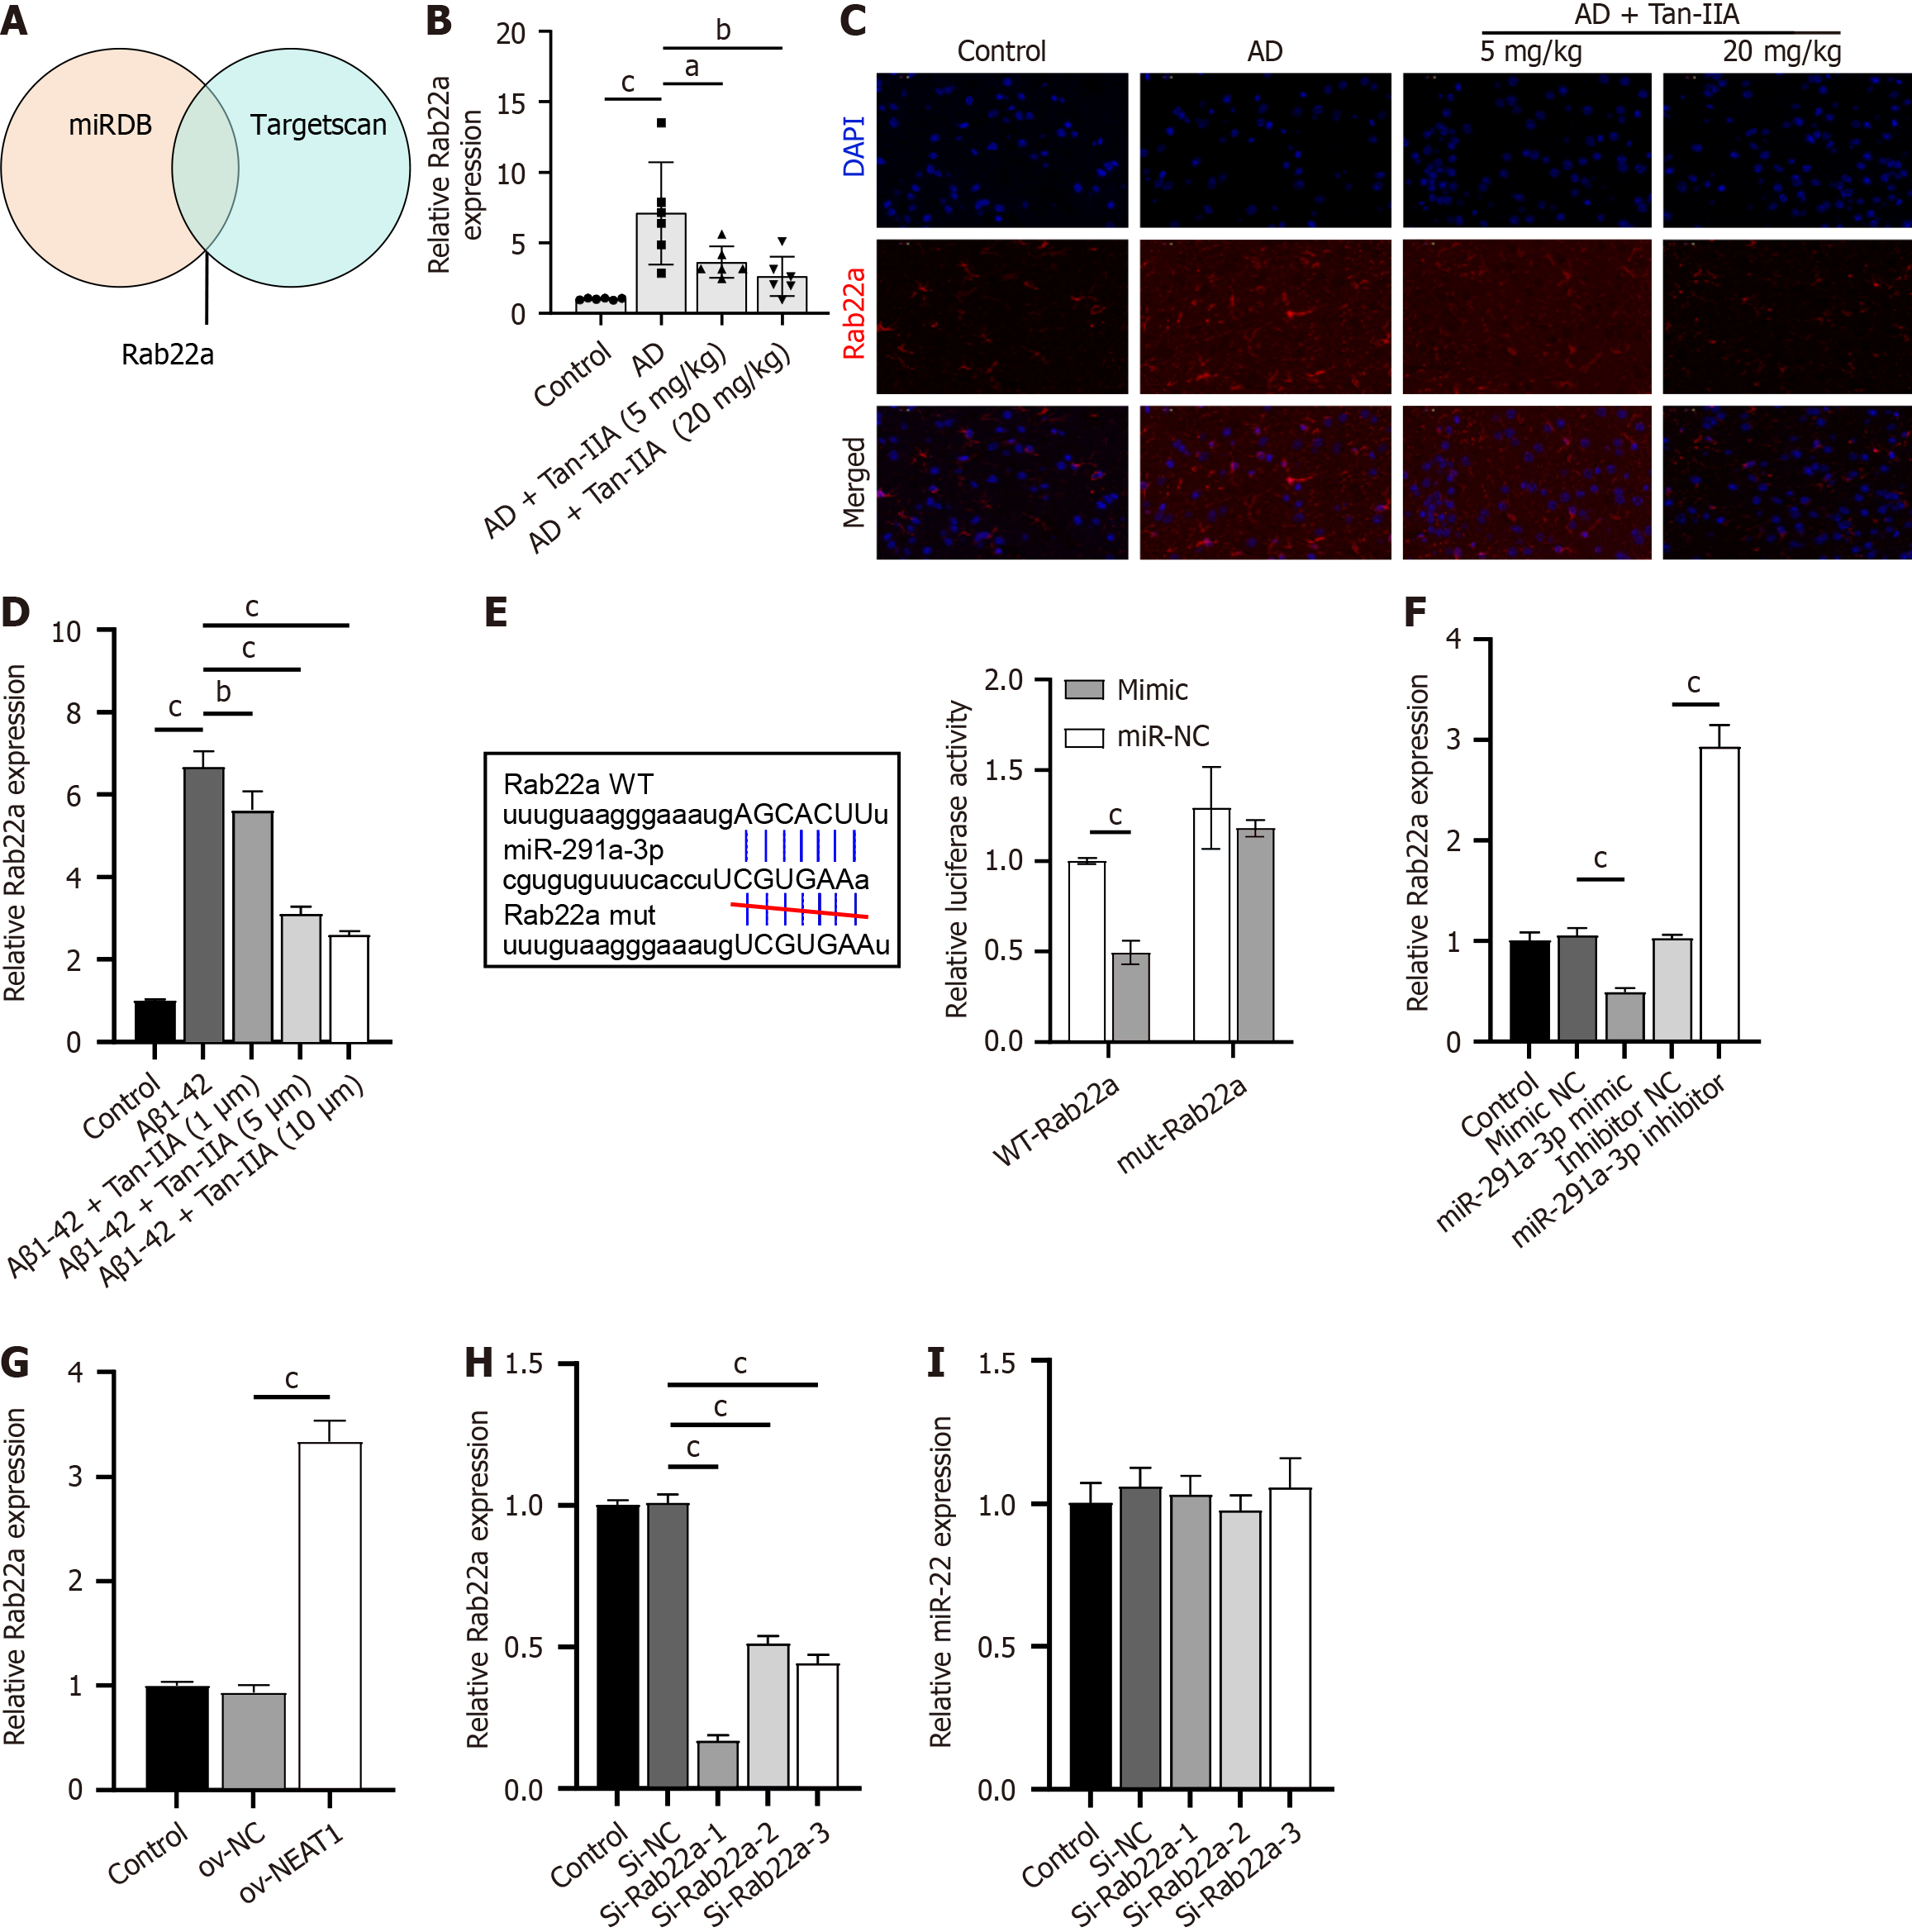
Figure 4 Rab22a as a target of miR-291a-3p, and its role in the nuclear-enriched abundant transcript 1/miR-291a-3p axis.
A: MiRDB and Targetscan database joint analysis identified Rab22a as a potential target of miR-291a-3p; B: Reverse transcription quantitative polymerase chain reaction (RT-qPCR) analysis of Rab22a expression in the Alzheimer’s disease (AD) mouse model; C: Immunofluorescence analysis of Rab22a expression in the AD mouse model; D: RT-qPCR analysis of Rab22a expression in amyloid-beta 1-42 (Aβ1-42)-induced neural stem cells (NSCs); E: Dual-luciferase assay confirming binding between Rab22a and miR-291a-3p; F and G: RT-qPCR analysis of the effect of miR-291a-3p (F) and nuclear-enriched abundant transcript 1 (G) overexpression on Rab22a expression; H: RT-qPCR validation of the inhibitory efficiency of 3 si-Rab22a on Rab22a expression in NSCs; I: RT-qPCR analysis of the effect of 3 si-Rab22a on miR-291a-3p expression. aP < 0.05, bP < 0.01, cP < 0.001. AD: Alzheimer’s disease; Aβ1-42: Amyloid-beta 1-42; Tan-IIA: Tanshinone IIA.
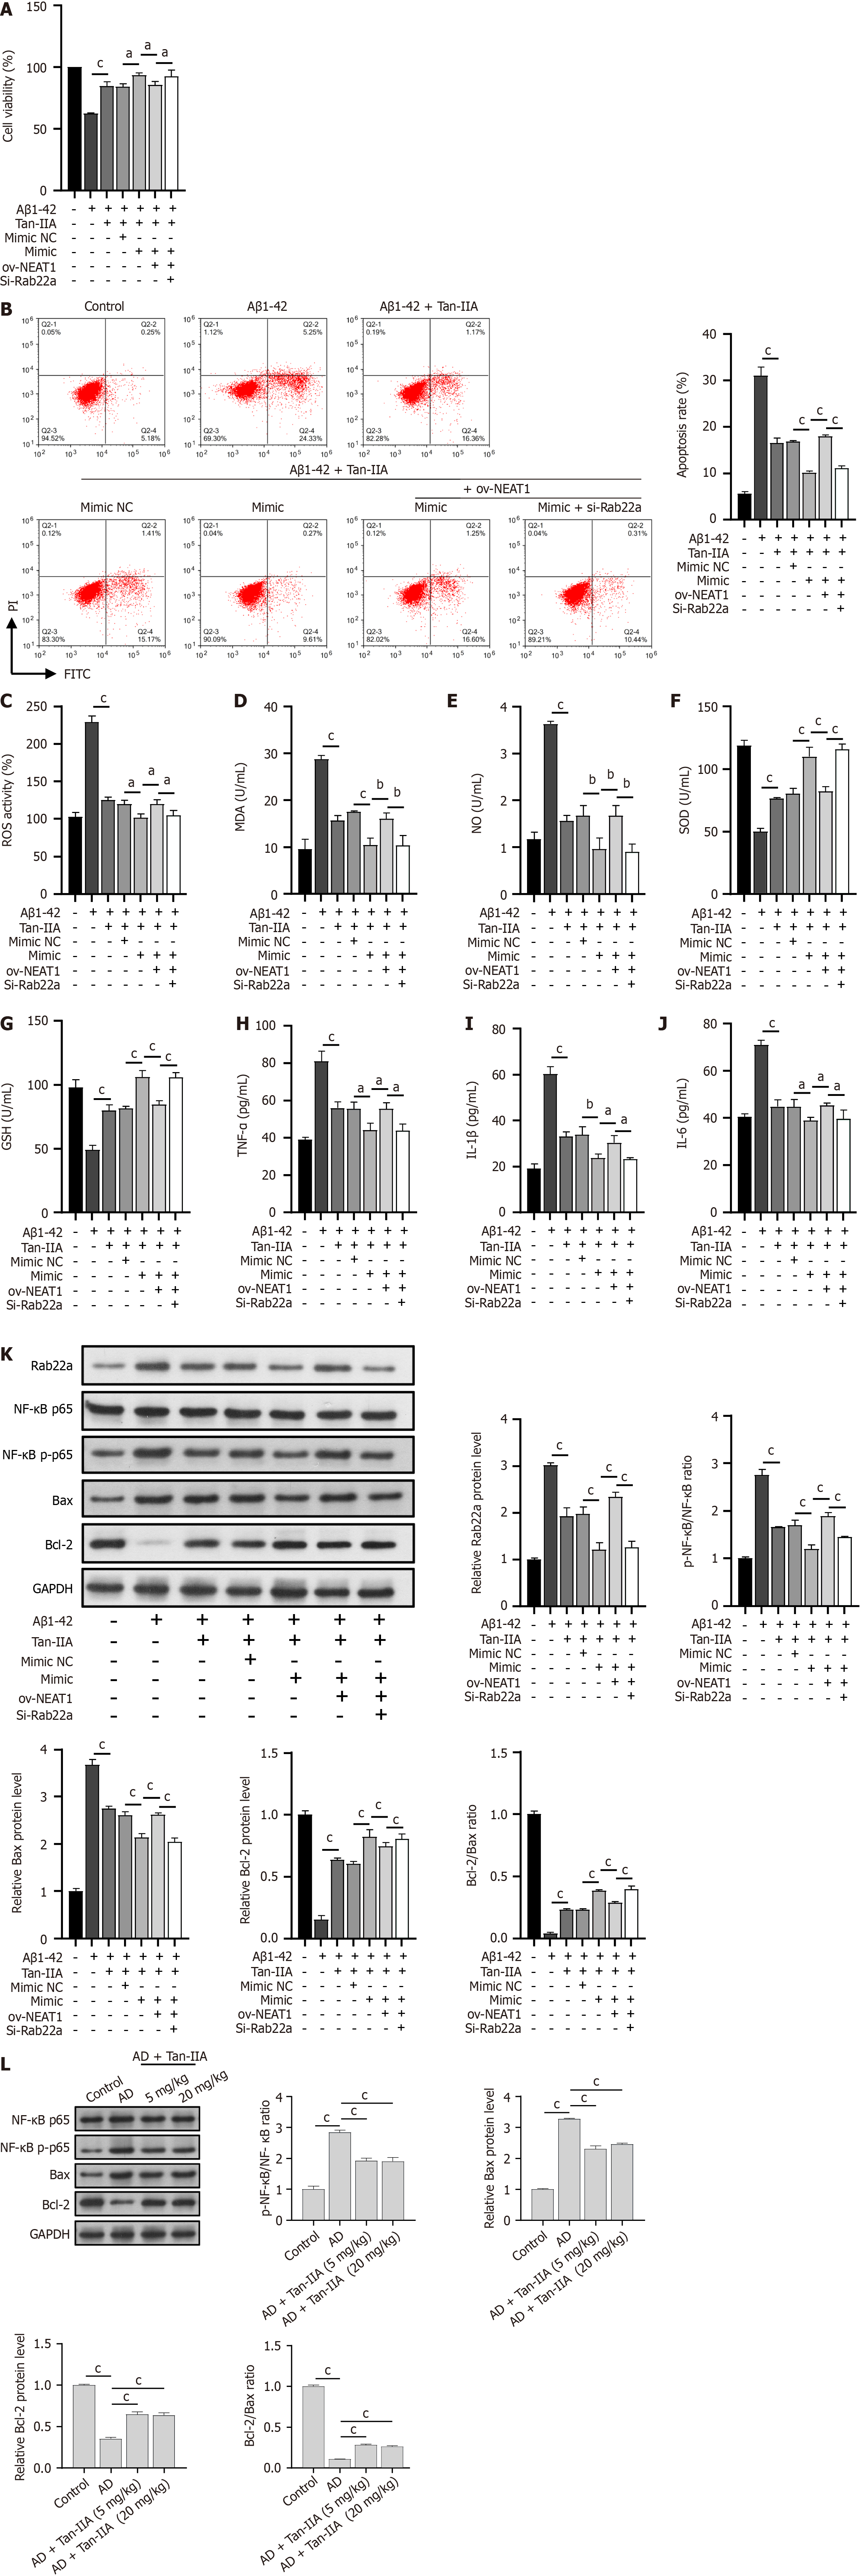
Figure 5 Neuroprotective effects of tanshinone IIA as mediated through the nuclear-enriched abundant transcript 1/miR-291a-3p/Rab22a axis.
A: 3-(4,5-dimethylthiazol-2-yl)-2,5-diphenyltetrazolium bromide analysis of the role of nuclear-enriched abundant transcript 1 (NEAT1)/miR-291a-3p/Rab22a axis in the improvement of cell viability in amyloid-beta 1-42 (Aβ1-42)-induced neural stem cells (NSCs) following tanshinone IIA (Tan-IIA) treatment; B: Flow cytometry analysis of the role of the NEAT1/miR-291a-3p/Rab22a axis in Tan-IIA ameliorating Aβ1-42-induced apoptosis in NSCs; C: 2’,7’-dichlorofluorescin diacetate analysis of the role of the NEAT1/miR-291a-3p/Rab22a axis in Tan-IIA ameliorating Aβ1-42-induced reactive oxygen species levels in NSCs; D-J: Enzyme-linked immunosorbent assay analysis of the role of NEAT1/miR-291a-3p/Rab22a axis in Tan-IIA to ameliorate oxidative stress factors (malondialdehyde; nitric oxide; superoxide dismutase; and glutathione) and neuroinflammation (tumor necrosis factor-alpha; interleukin 1β; and interleukin 6) in Aβ1-42-induced NSCs; K: Western blots indicating the role of the NEAT1/miR-291a-3p/Rab22a axis in the mechanism of Tan-IIA improving the role of Rab22a, p65, p-p65, Bax, and Bcl-2 protein levels in NSCs induced by Aβ1-42; L: Western blots showing the effect of Tan-IIA treatment on the protein levels of p65, p-p65, B-cell lymphoma 2-associated X protein, and B-cell lymphoma 2 in AD mice. aP < 0.05, bP < 0.01, cP < 0.001. PI: Propidium iodide; FITC: Fluorescein isothiocyanate; Aβ1-42: Amyloid-beta 1-42; Tan-IIA: Tanshinone IIA; ROS: Reactive oxygen species; MDA: Malondialdehyde; NO: Nitric oxide; SOD: Superoxide dismutase; GSH: Glutathione; TNF-α: Tumor necrosis factor-alpha; IL-1β: Interleukin 1β; IL-6: Interleukin 6; NEAT1: Nuclear-enriched abundant transcript 1; NF-κB: Nuclear factor kappa-B; Bcl-2: B-cell lymphoma 2; Bax: B-cell lymphoma 2-associated X protein; AD: Alzheimer’s disease.
- Citation: Yang LX, Luo M, Li SY. Tanshinone IIA improves Alzheimer’s disease via RNA nuclear-enriched abundant transcript 1/microRNA-291a-3p/member RAS oncogene family Rab22a axis. World J Psychiatry 2024; 14(4): 563-581
- URL: https://www.wjgnet.com/2220-3206/full/v14/i4/563.htm
- DOI: https://dx.doi.org/10.5498/wjp.v14.i4.563


