Copyright
©The Author(s) 2024.
World J Psychiatry. Oct 19, 2024; 14(10): 1583-1591
Published online Oct 19, 2024. doi: 10.5498/wjp.v14.i10.1583
Published online Oct 19, 2024. doi: 10.5498/wjp.v14.i10.1583
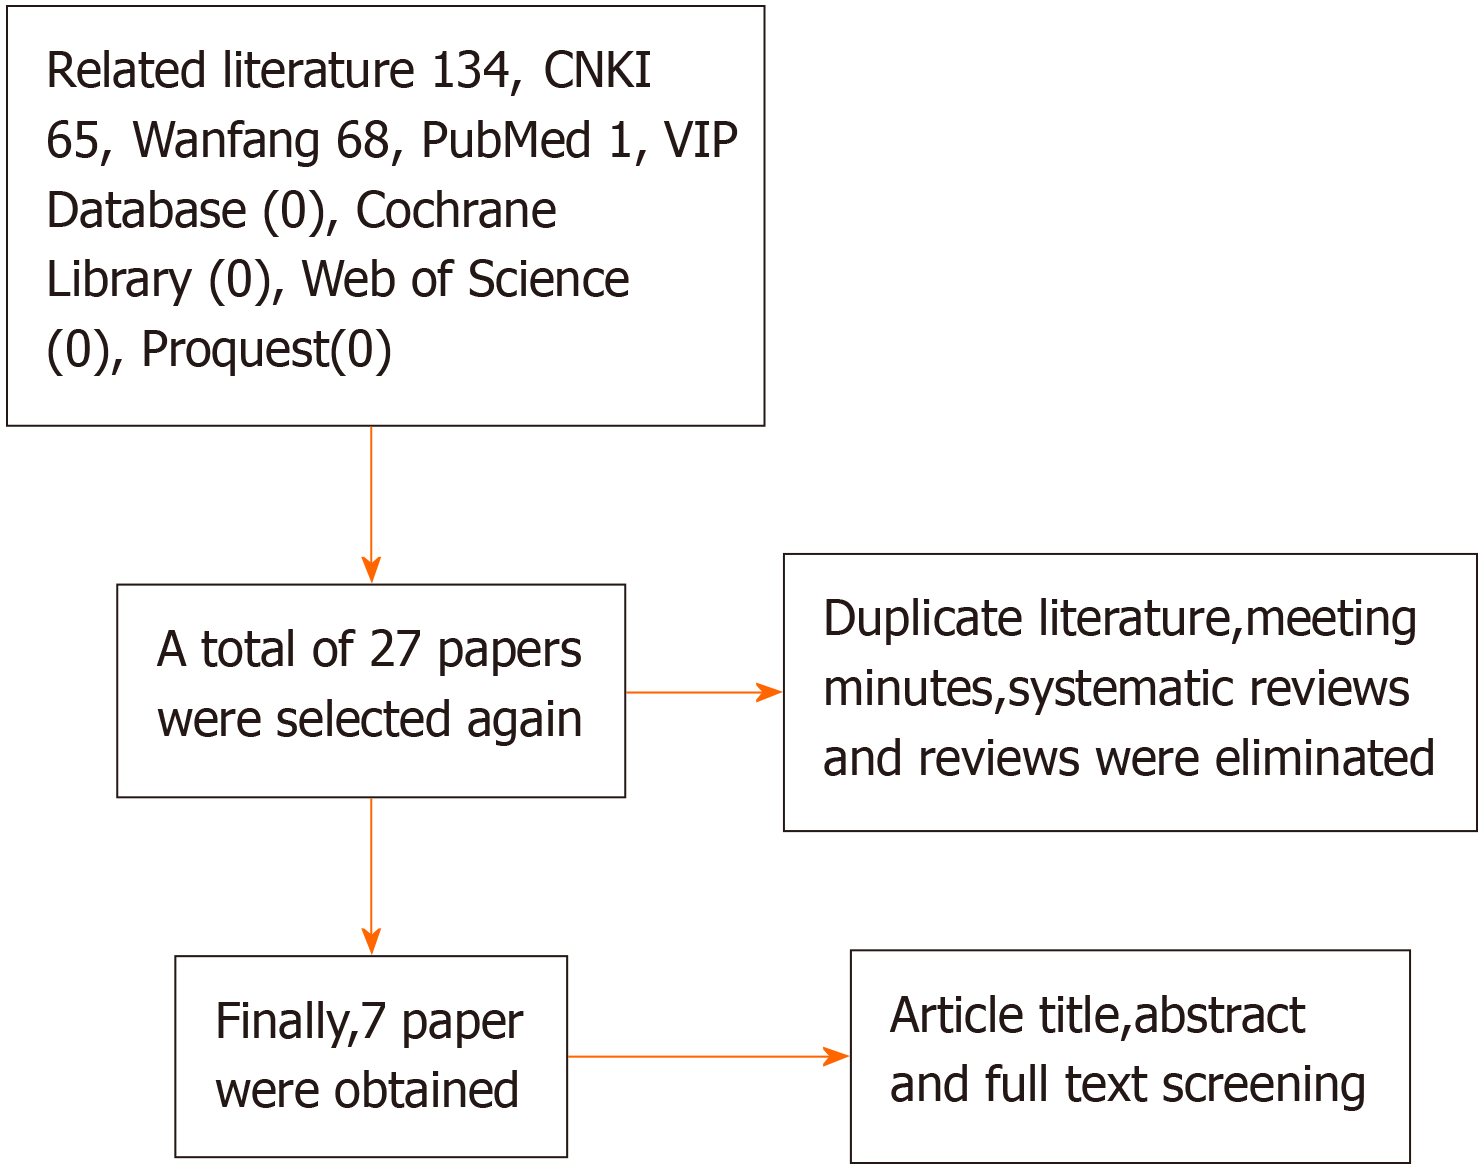
Figure 1 Document retrieval flow chart 1.
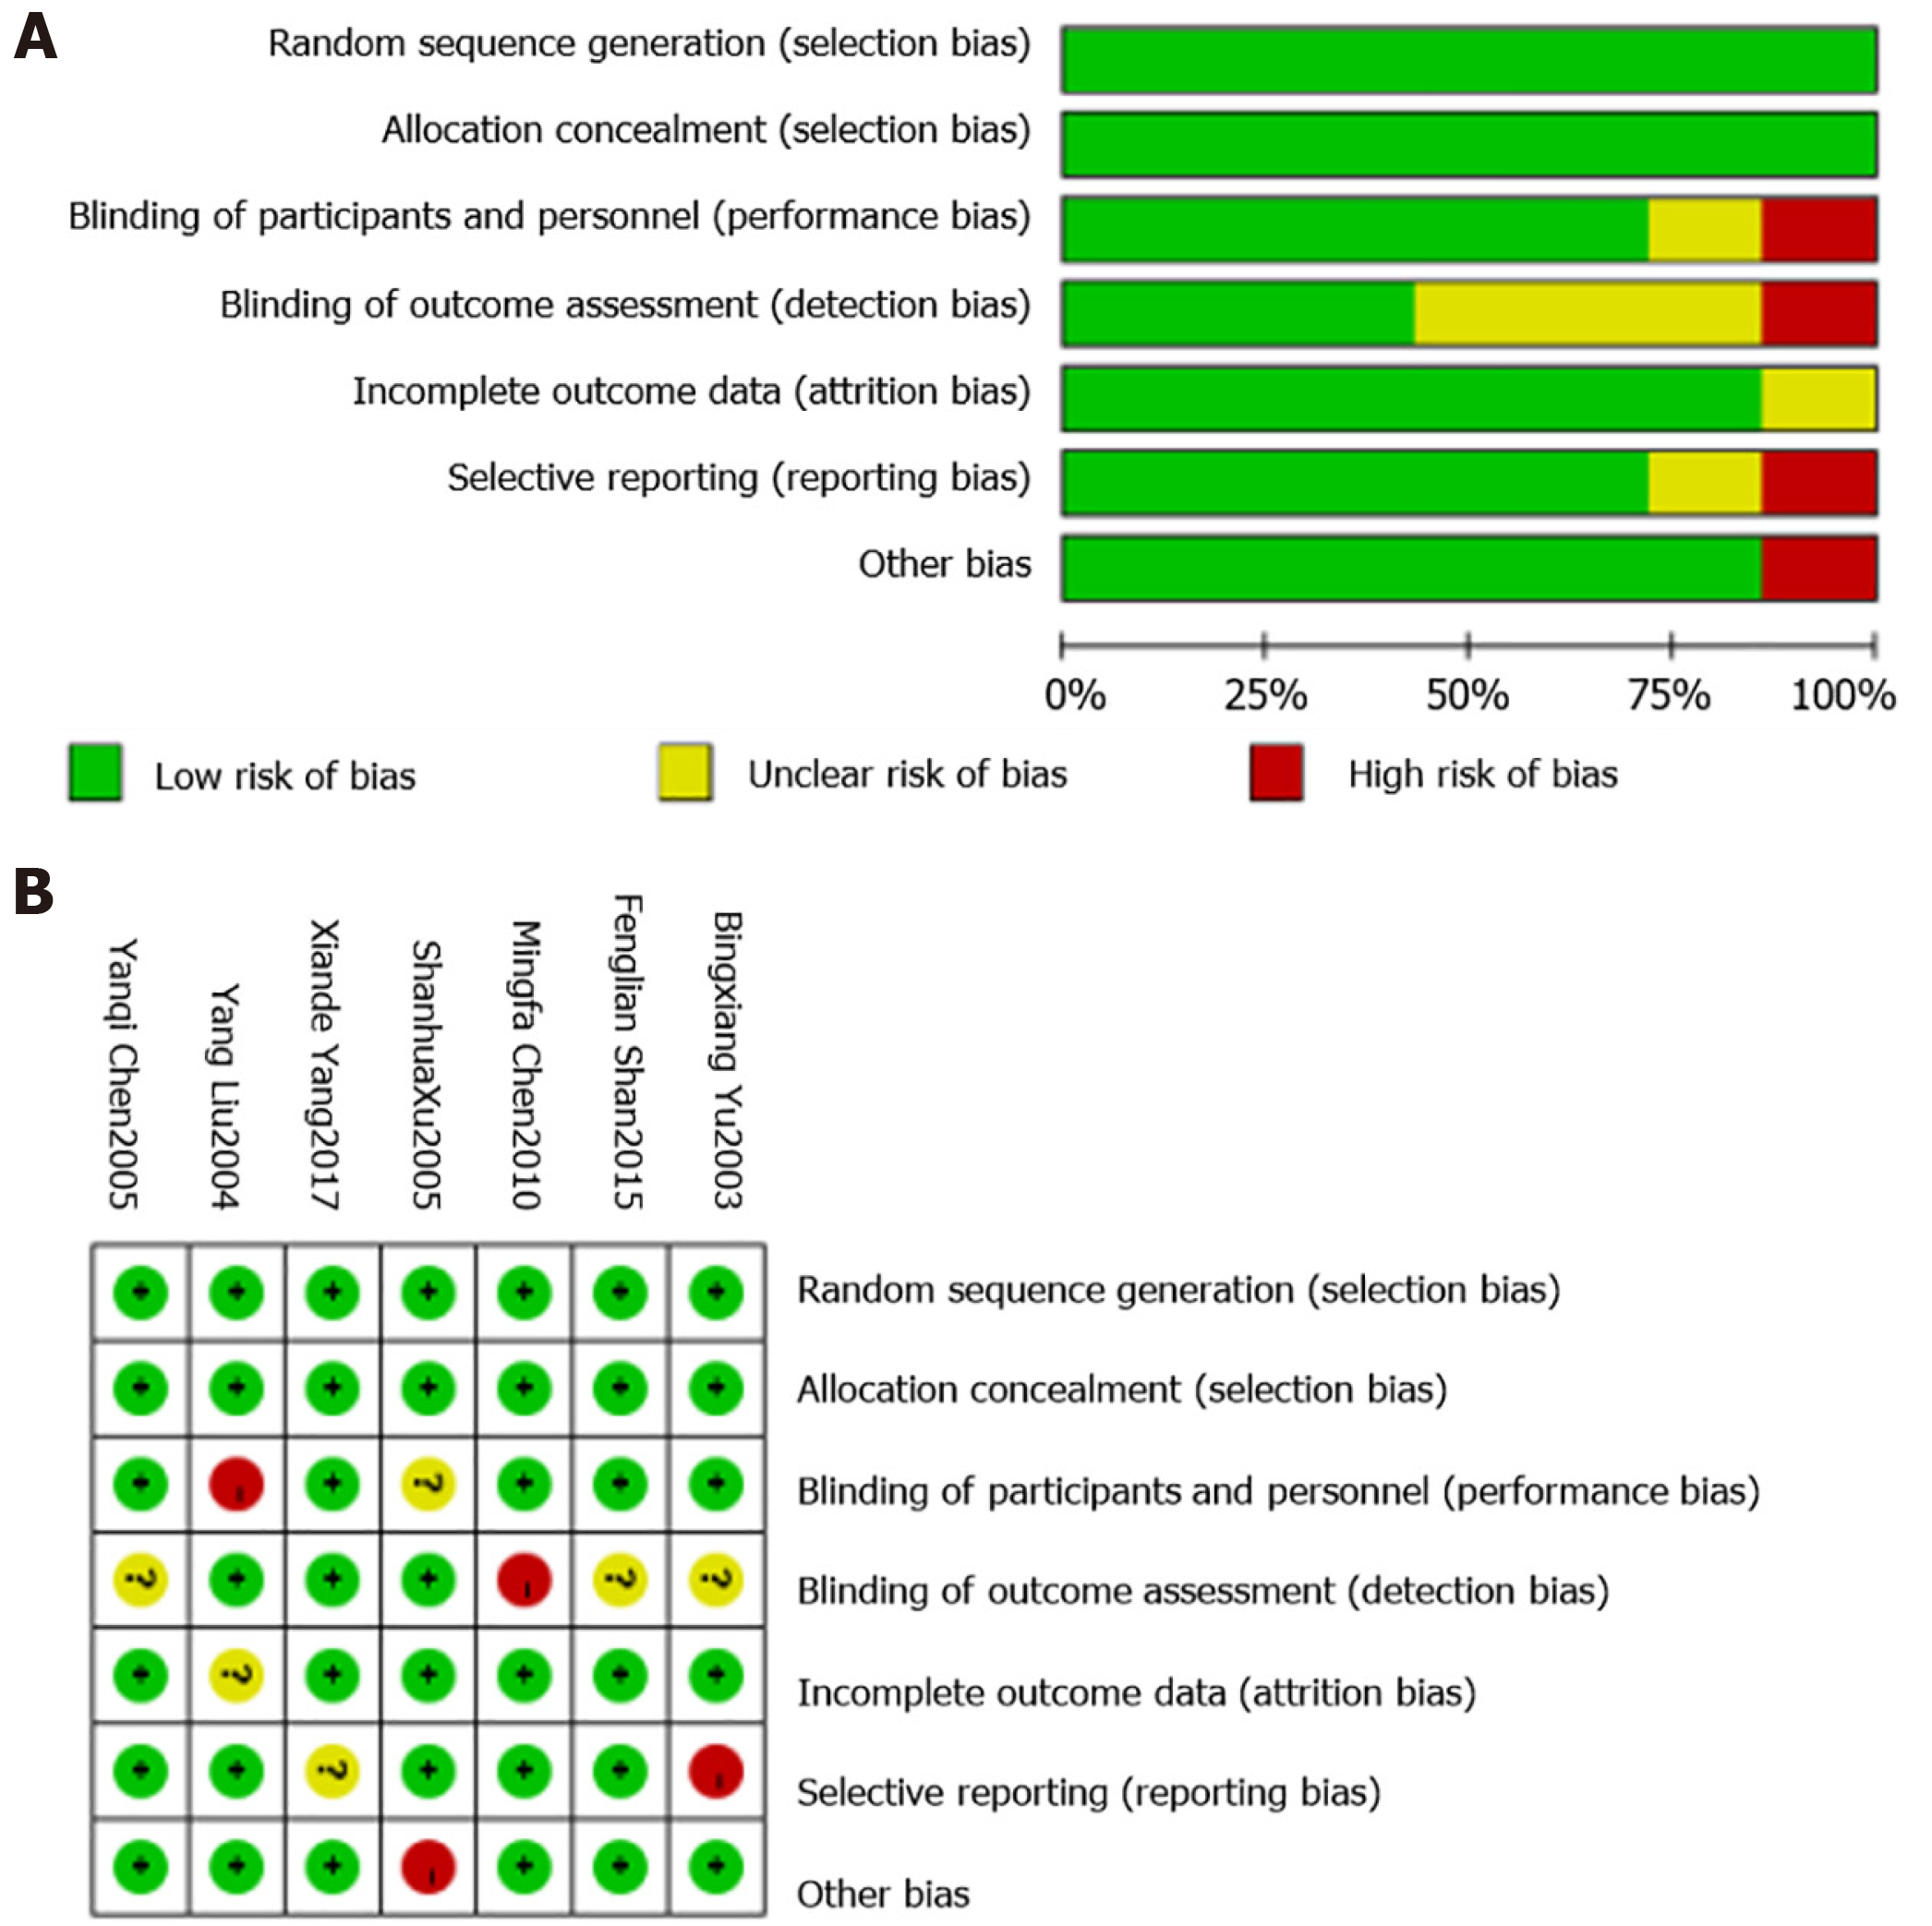
Figure 2 Offset risk proportion diagram.
A: Literature quality evaluation bar chart; B: Risk offset entries and applicability summary graphs.
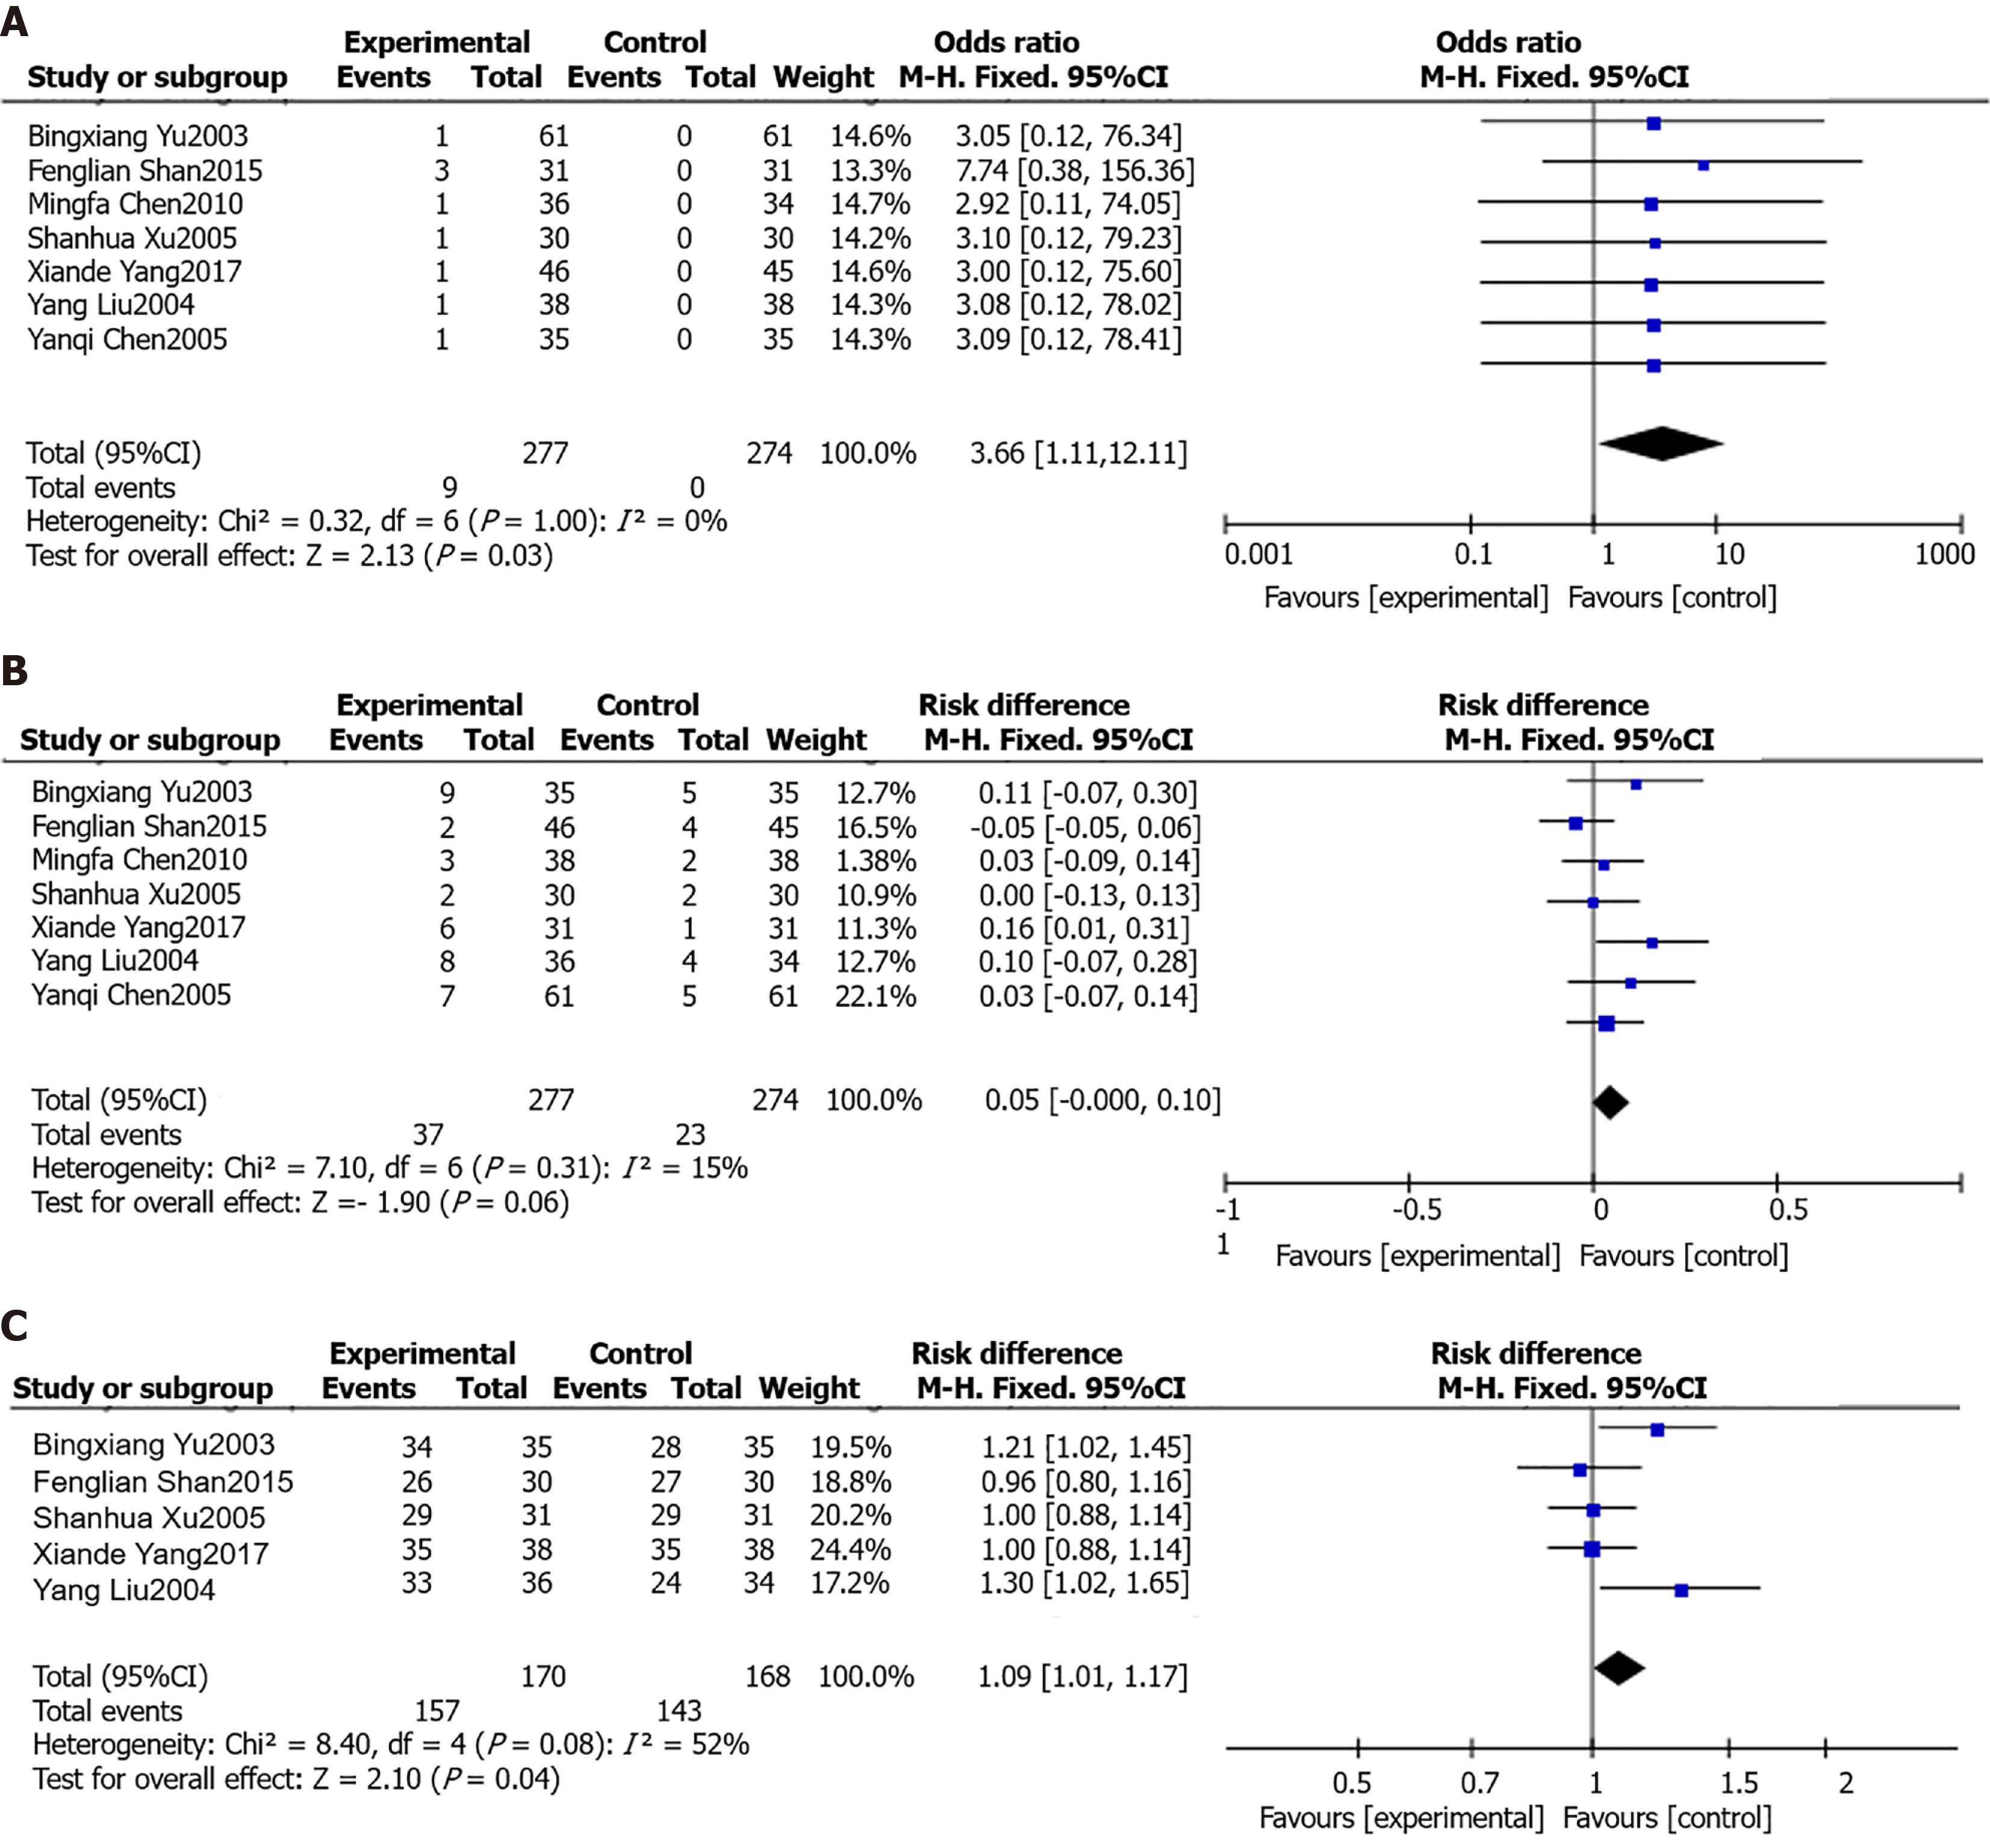
Figure 3 After treatment, mental disorders occurred, adverse reactions, and effective rates in both groups.
A: After treatment, mental disorders occurred in both groups (P < 0.05); B: After treatment, there were adverse reactions in the two groups (P > 0.05); C: After treatment, the effective rates of the two groups (P < 0.05). CI: Confidence interval.
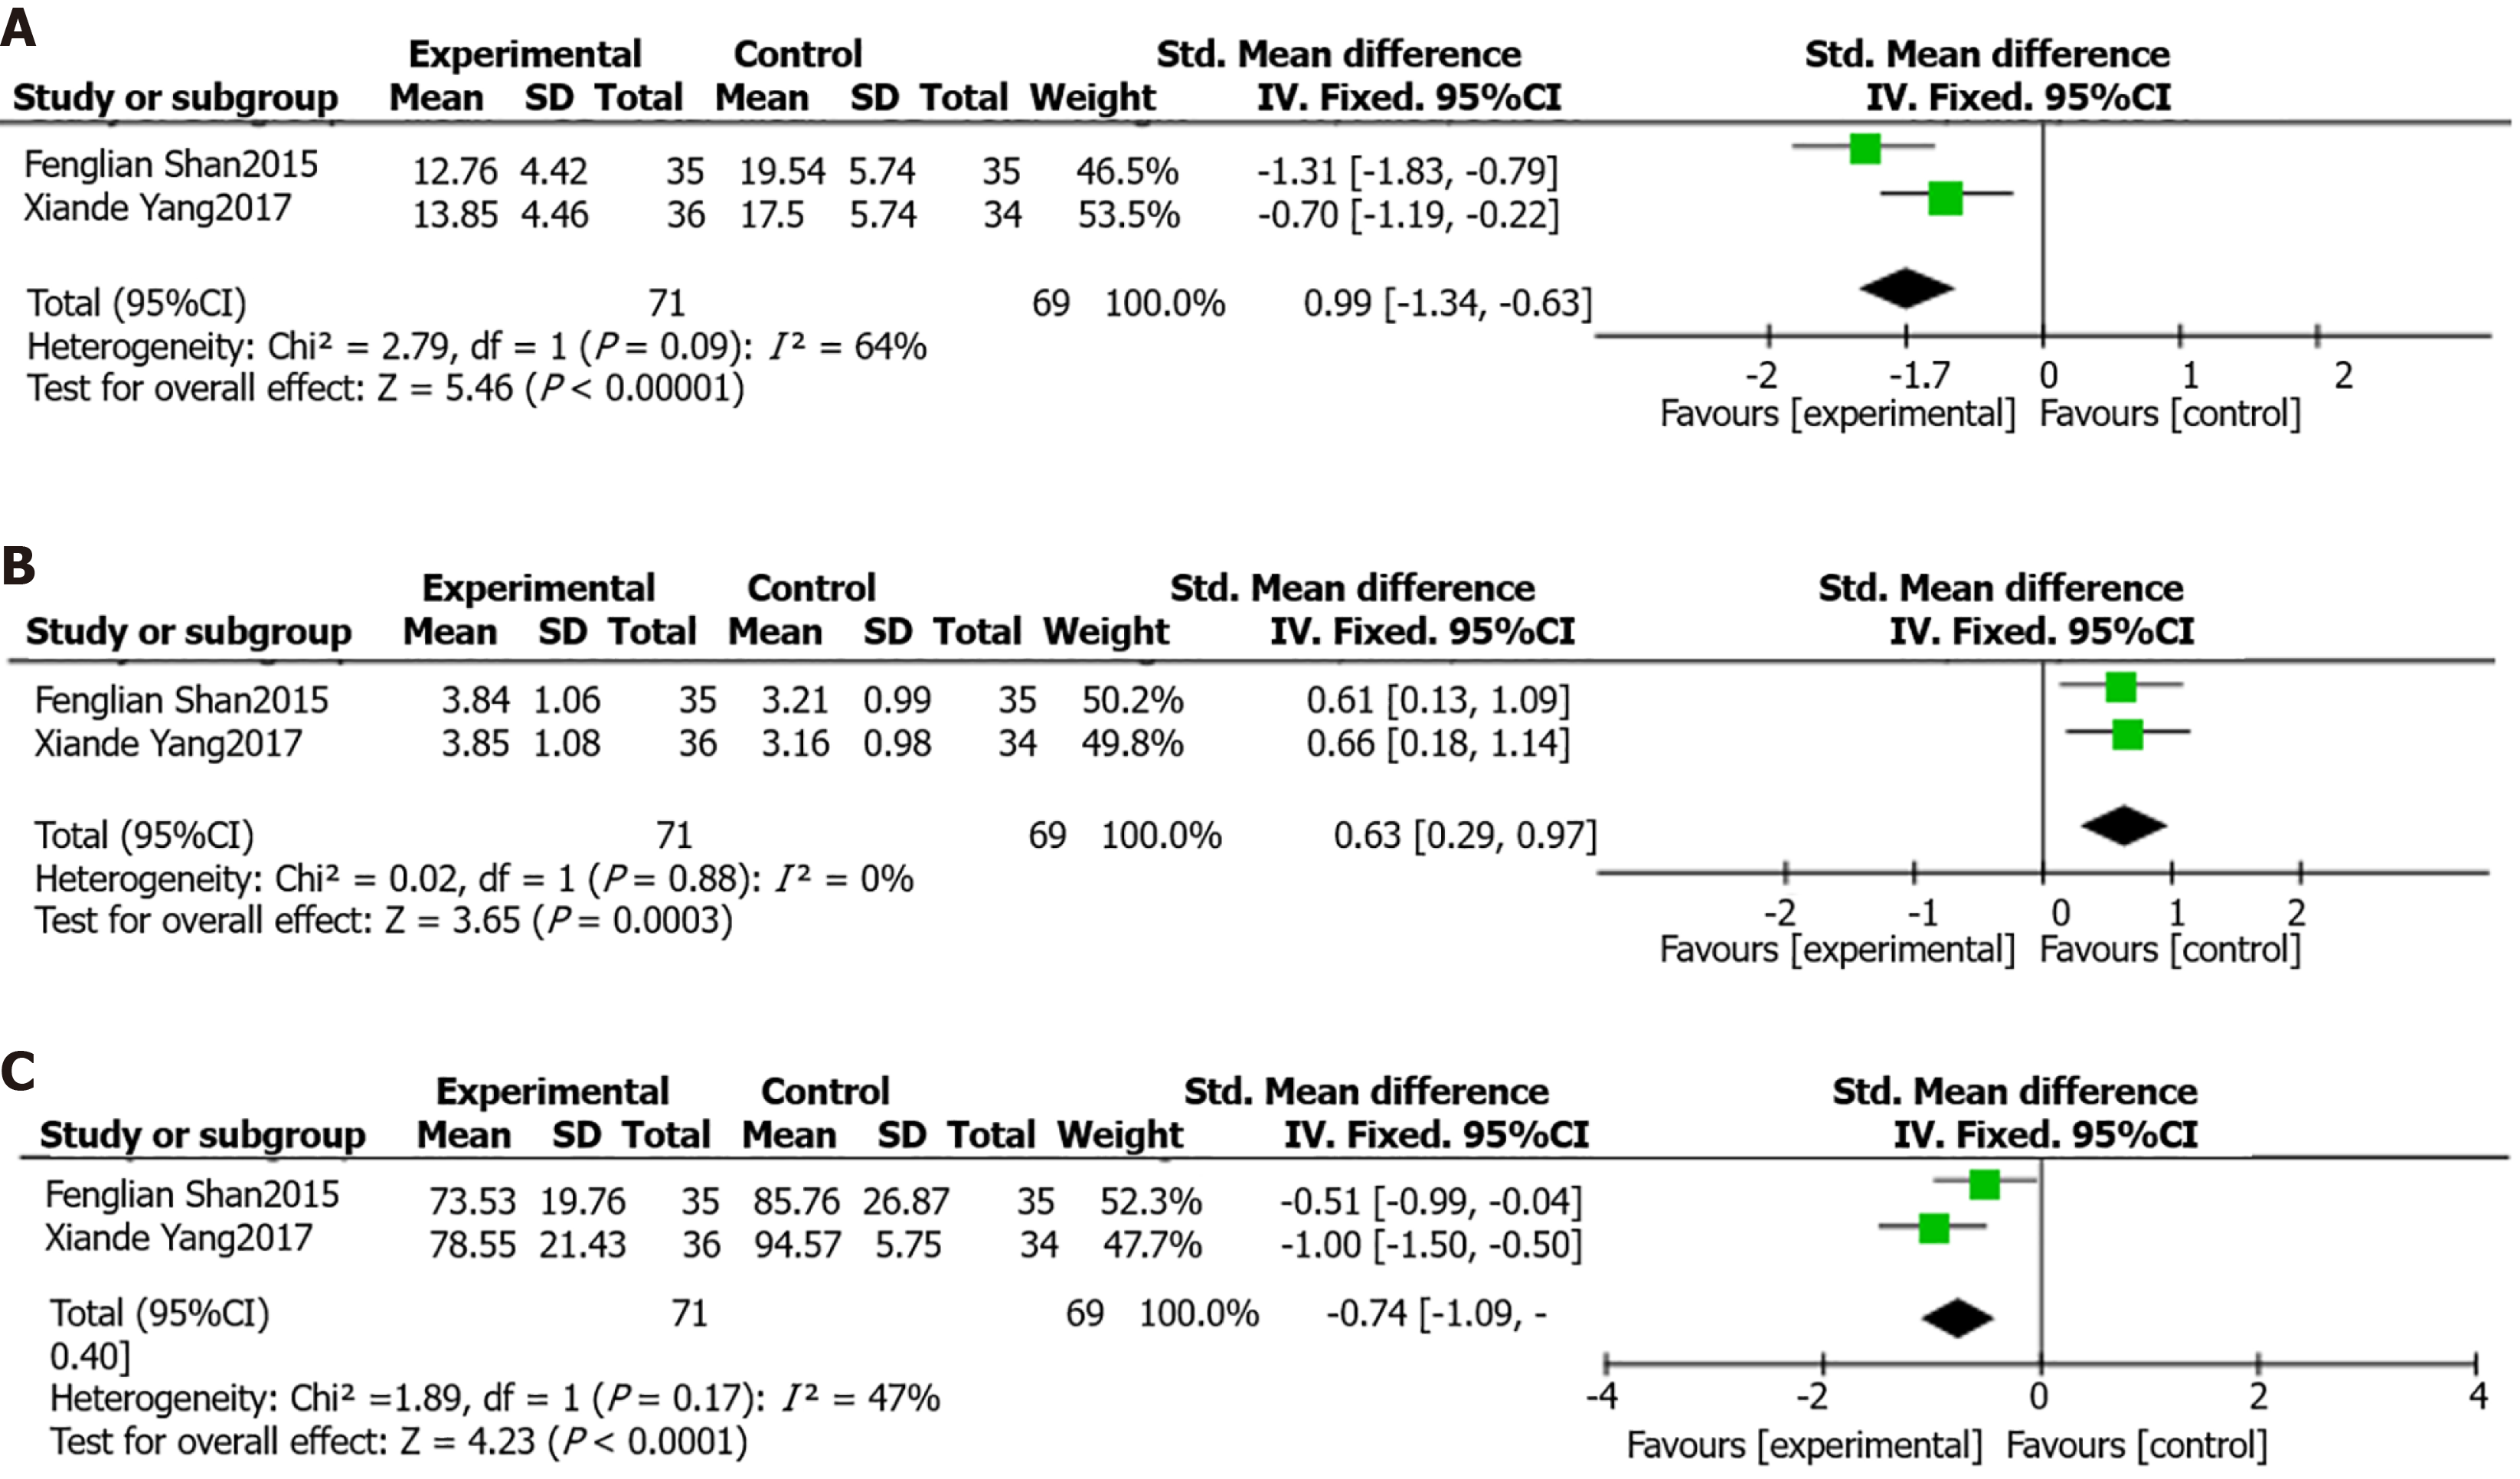
Figure 4 The cure time, hospitalization expenses, and the remission time of the two groups.
A: The cure time of two groups (P < 0.05); B: Hospitalization expenses of two groups (P < 0.05); C: The remission time of the two groups (P < 0.05). CI: Confidence interval.
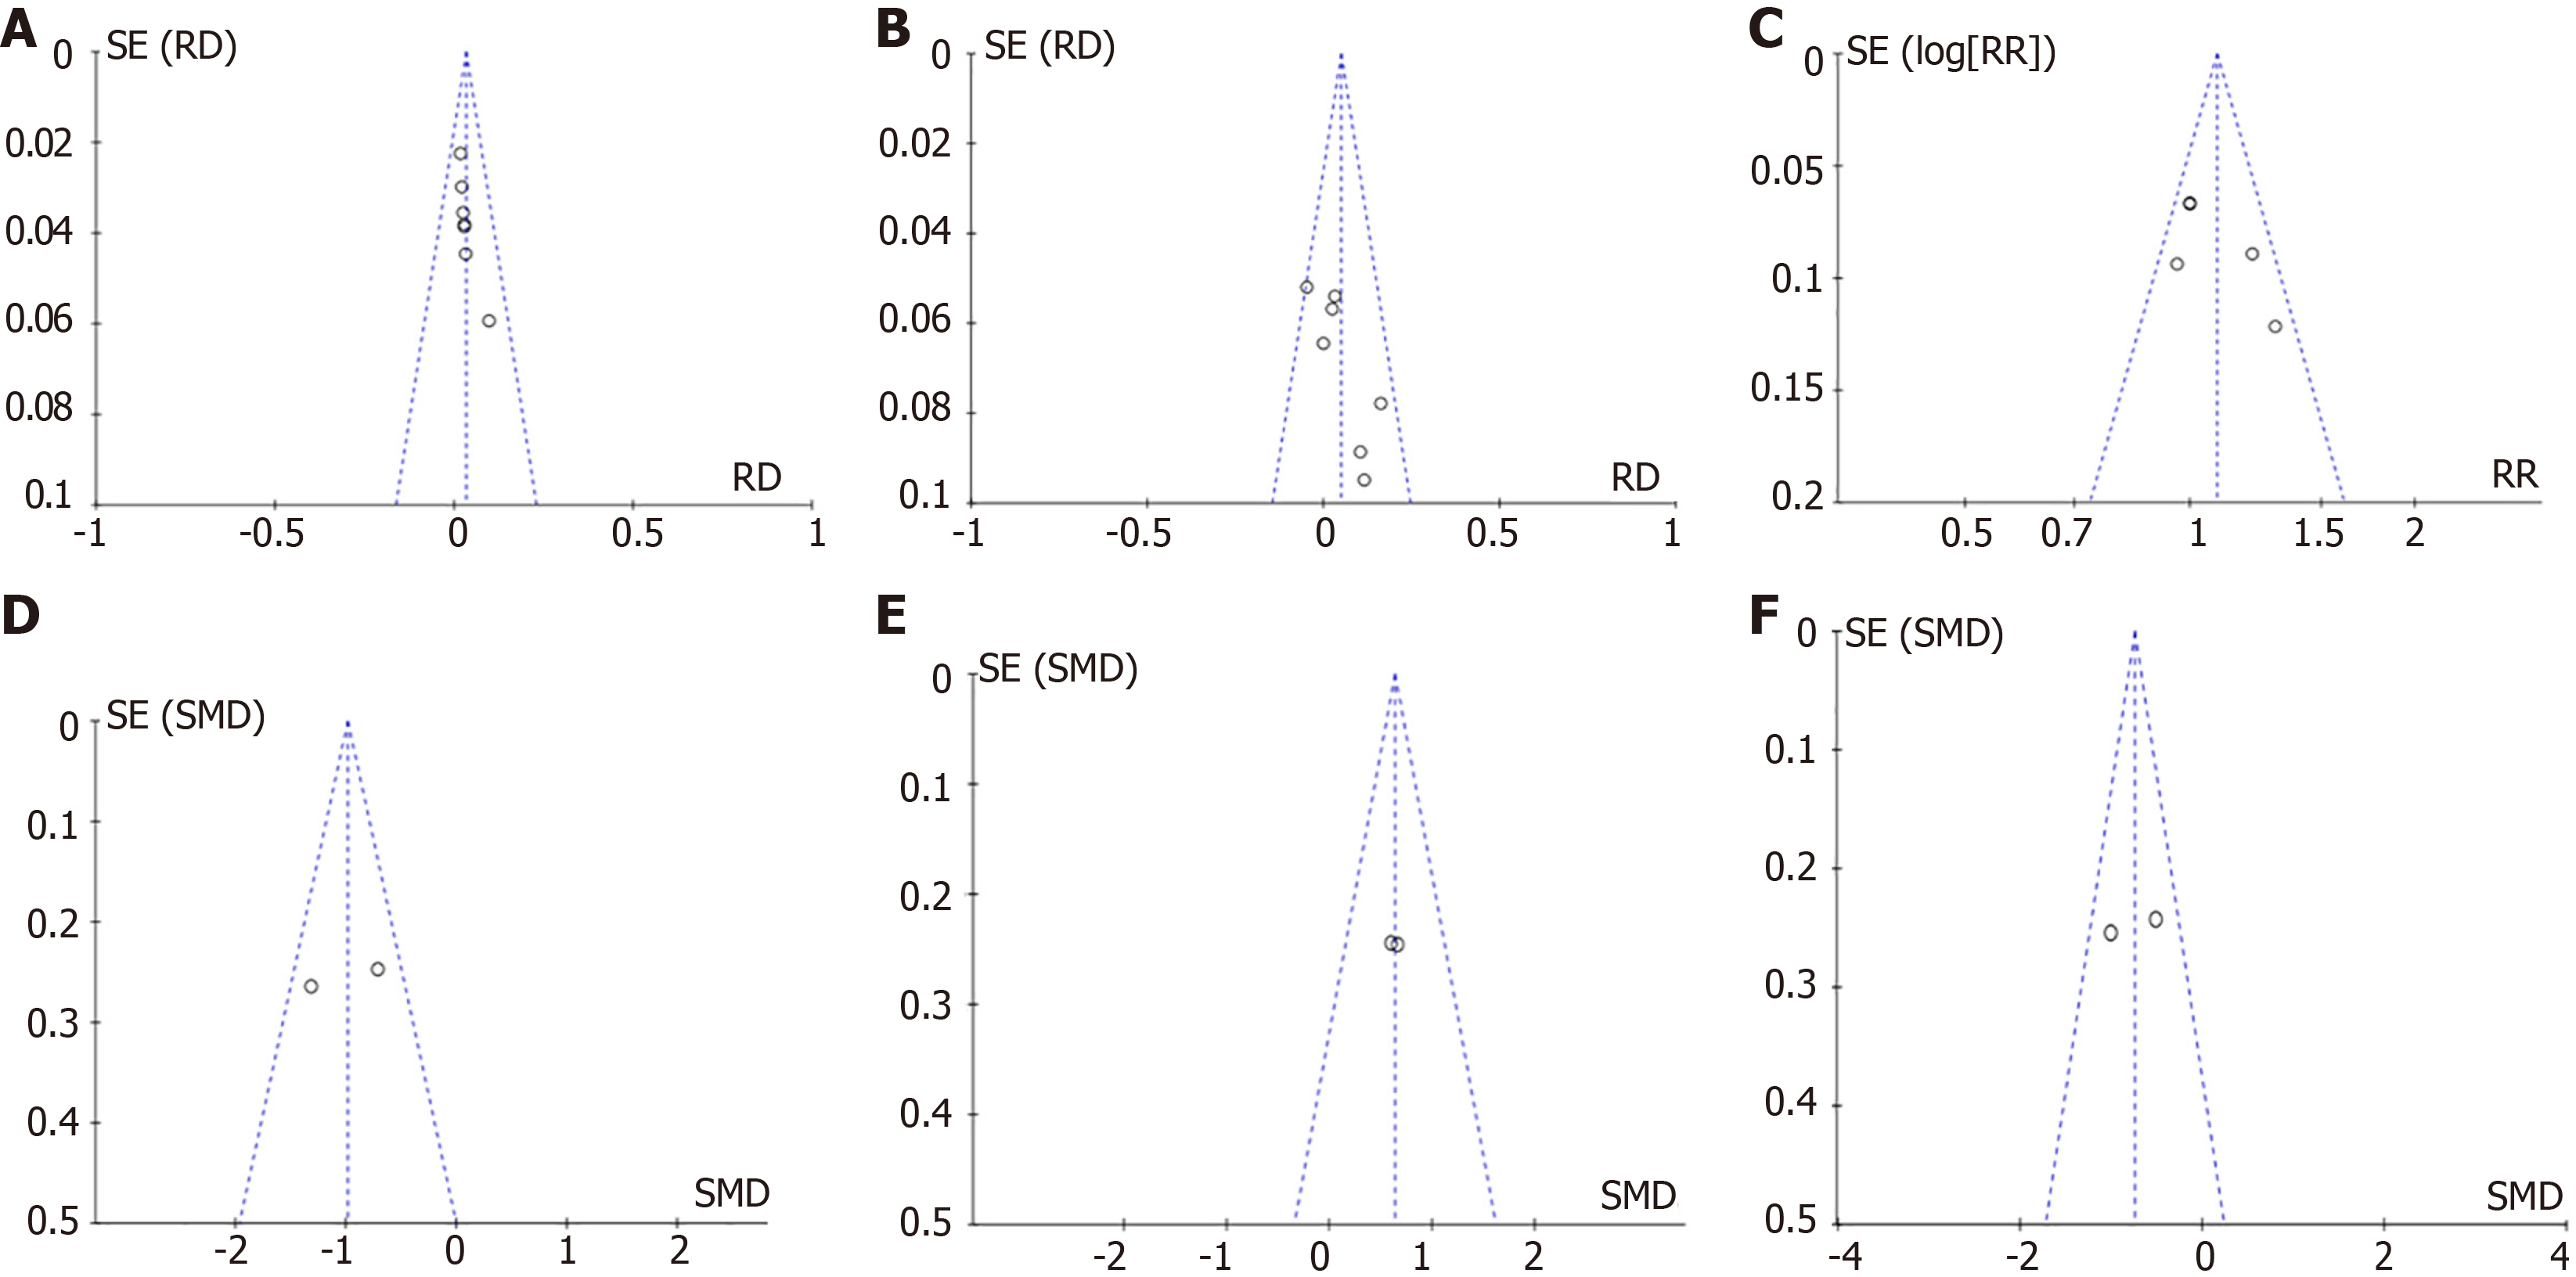
Figure 5 Funnel diagram of each study.
A: Funnel diagram of mental abnormality; B: Adverse reaction funnel diagram; C: Effective funnel diagram; D: Funnel chart of healing time; E: Funnel chart of hospitalization expenses; F: Funnel chart of remission time.
- Citation: Zhan ZH, Wang JL, Wang LH, Shen NN, Liu XW, Yu YN, Liu FR. Mechanism of imipenem-induced mental disorder: A meta-analysis. World J Psychiatry 2024; 14(10): 1583-1591
- URL: https://www.wjgnet.com/2220-3206/full/v14/i10/1583.htm
- DOI: https://dx.doi.org/10.5498/wjp.v14.i10.1583


