Copyright
©The Author(s) 2024.
World J Psychiatry. Oct 19, 2024; 14(10): 1484-1494
Published online Oct 19, 2024. doi: 10.5498/wjp.v14.i10.1484
Published online Oct 19, 2024. doi: 10.5498/wjp.v14.i10.1484
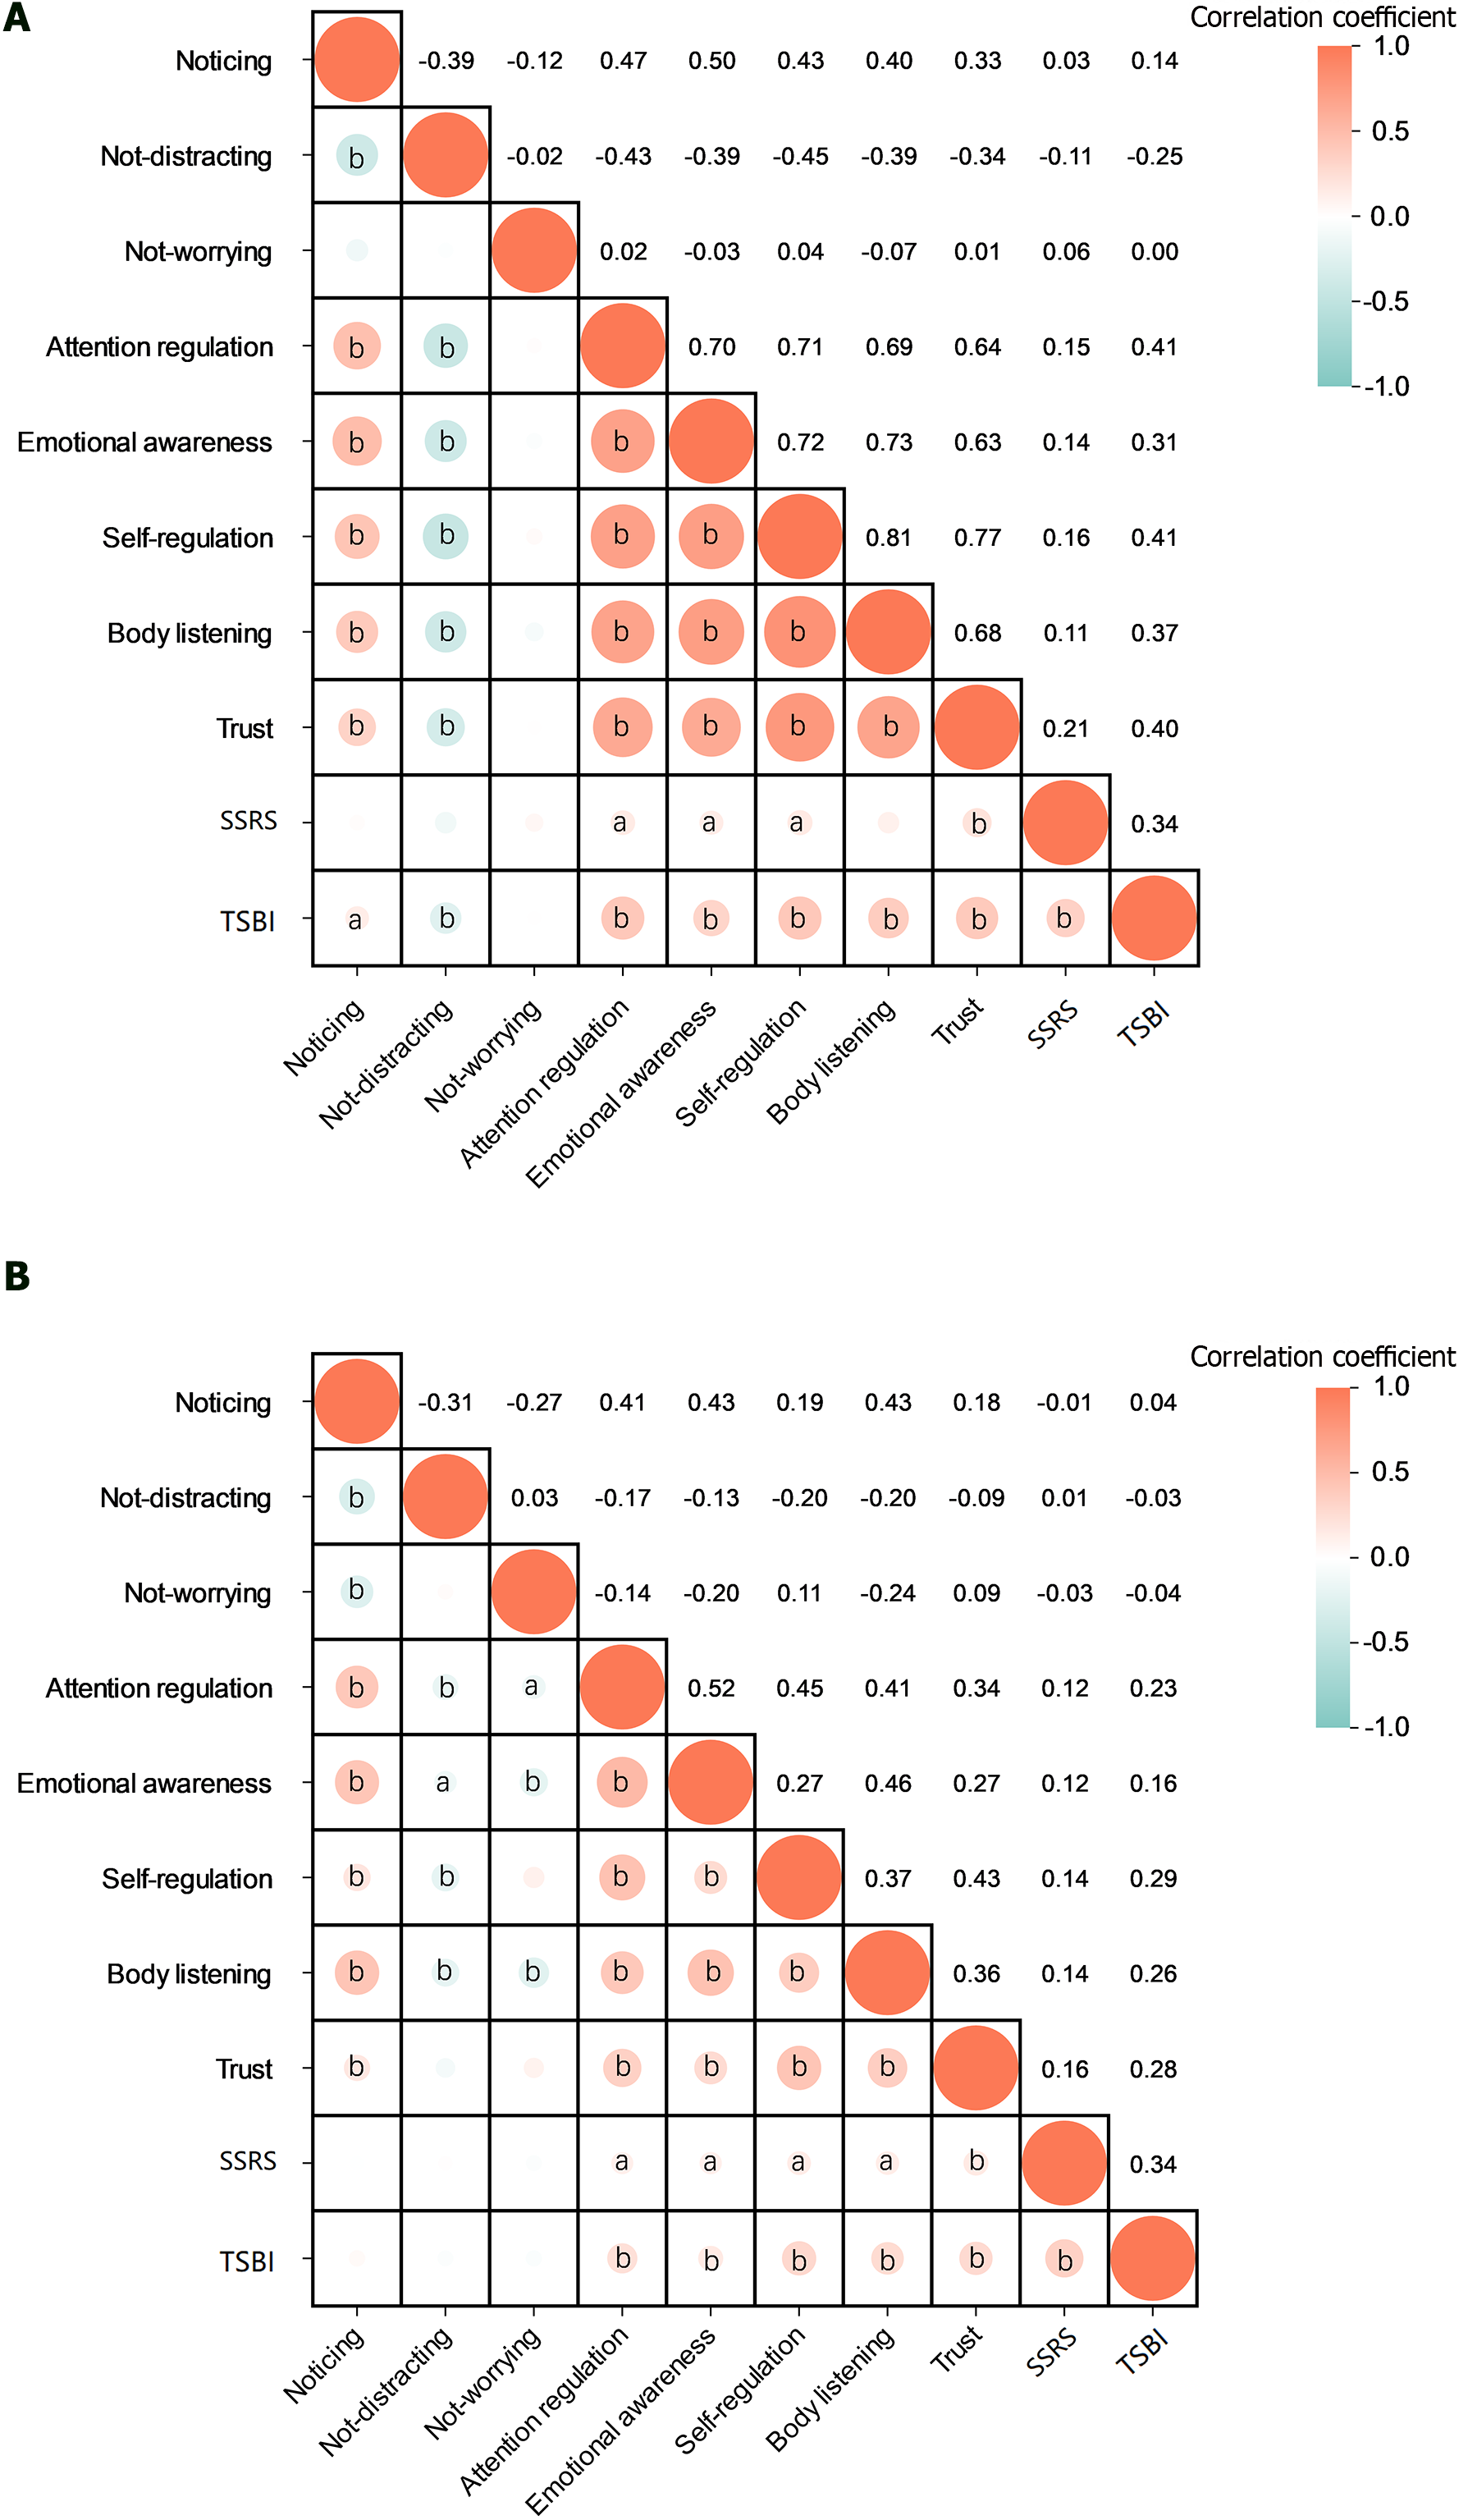
Figure 1 Pearson’s correlation matrix.
A: Pearson’s correlation matrix of major depressive group; B: Pearson’s correlation matrix of healthy control group. aP < 0.05; bP < 0.01. SSRS: Social support rating scale; TSBI: Texas social behavior inventory.
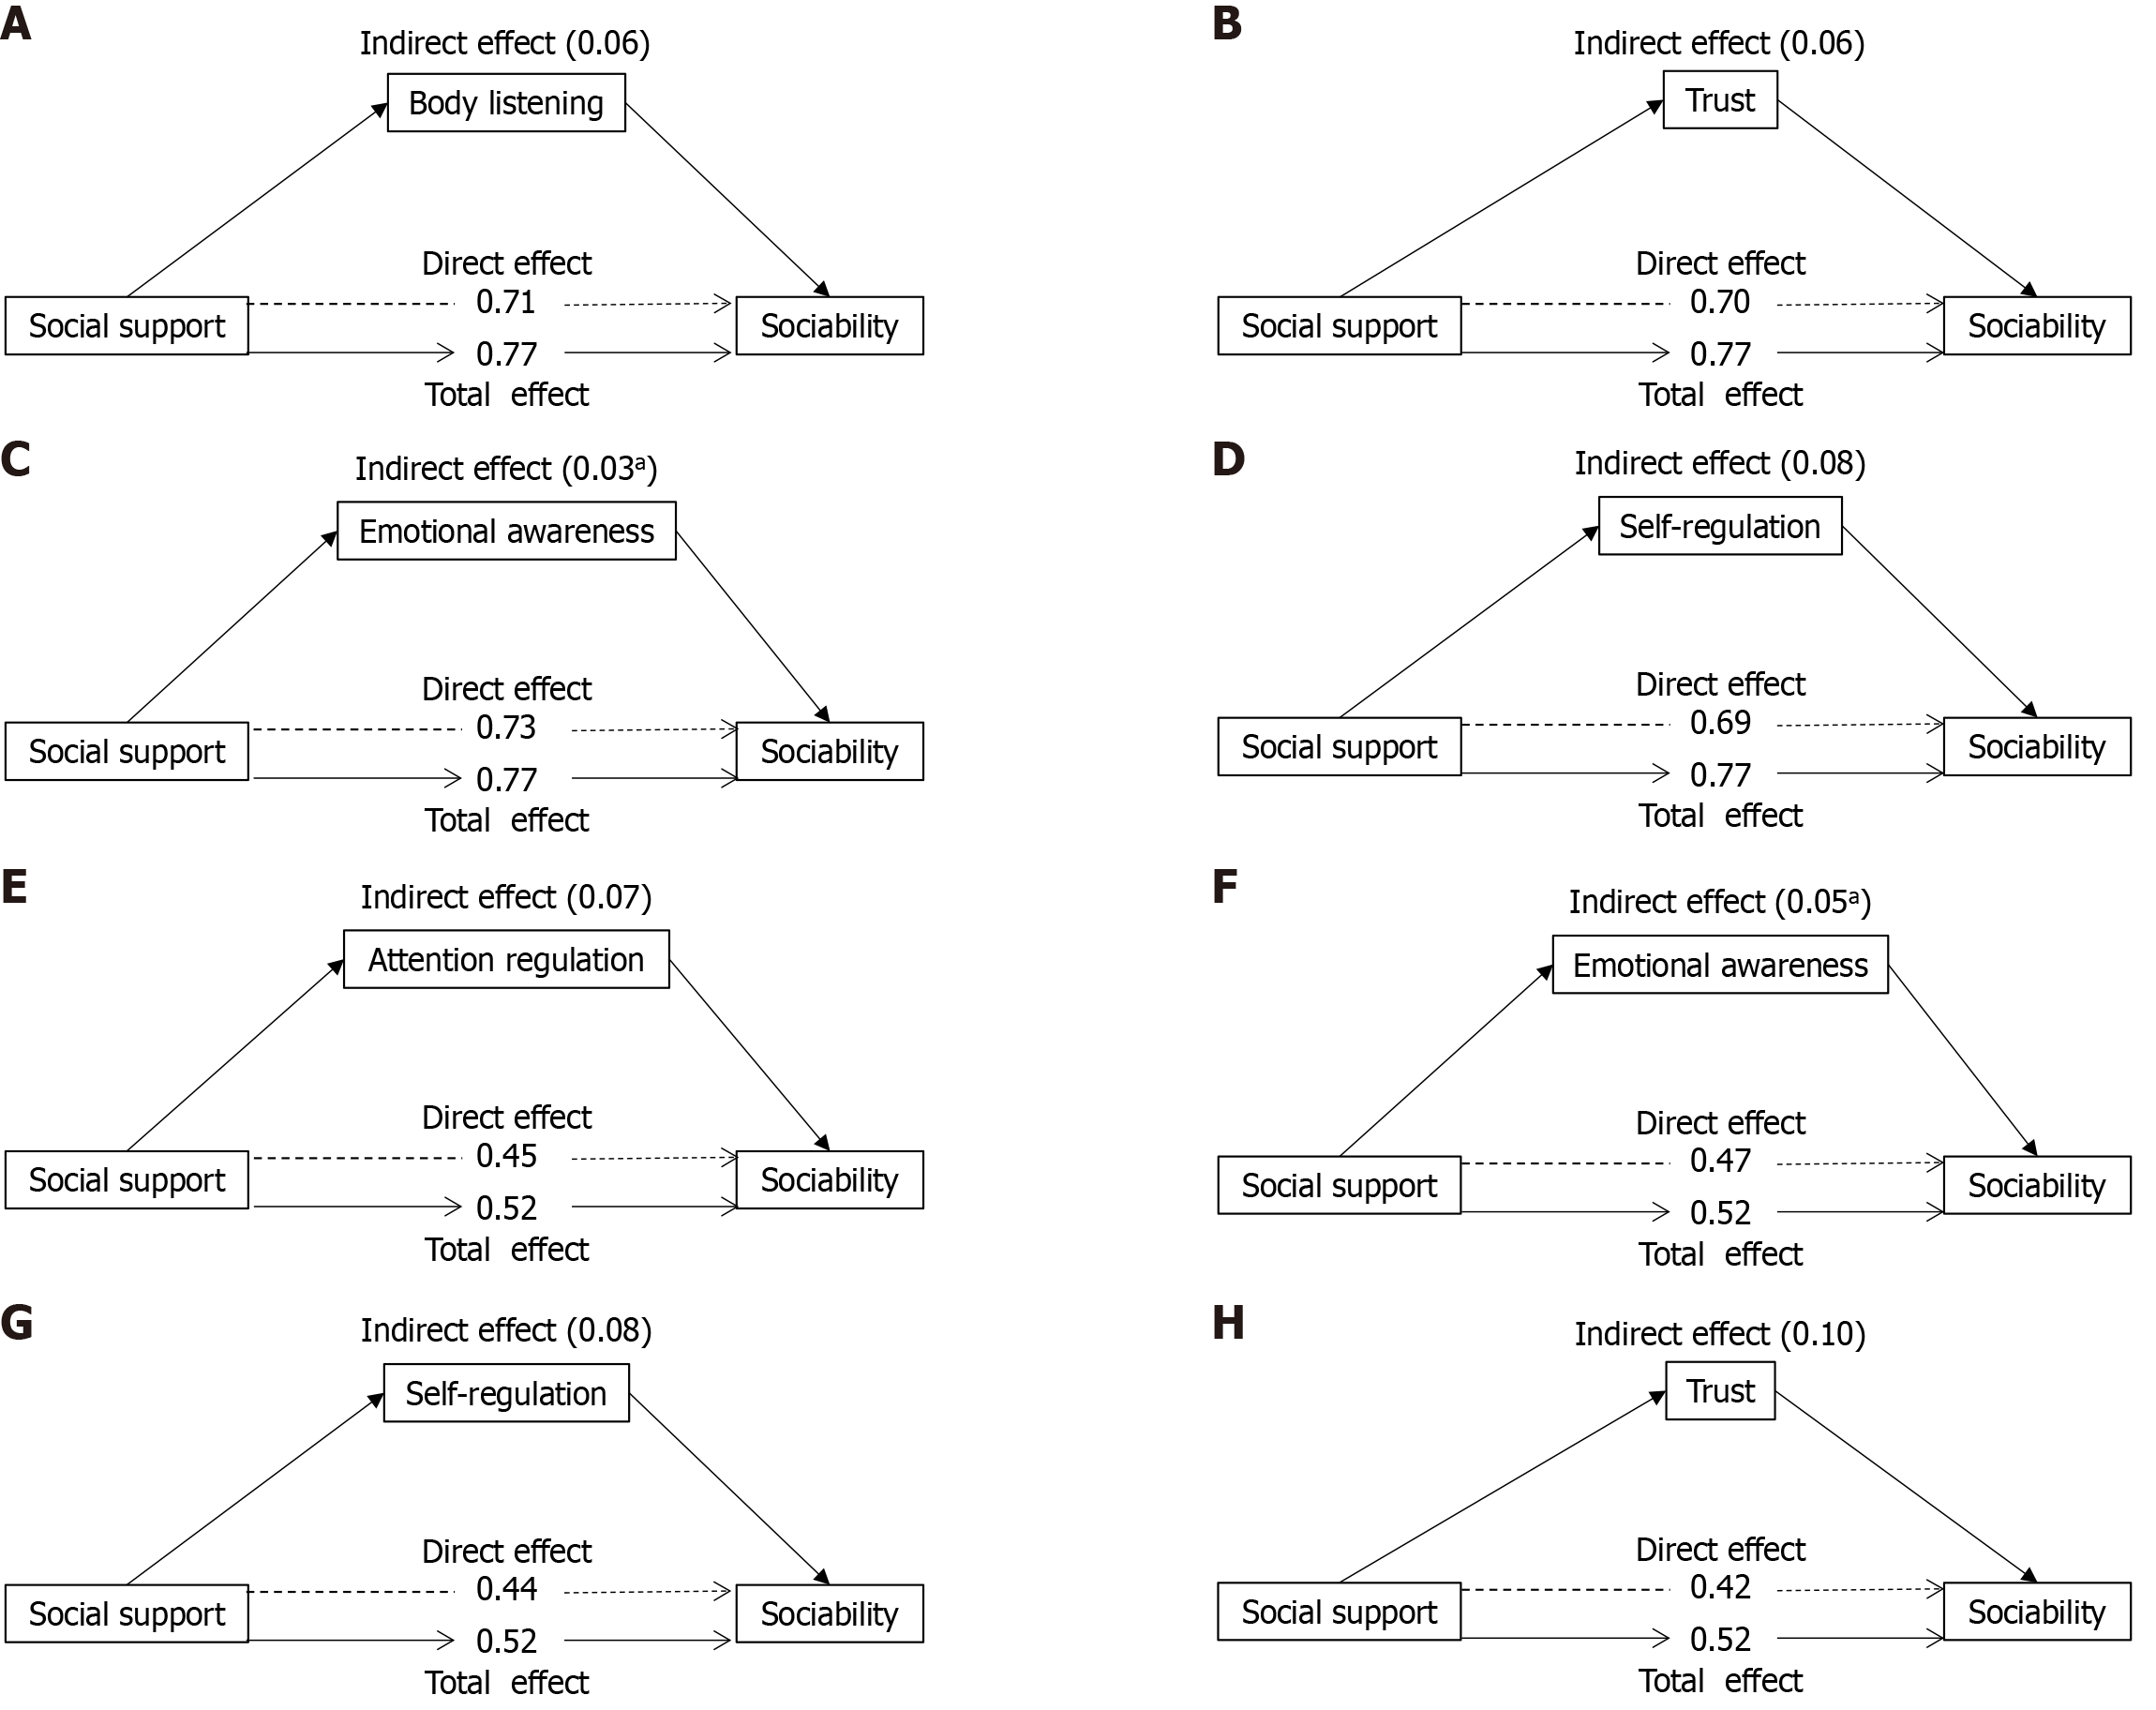
Figure 2 The bootstrap method was used to evaluate the mediation analysis model of interoception, with the sample size was set to 5000.
A: Social support was used as independent variable, sociability as dependent variable, and body listening as mediating variable; B: Social support was used as independent variable, sociability as dependent variable, and trust as mediating variable; C: Social support was used as independent variable, sociability as dependent variable, and emotional awareness as mediating variable; D: Social support was used as independent variable, sociability as dependent variable, and self-regulation as mediating variable; E: Social support was used as independent variable, sociability as dependent variable, and attention regulation as mediating variable; F: Social support was used as independent variable, sociability as dependent variable, and emotional awareness as mediating variable; G: Social support was used as independent variable, sociability as dependent variable, and self-regulation as mediating variable; H: Social support was used as independent variable, sociability as dependent variable, and trust as mediating variable. aP < 0.05; bP < 0.01.
- Citation: Wang WL, Liu JK, Sun YF, Liu XH, Ma YH, Gao XZ, Chen LM, Zhou ZH, Zhou HL. Interoception mediates the association between social support and sociability in patients with major depressive disorder. World J Psychiatry 2024; 14(10): 1484-1494
- URL: https://www.wjgnet.com/2220-3206/full/v14/i10/1484.htm
- DOI: https://dx.doi.org/10.5498/wjp.v14.i10.1484


