Copyright
©The Author(s) 2025.
World J Exp Med. Jun 20, 2025; 15(2): 100443
Published online Jun 20, 2025. doi: 10.5493/wjem.v15.i2.100443
Published online Jun 20, 2025. doi: 10.5493/wjem.v15.i2.100443
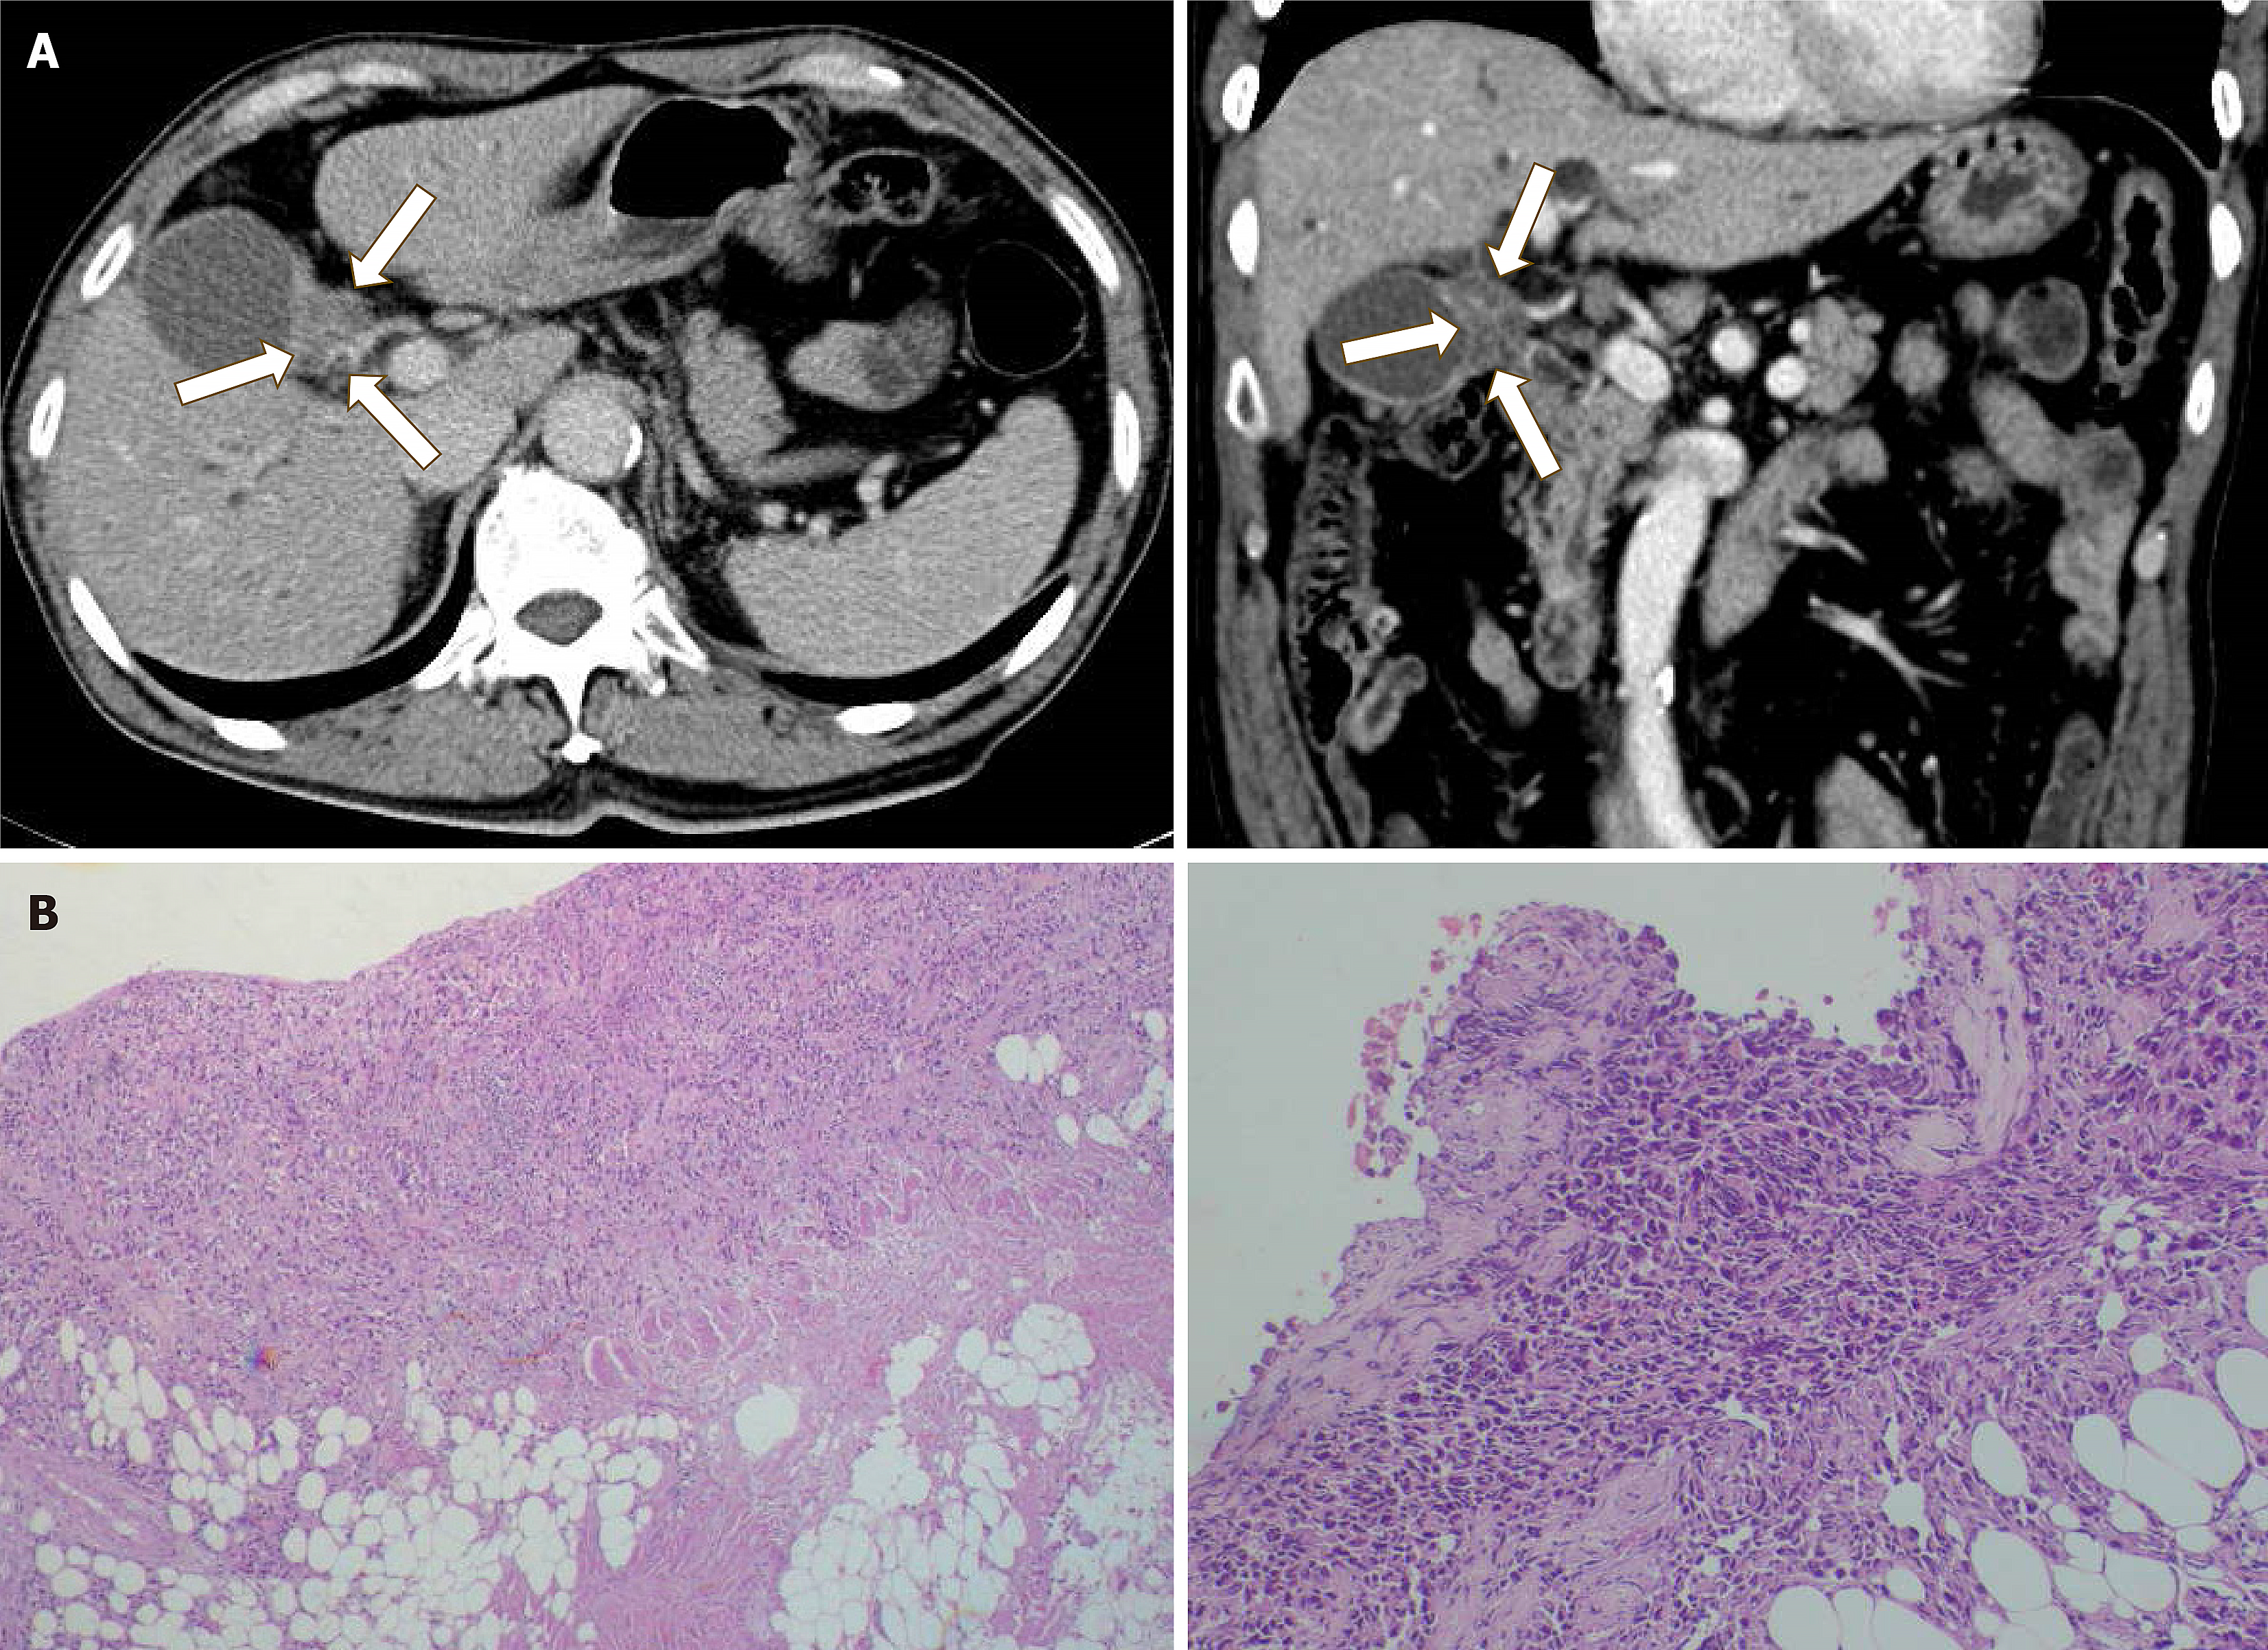
Figure 1 Computed tomography scan and histopathological findings of a patient with gall bladder cancer.
A: Computed tomography (CT) findings of the primary tumor. CT scan image of the transverse and coronal planes display gallbladder carcinoma (arrows); B: Hematoxylin and eosin staining of the metastatic peritoneal tumor of patients with gallbladder cancer. The tumor showed poorly differentiated growth with moderate stromal cells.
Figure 2 Morphologic findings of OCUG-2 cells.
A: Photomicrography of living OCUG-2 cells; B: Growth curve of OCUG-2 cells; C: Hematoxylin and eosin (H&E)-stained section of subcutaneous tumors induced by OCUG-2 cell injection in nude mice. Tumor histology was consistent with that of the original primary tumor, as shown by H&E staining. Scale bar, 100 μm.
Figure 3 Expression of growth factor receptors and growth kinetics.
A: mRNA expression of growth factor receptors EGFR, HER2, ERBB3, ERBB4, PDGFR-α, PDGFR-β, insulin-like growth factor 1 receptor, FMS-like tyrosine kinase, FGFR1, FGFR2, FGFR3, FGFR4, VEGFR1, VEGFR2, VEGFR3, c-Kit, and c-Met; B: Growth curves of OCUG-2 cells treated with panitumumab, cetuximab, bevacizumab, ramucirumab, CP673451, picropodophyllin, SU11274, infigratinib, FGF401, afatinib, sapitinib, and trastuzumab. Growth of OCUG-2 cells was significantly decreased by picropodophyllotoxin.
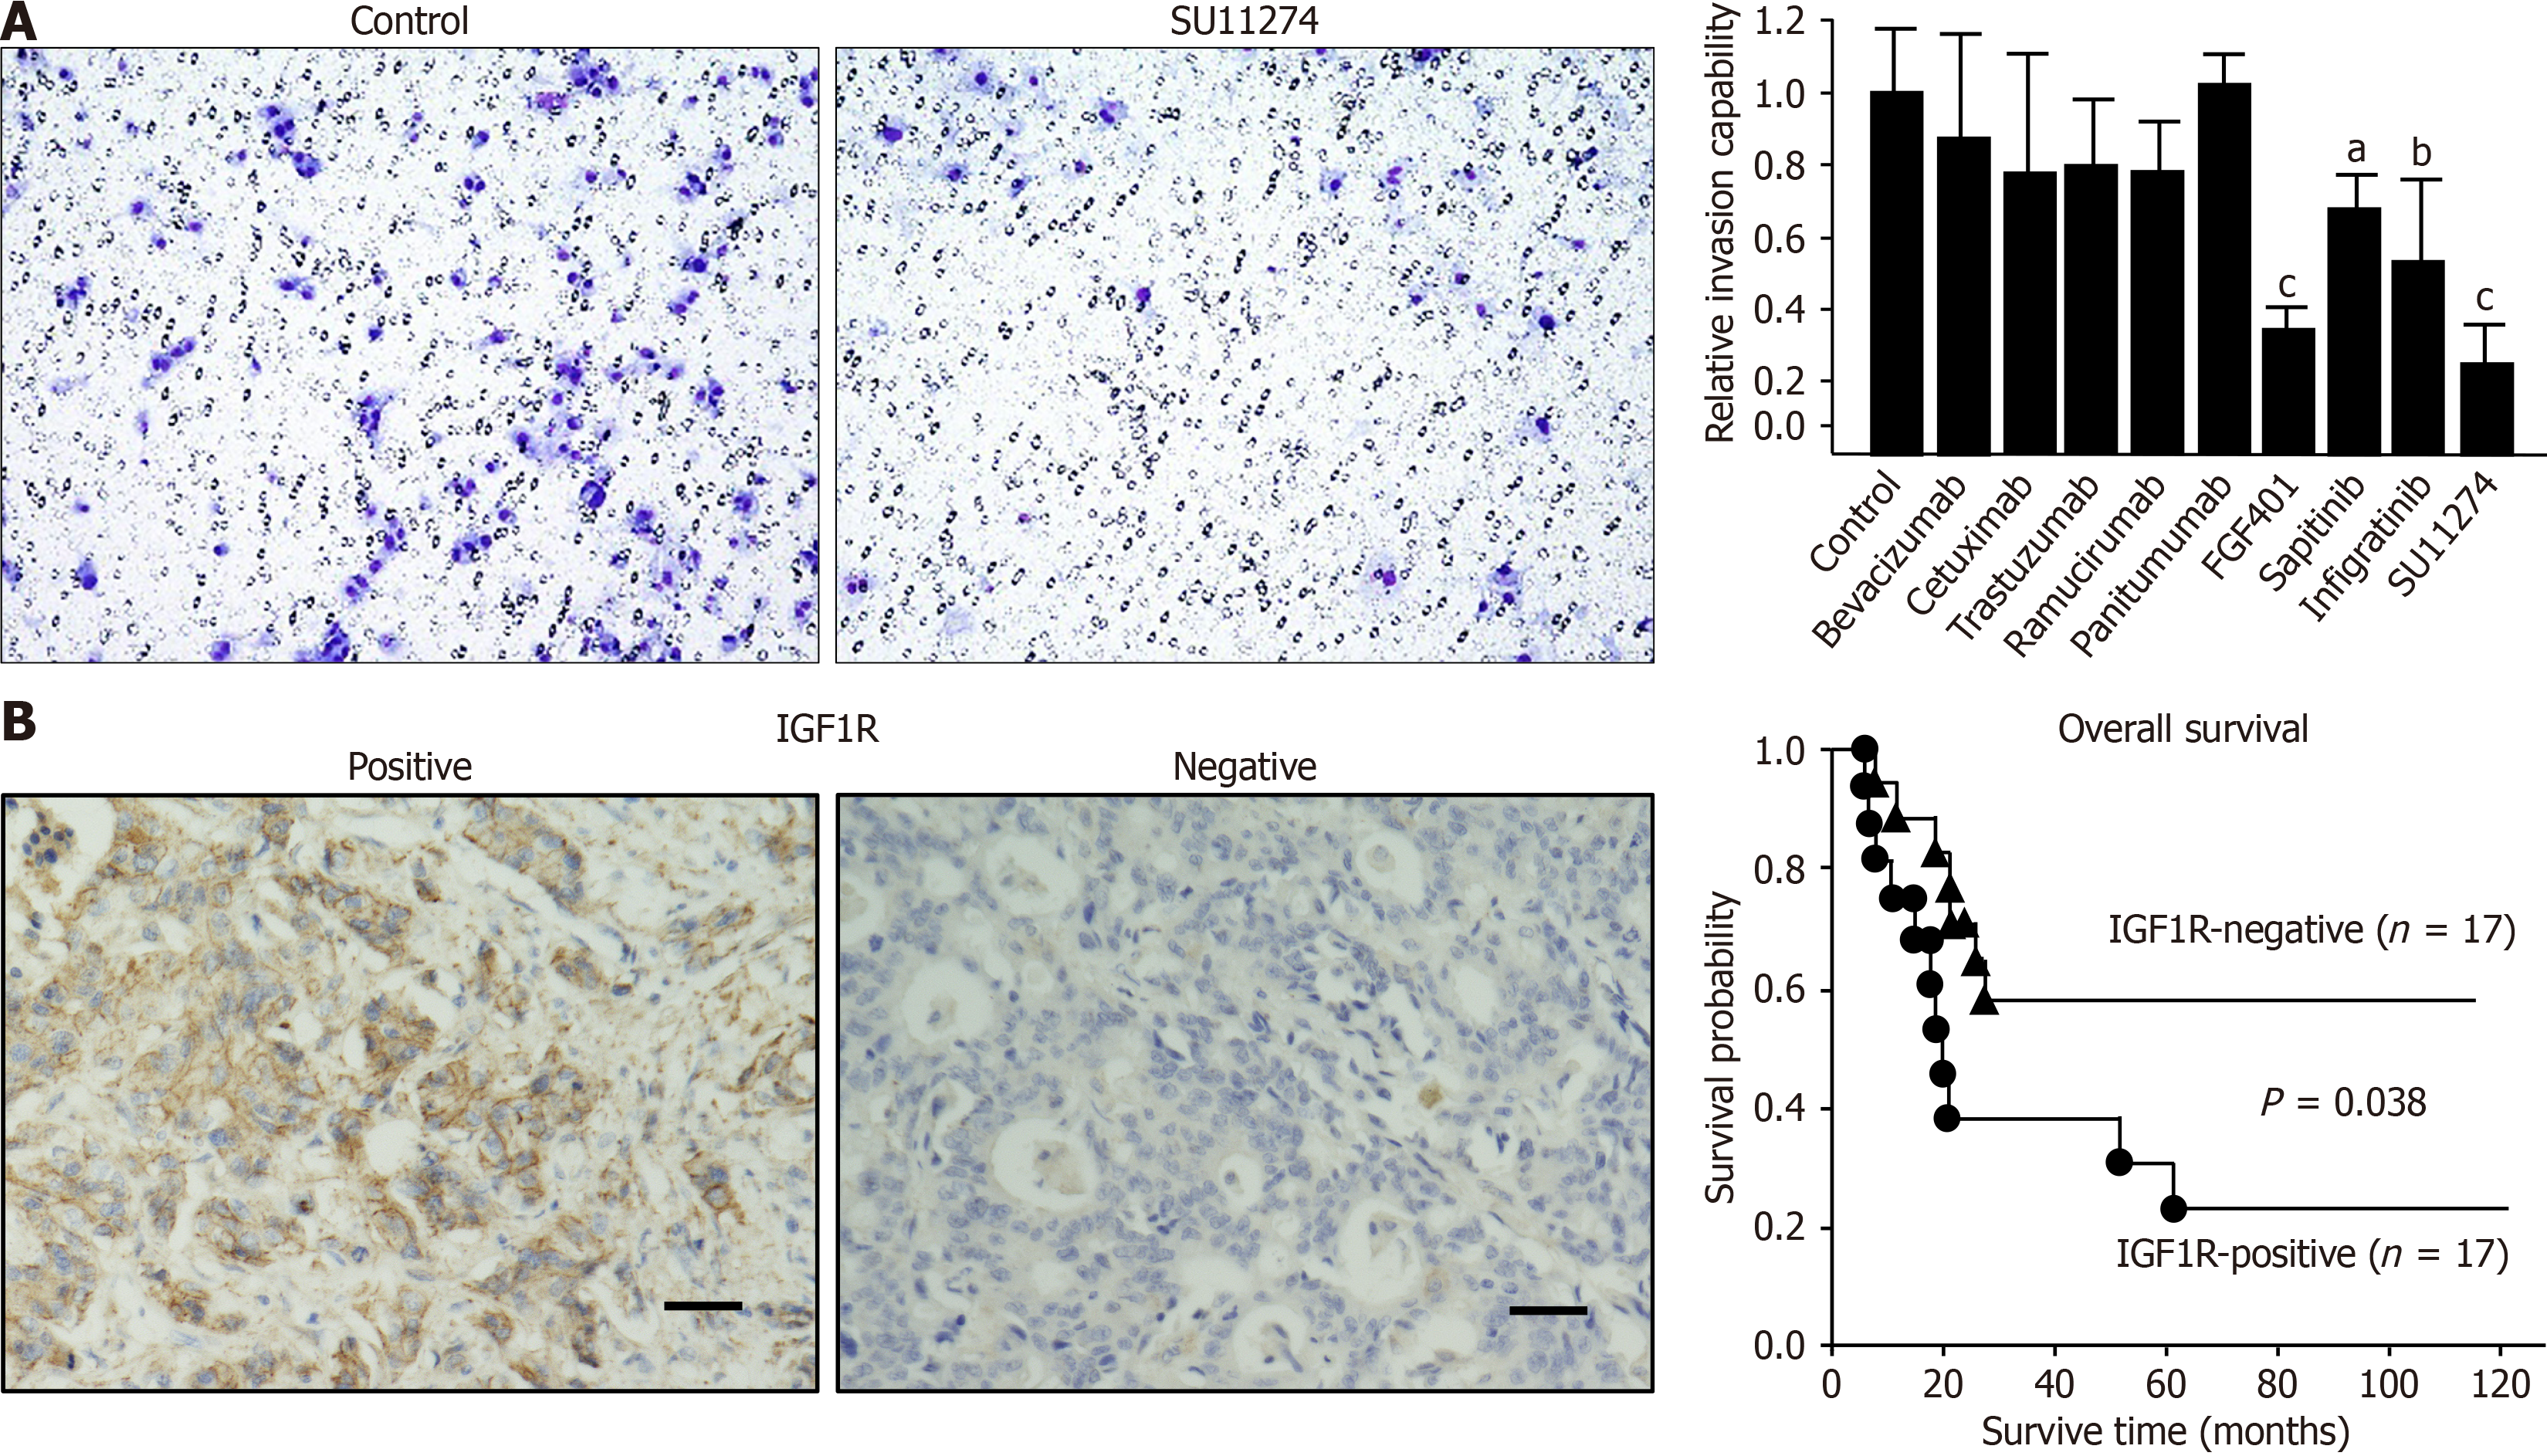
Figure 4 Invasion ability of OCUG-2 cells and insulin-like growth factor 1 receptor staining of gall bladder tumors.
A: Effects of various targeted drugs on the invasion ability of OCUG-2 cells. Invasion ratio of OCUG-2 cells post-treatment compared to controls. Photograph (200 ×) of OCUG-2 invasion cells treated with control or SU11274; B: Immunohistochemical staining of insulin-like growth factor 1 receptor (IGF1R). IGF1R expression was found on cancer cell membrane. Scale bar, 100 μm. Kaplan-Meier survival analysis comparing overall survival and disease-free survival in IGF1R-positive and IGF1R-negative gallbladder cancer patients. aP < 0.05, bP < 0.01, and cP < 0.001.
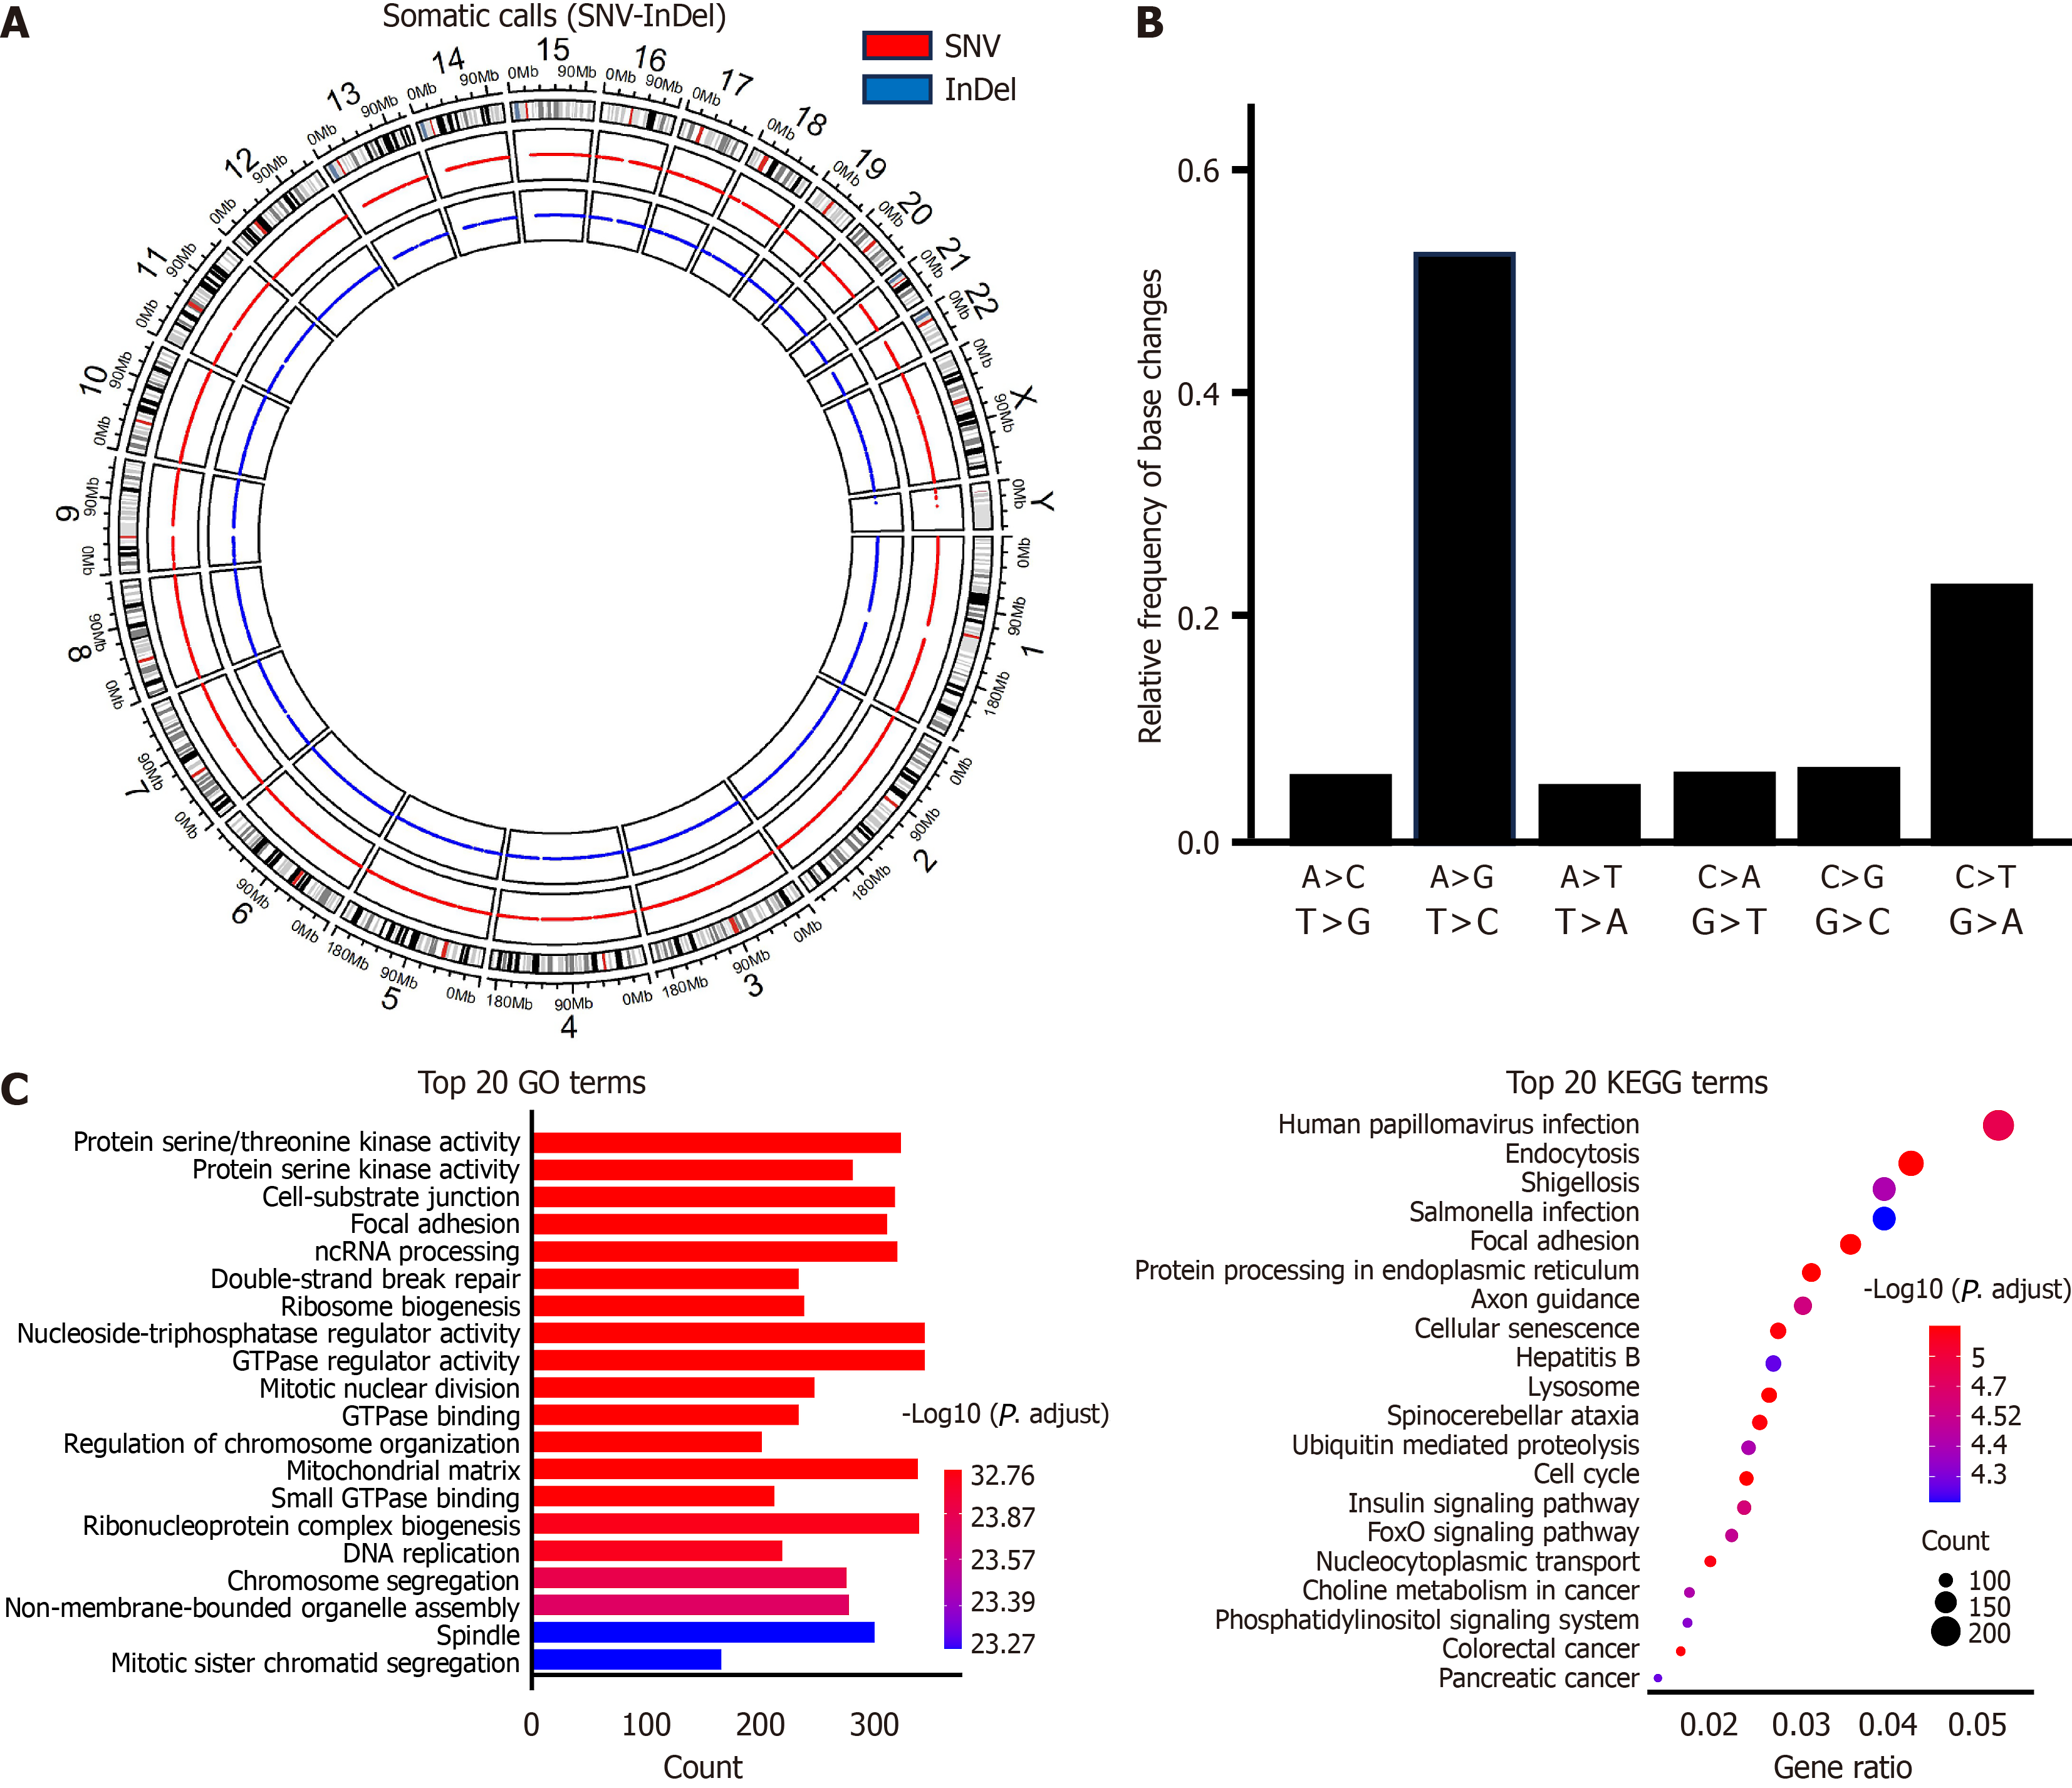
Figure 5 RNA-sequencing characterization of OCUG-2 cells.
A: Circular graph depicting single nucleotide polymorphisms and indel variations in the OCUG-2 genome; B: Mutation spectrum of single nucleotide variants in the OCUG-2 genome; C: Gene Ontology analysis and the significantly enriched Kyoto Encyclopedia of Genes and Genomes pathways of the top 20 mutation genes selected based on q-values. GO: Gene Ontology; KEGG: Kyoto Encyclopedia of Genes and Genomes.
- Citation: Wang Q, Fan C, Tsujio G, Sakuma T, Maruo K, Yamamoto Y, Imanishi D, Kawabata K, Nishikubo H, Kanei S, Aoyama R, Kushiyama S, Ohira M, Yashiro M. Establishment and characterization of a new human gallbladder cancer cell line, OCUG-2. World J Exp Med 2025; 15(2): 100443
- URL: https://www.wjgnet.com/2220-315x/full/v15/i2/100443.htm
- DOI: https://dx.doi.org/10.5493/wjem.v15.i2.100443


