Copyright
©The Author(s) 2024.
World J Exp Med. Mar 20, 2024; 14(1): 87916
Published online Mar 20, 2024. doi: 10.5493/wjem.v14.i1.87916
Published online Mar 20, 2024. doi: 10.5493/wjem.v14.i1.87916
Figure 1 The block diagram encompasses a comprehensive diabetes management system: A glucose sensing component utilizes a glucose sensor, feeding data to an artificial intelligence driven decision system, which then triggers an insulin dispensing mechanism, forming an integrated framework for precise and automated diabetes control.
AI: Artificial intelligence.
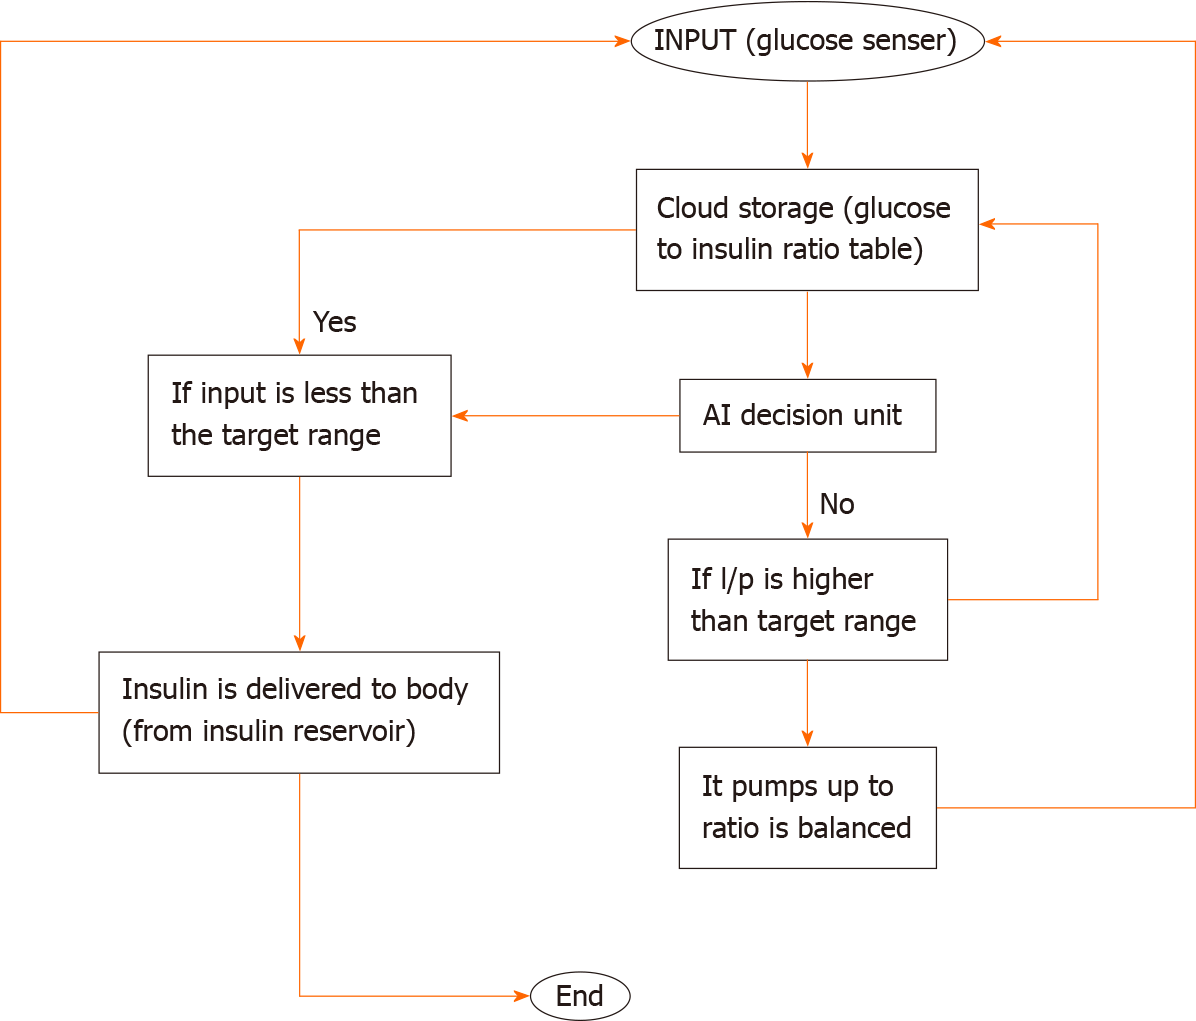
Figure 2 The flow chart illustrates a closed-loop diabetes management system that optimizes patient care.
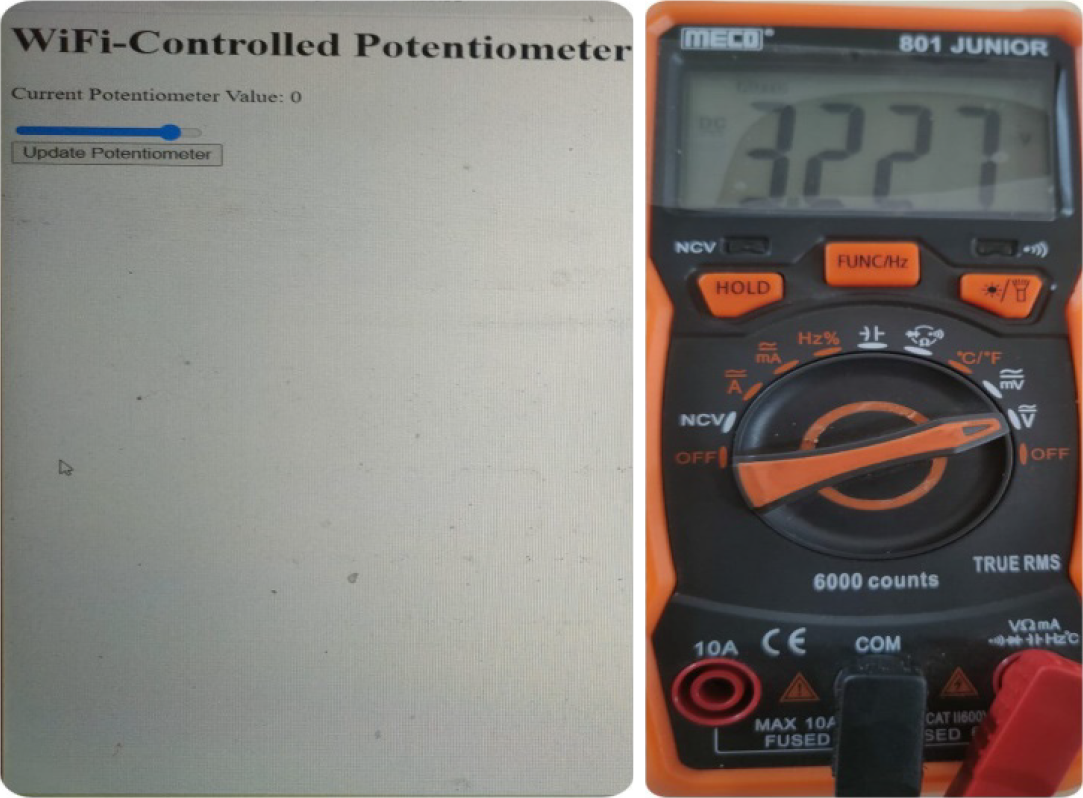
Figure 3 Wi-Fi controller for the pumping system.
Figure 4 Graph depicts the dynamic relationship between glucose concentration and time, revealing fluctuations that highlight the critical need for precise glucose management in diabetes care.
Figure 5 Graph showcases the correlation between glucose concentration and basal insulin dosage, providing insights into the effectiveness of the basal insulin regimen in maintaining stable glucose levels.
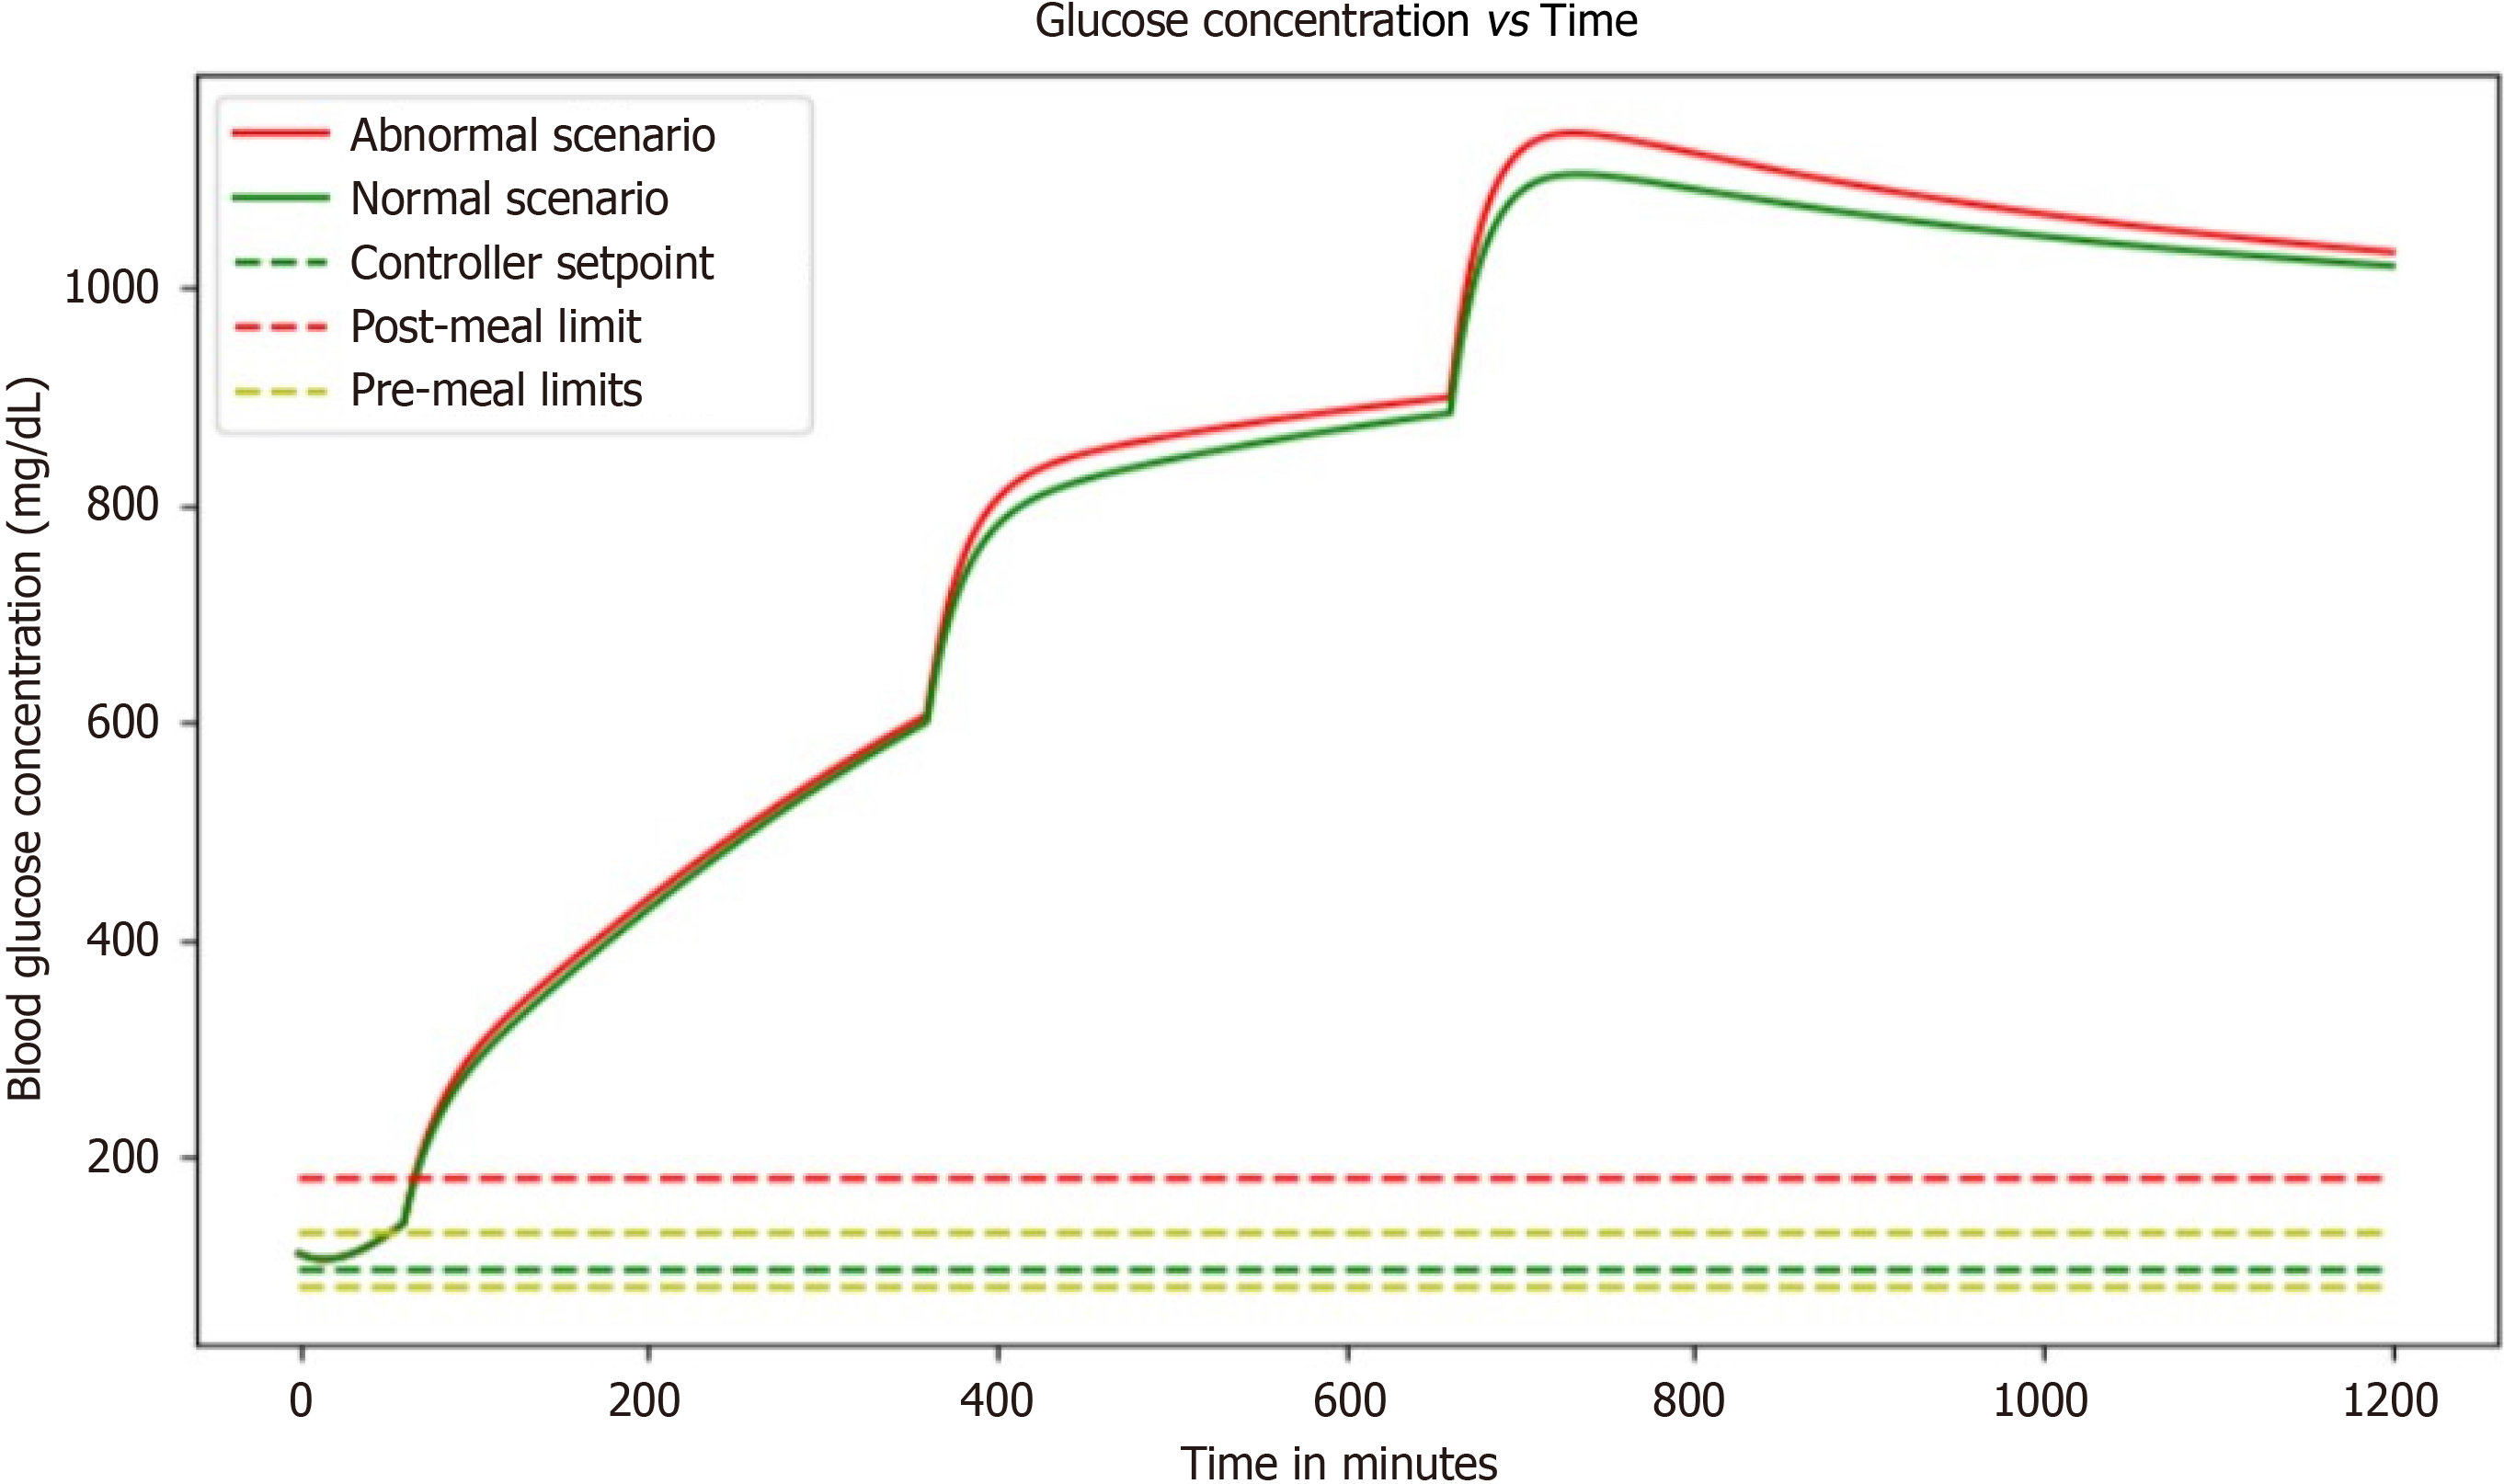
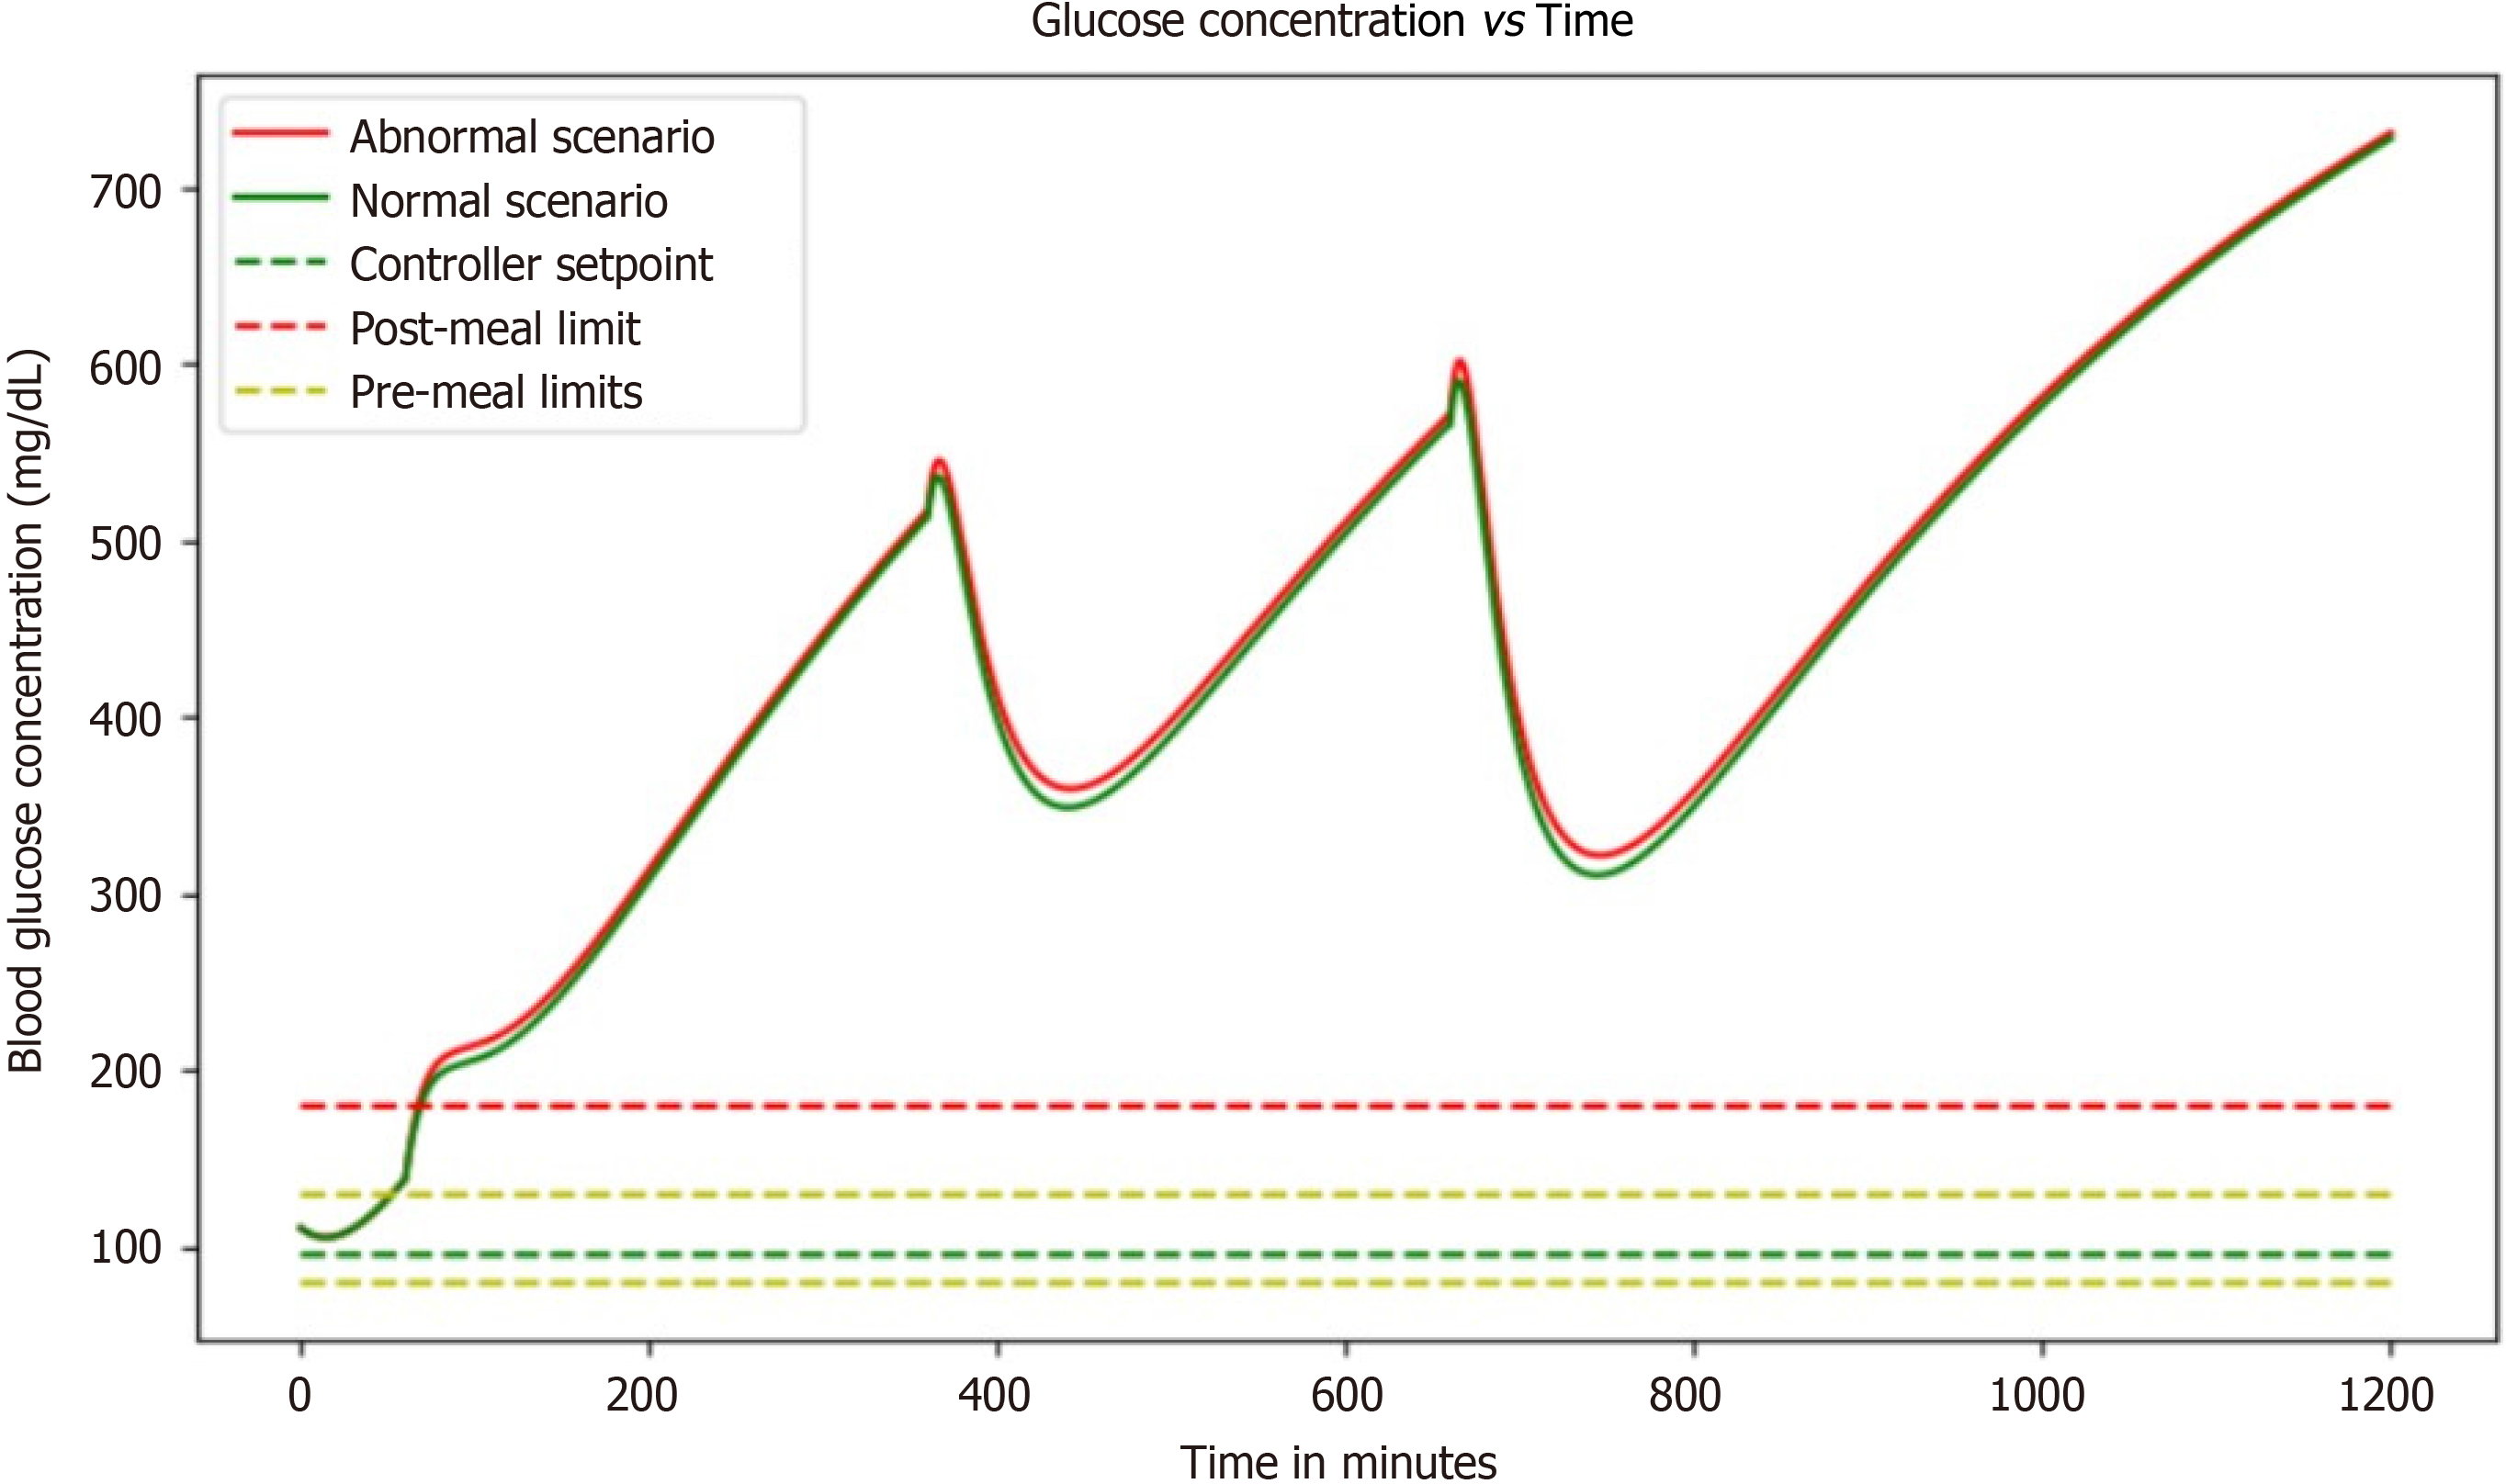
Figure 6 Graph highlights the impact of high glucose concentrations, revealing the critical importance of effective interventions to prevent hyperglycemia-related complications in diabetes management, but after a certain period of time glucose levels increases abnormally.
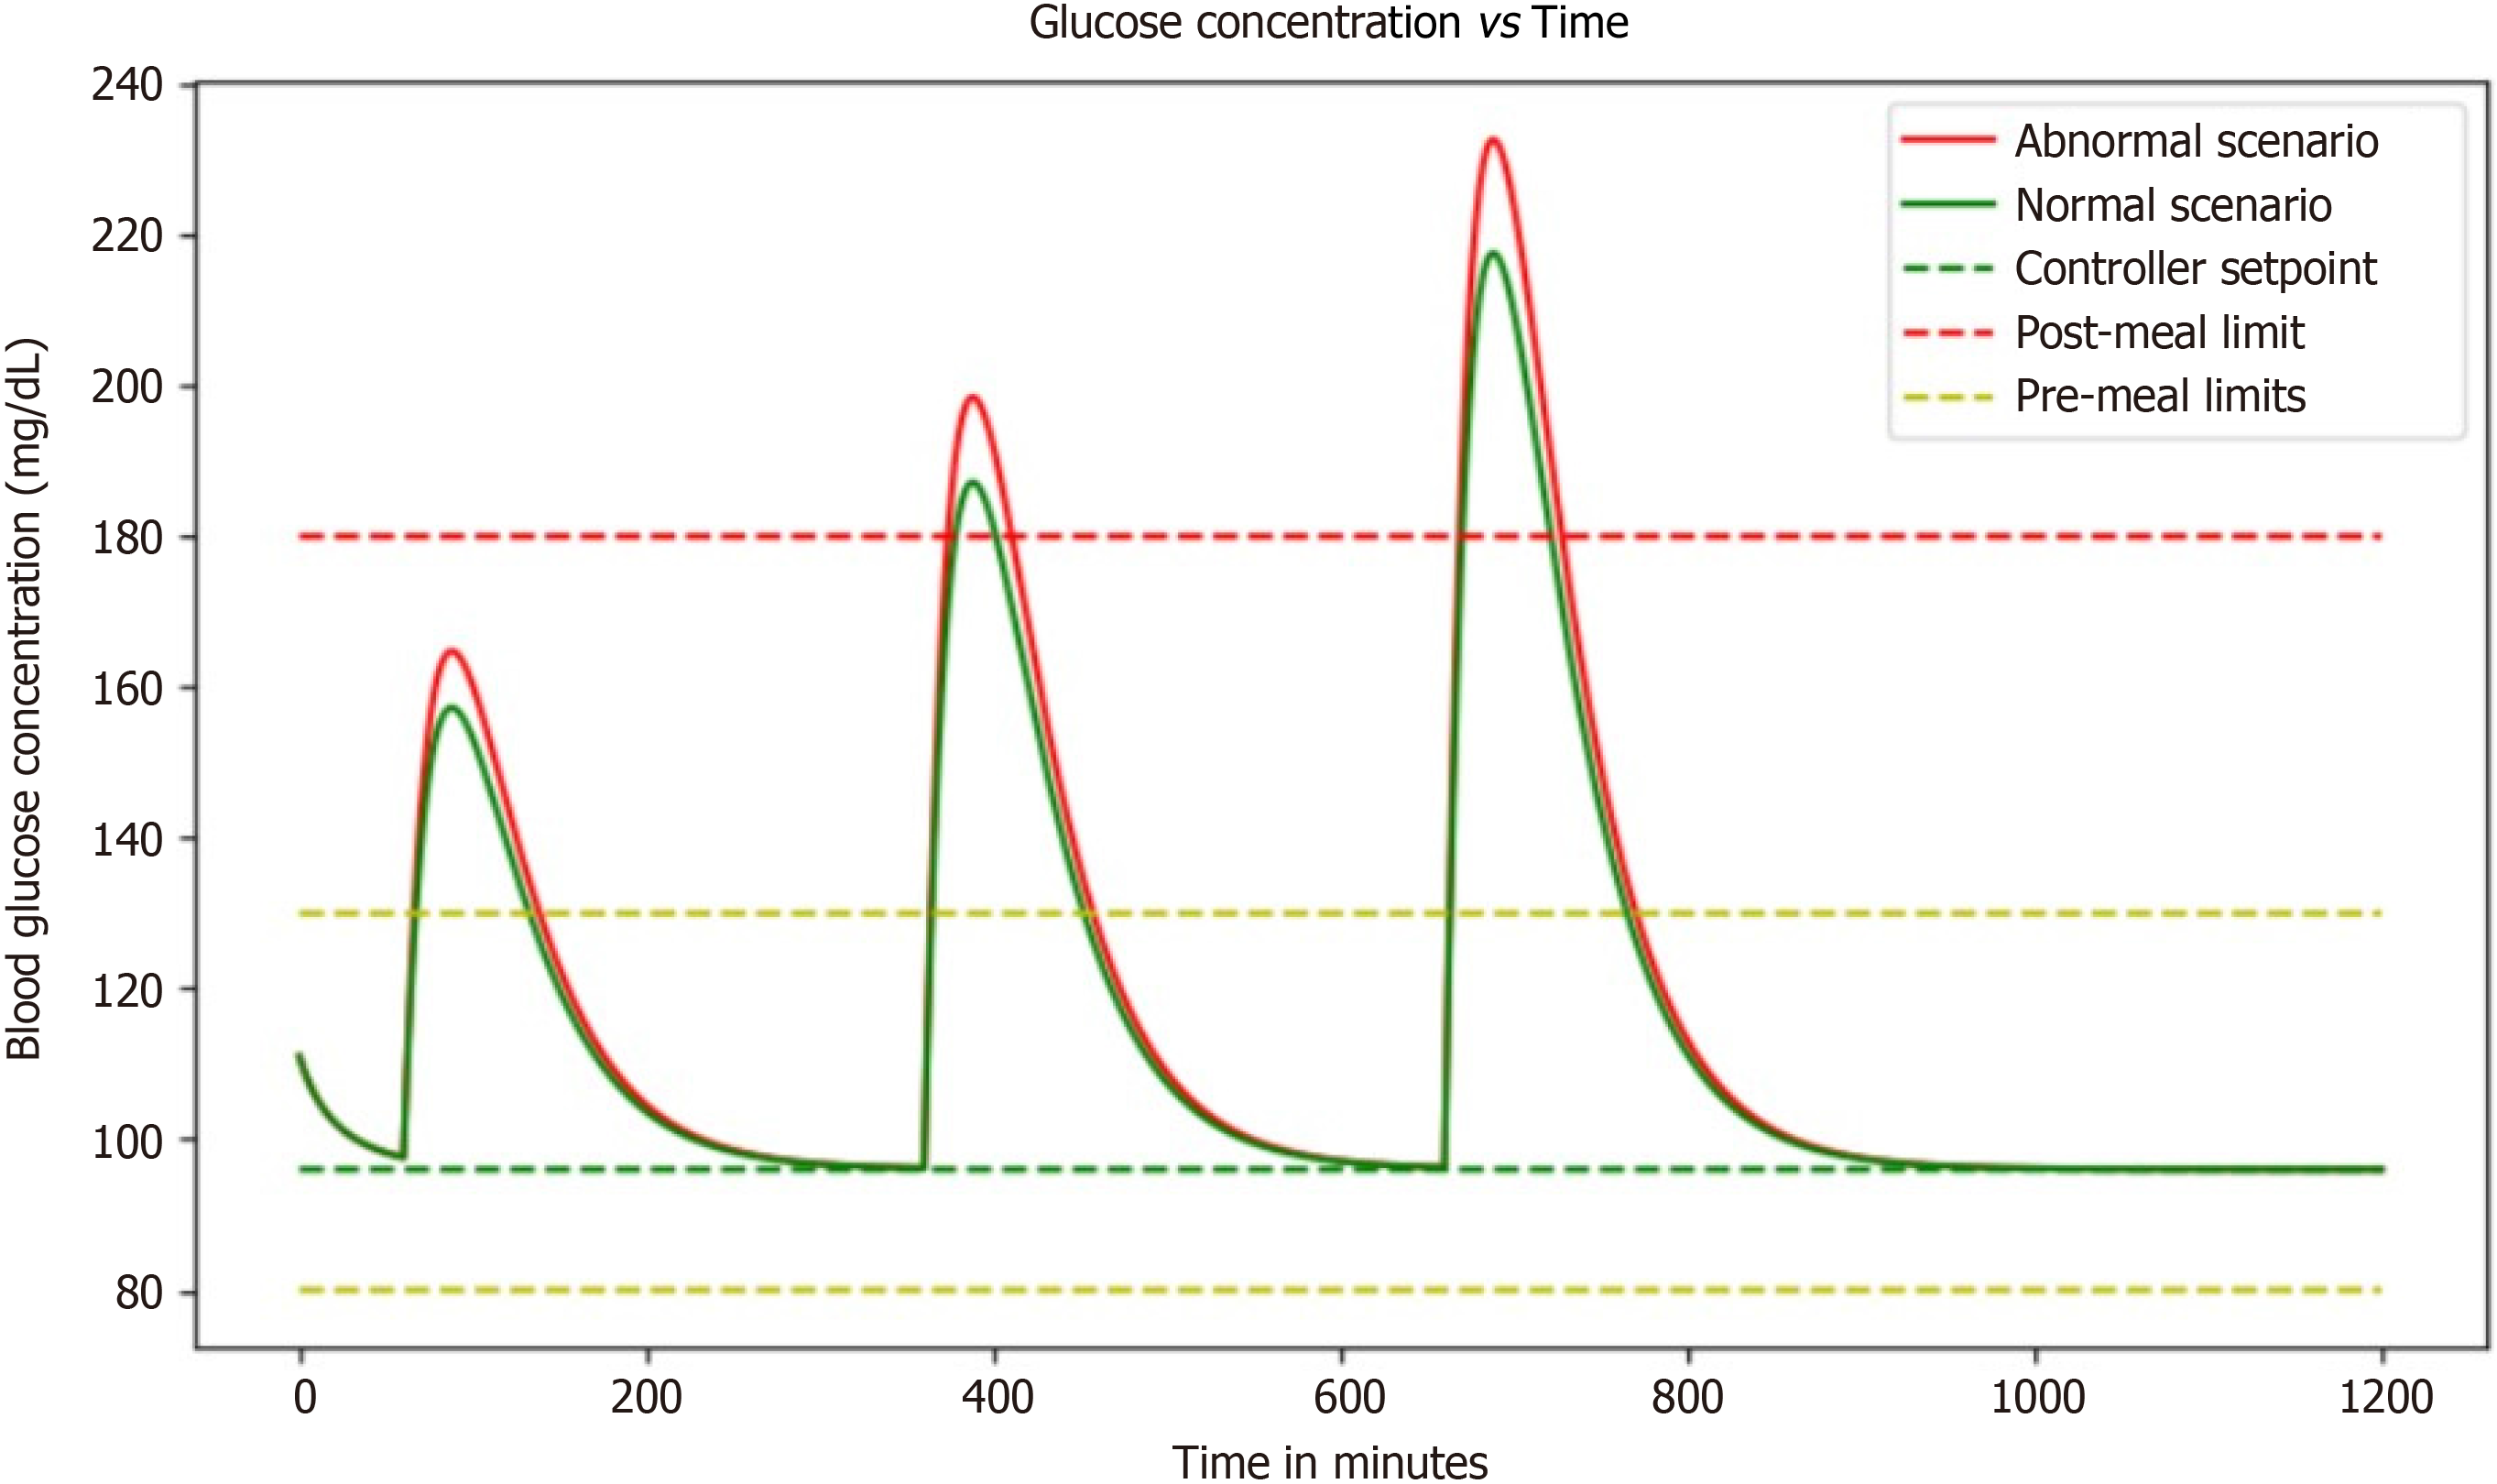
Figure 7 Graph illustrates the dynamic interaction between meal intake and basal insulin dose, showcasing the intricate balance required for optimal glucose control in diabetes management.
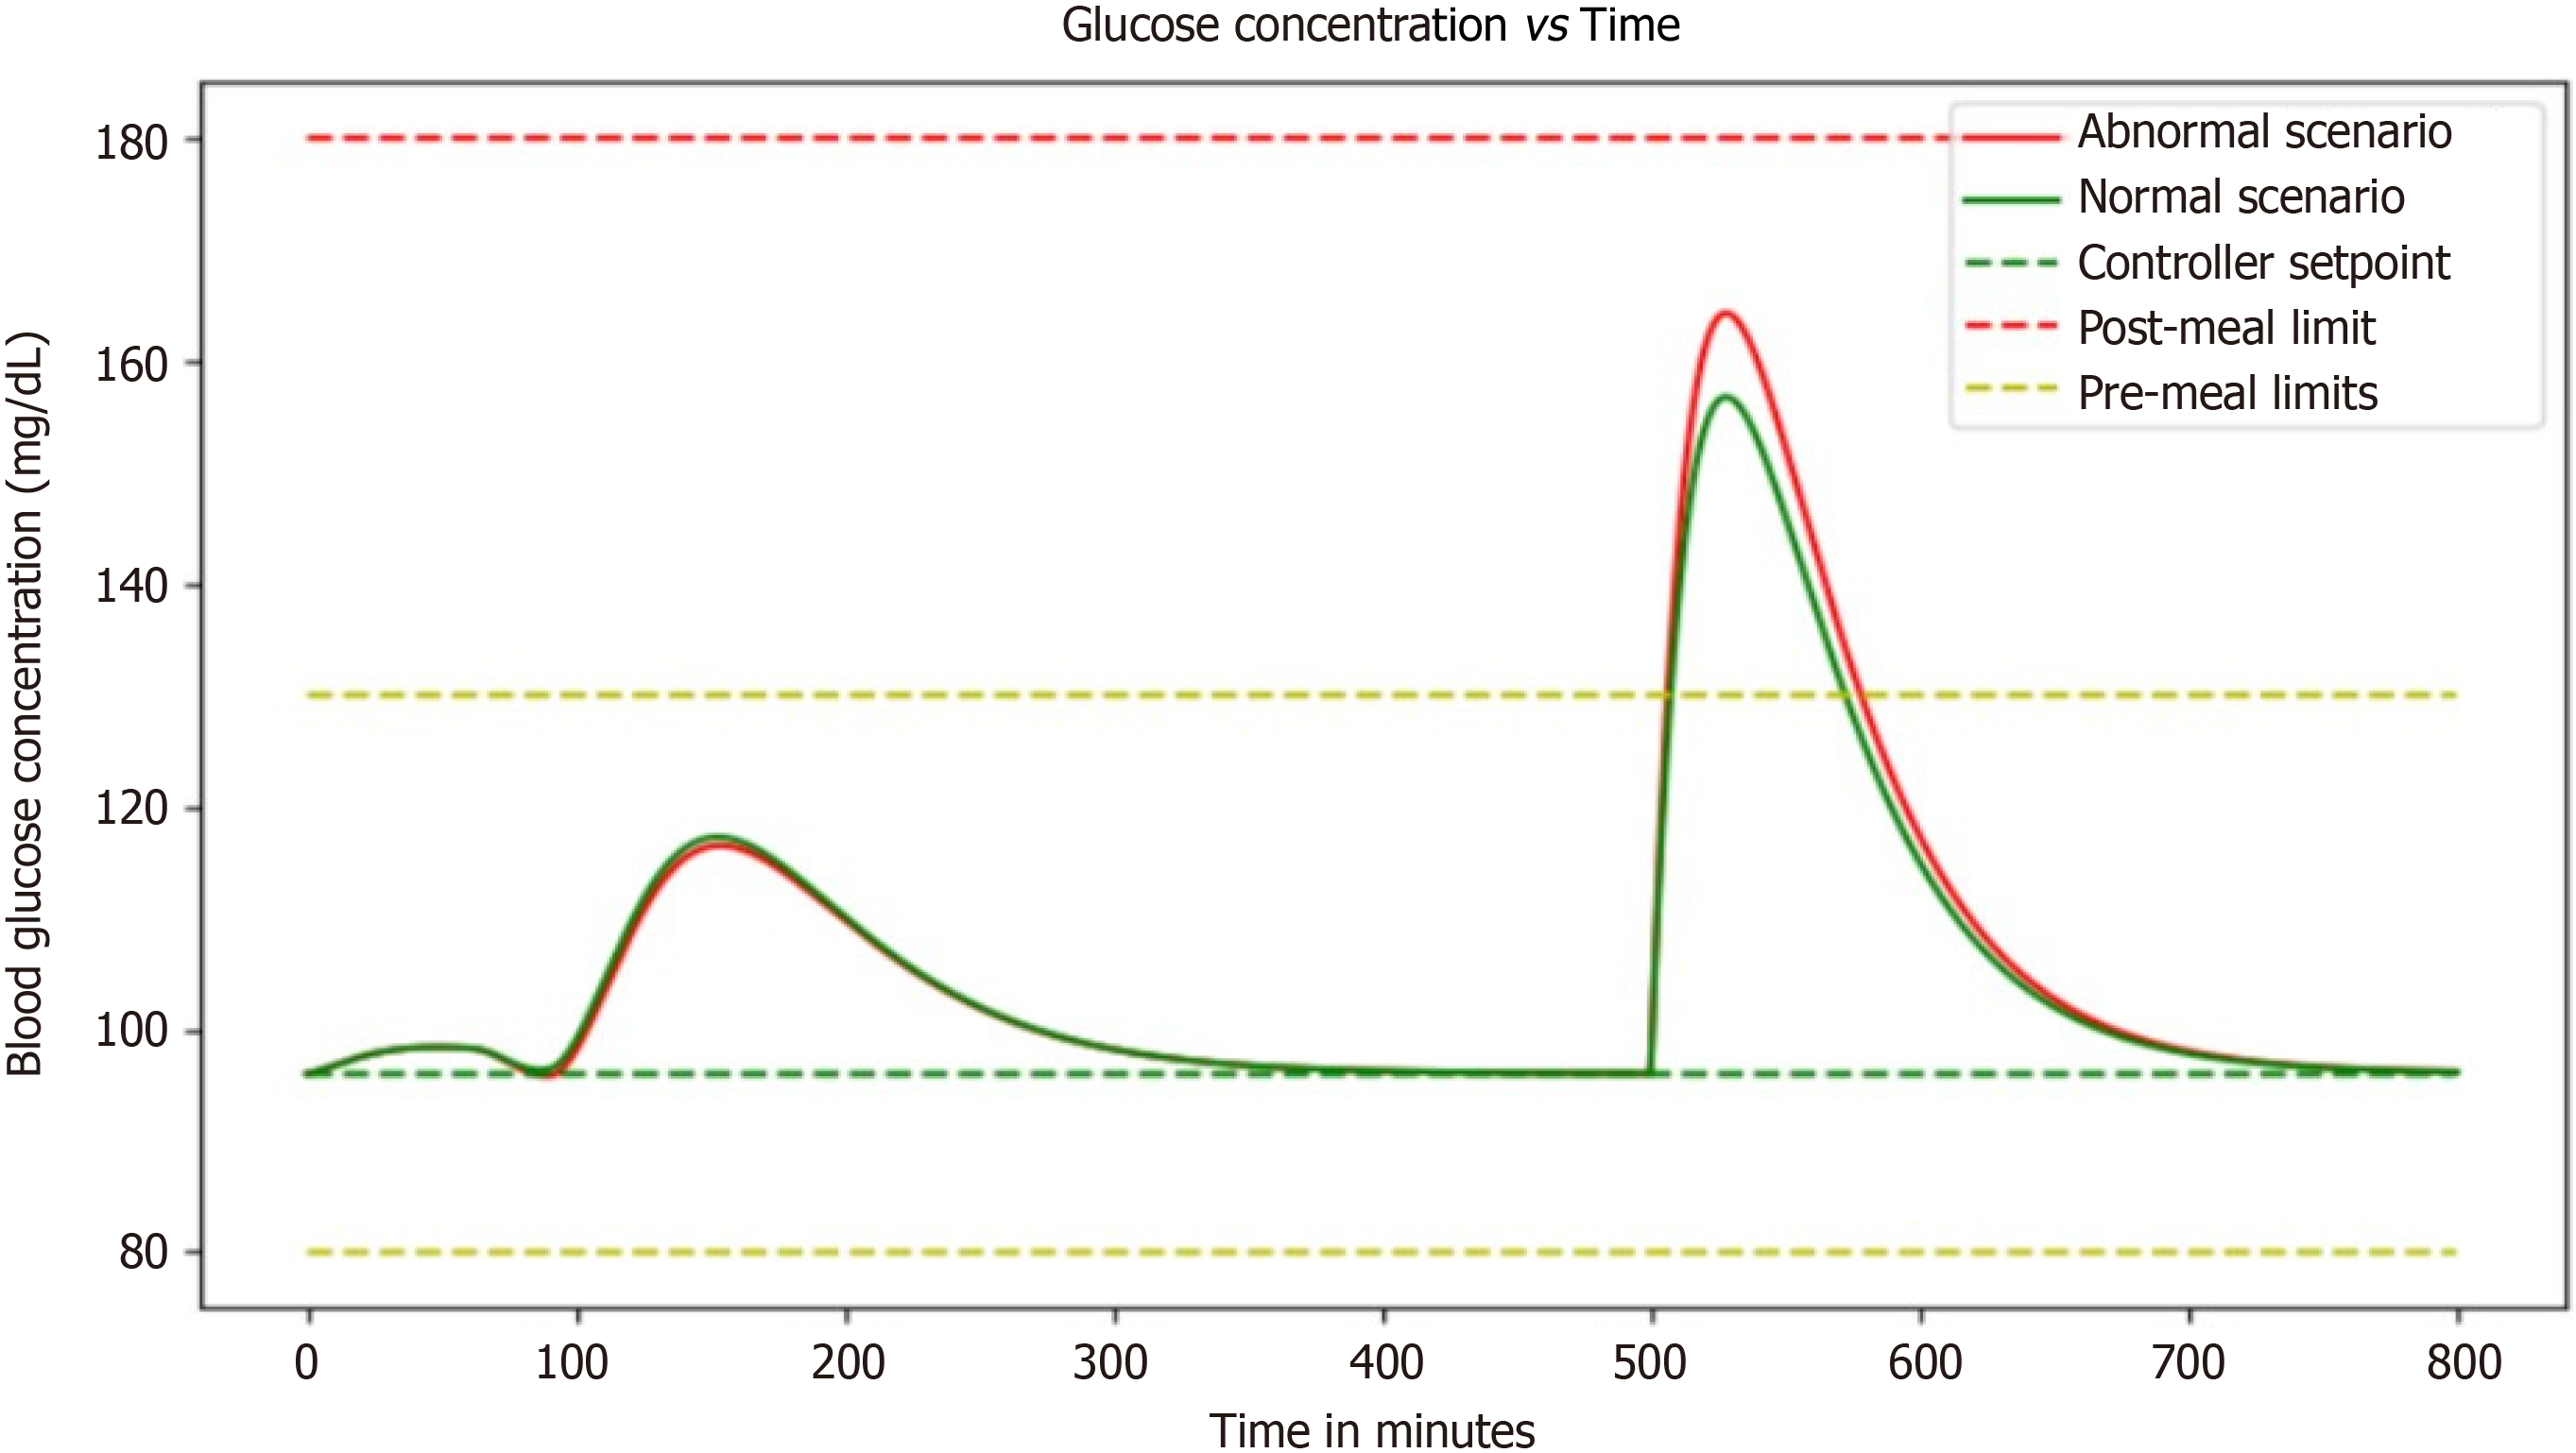
Figure 8 Graph demonstrates the performance of the proportional-integral-derivative controller, showcasing its ability to efficiently regulate a system's output by continuously adjusting the control parameters.
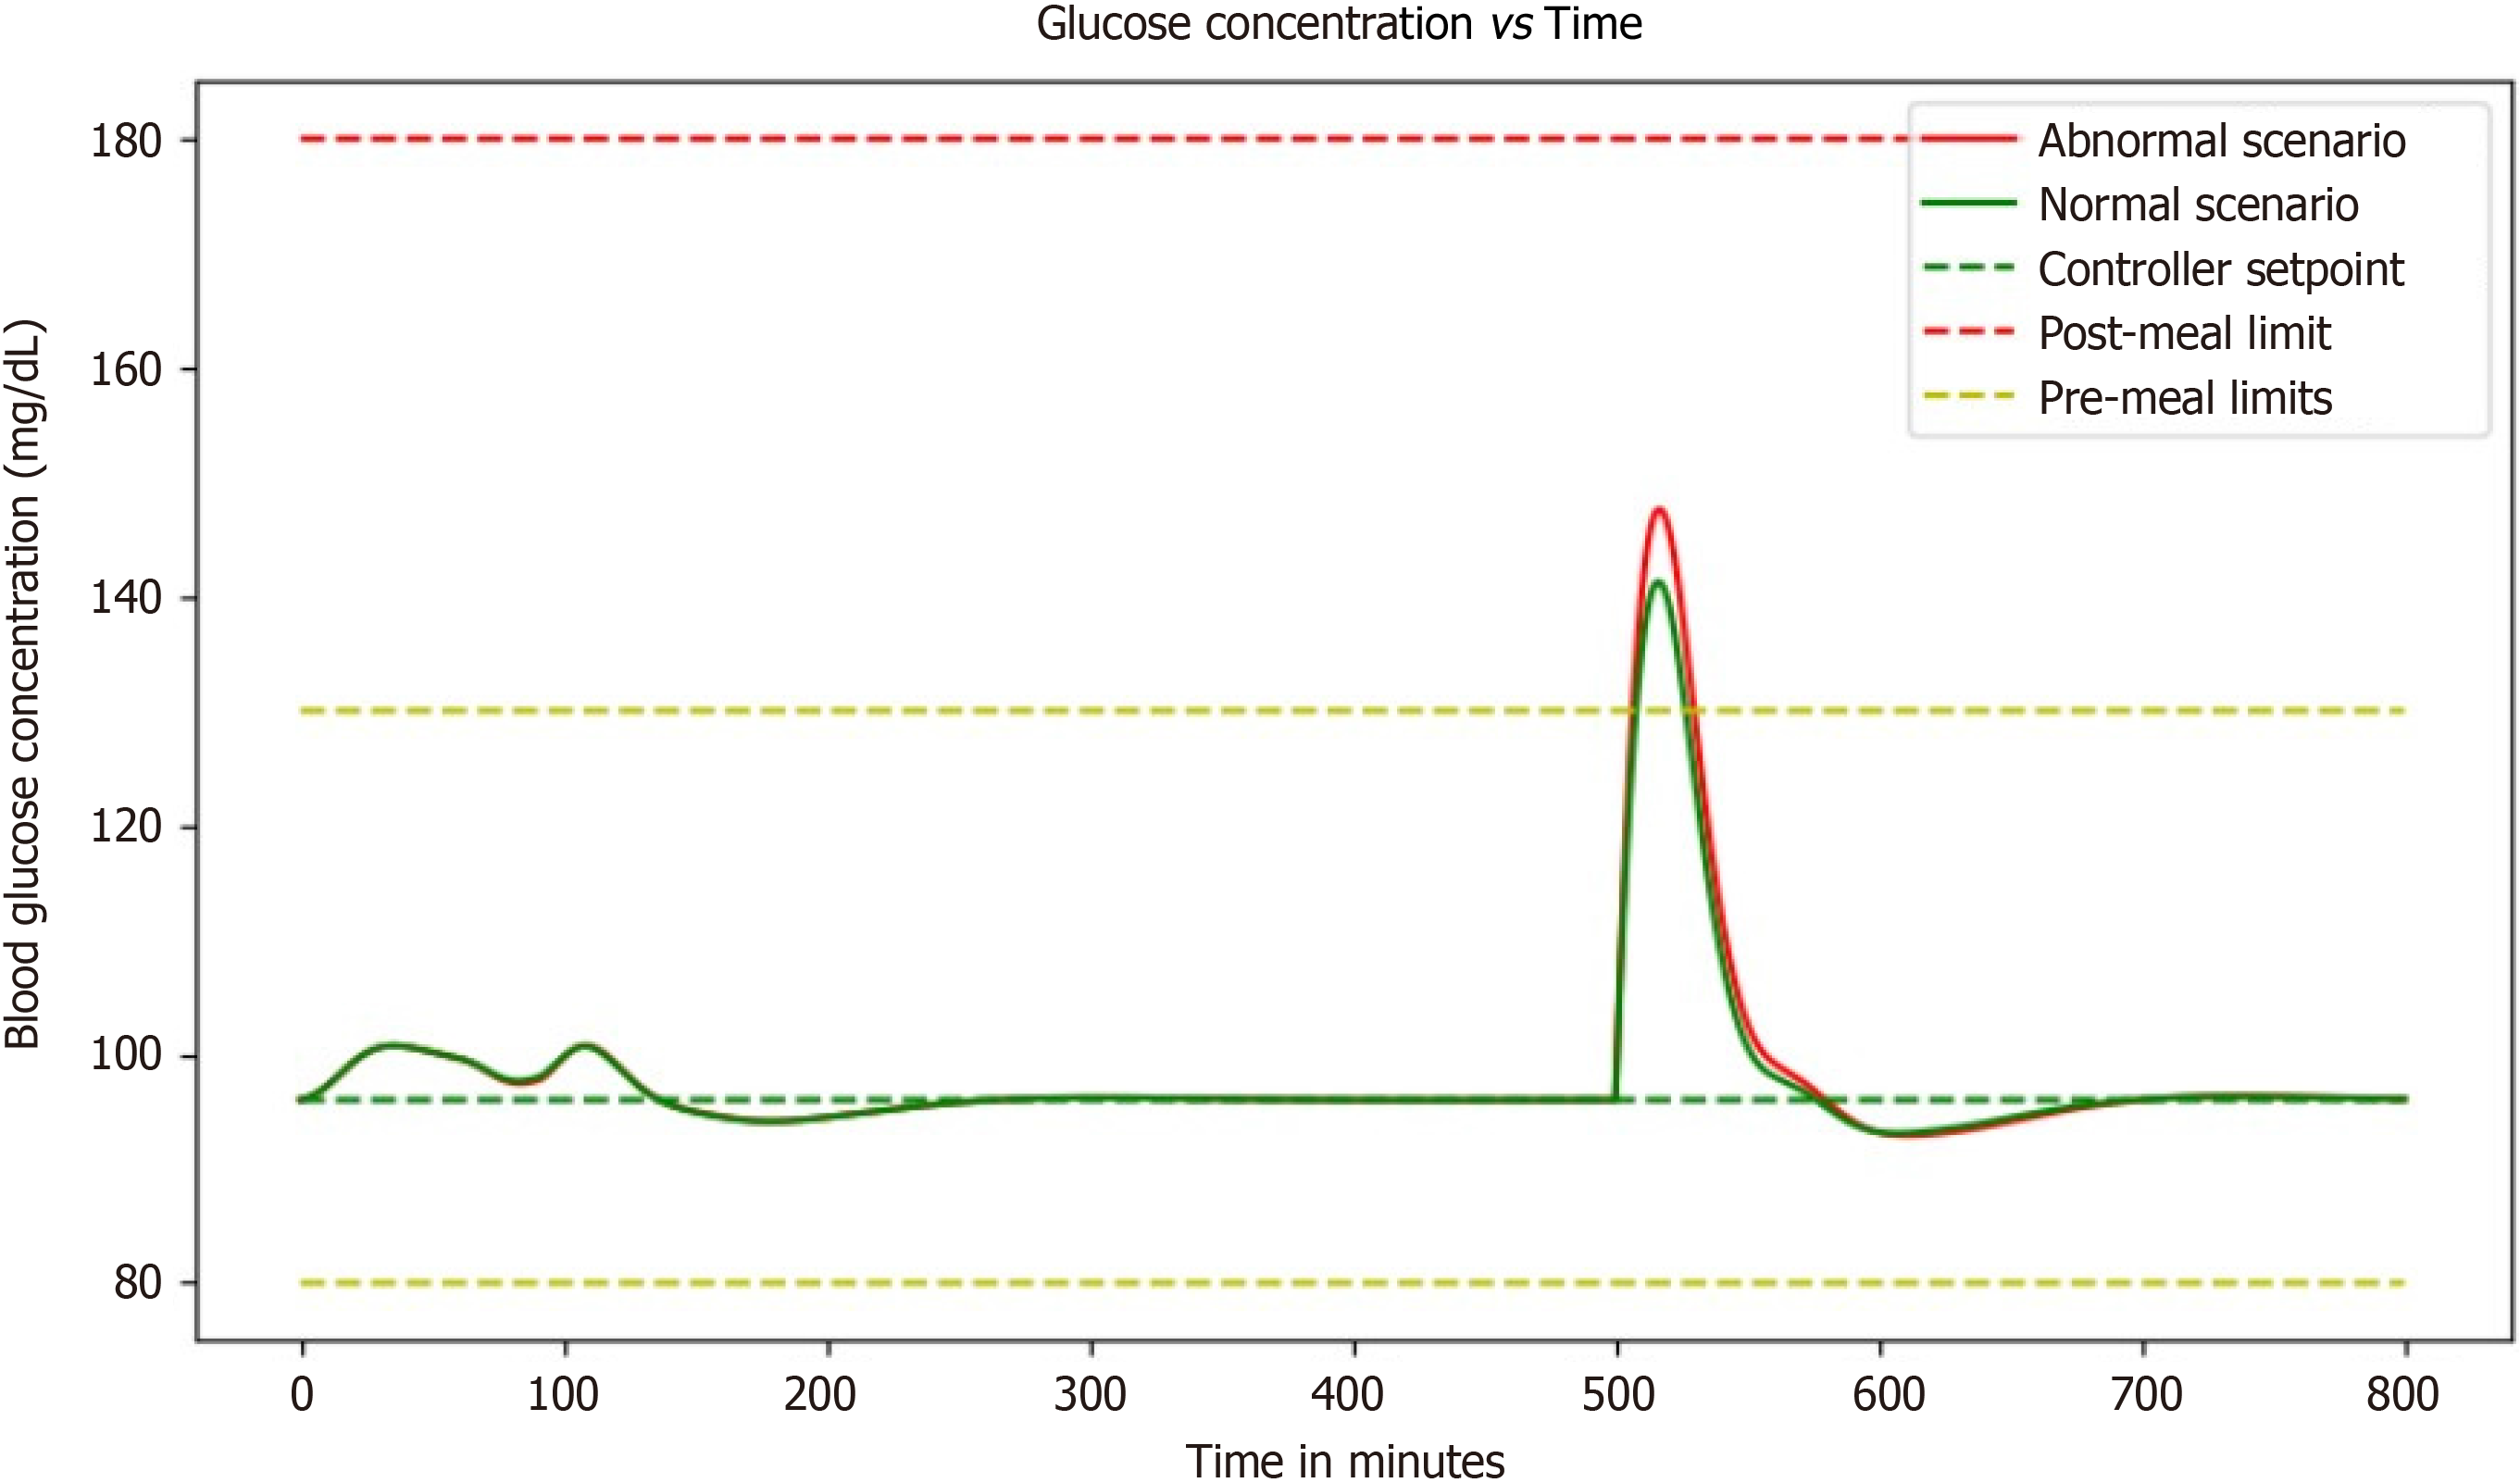
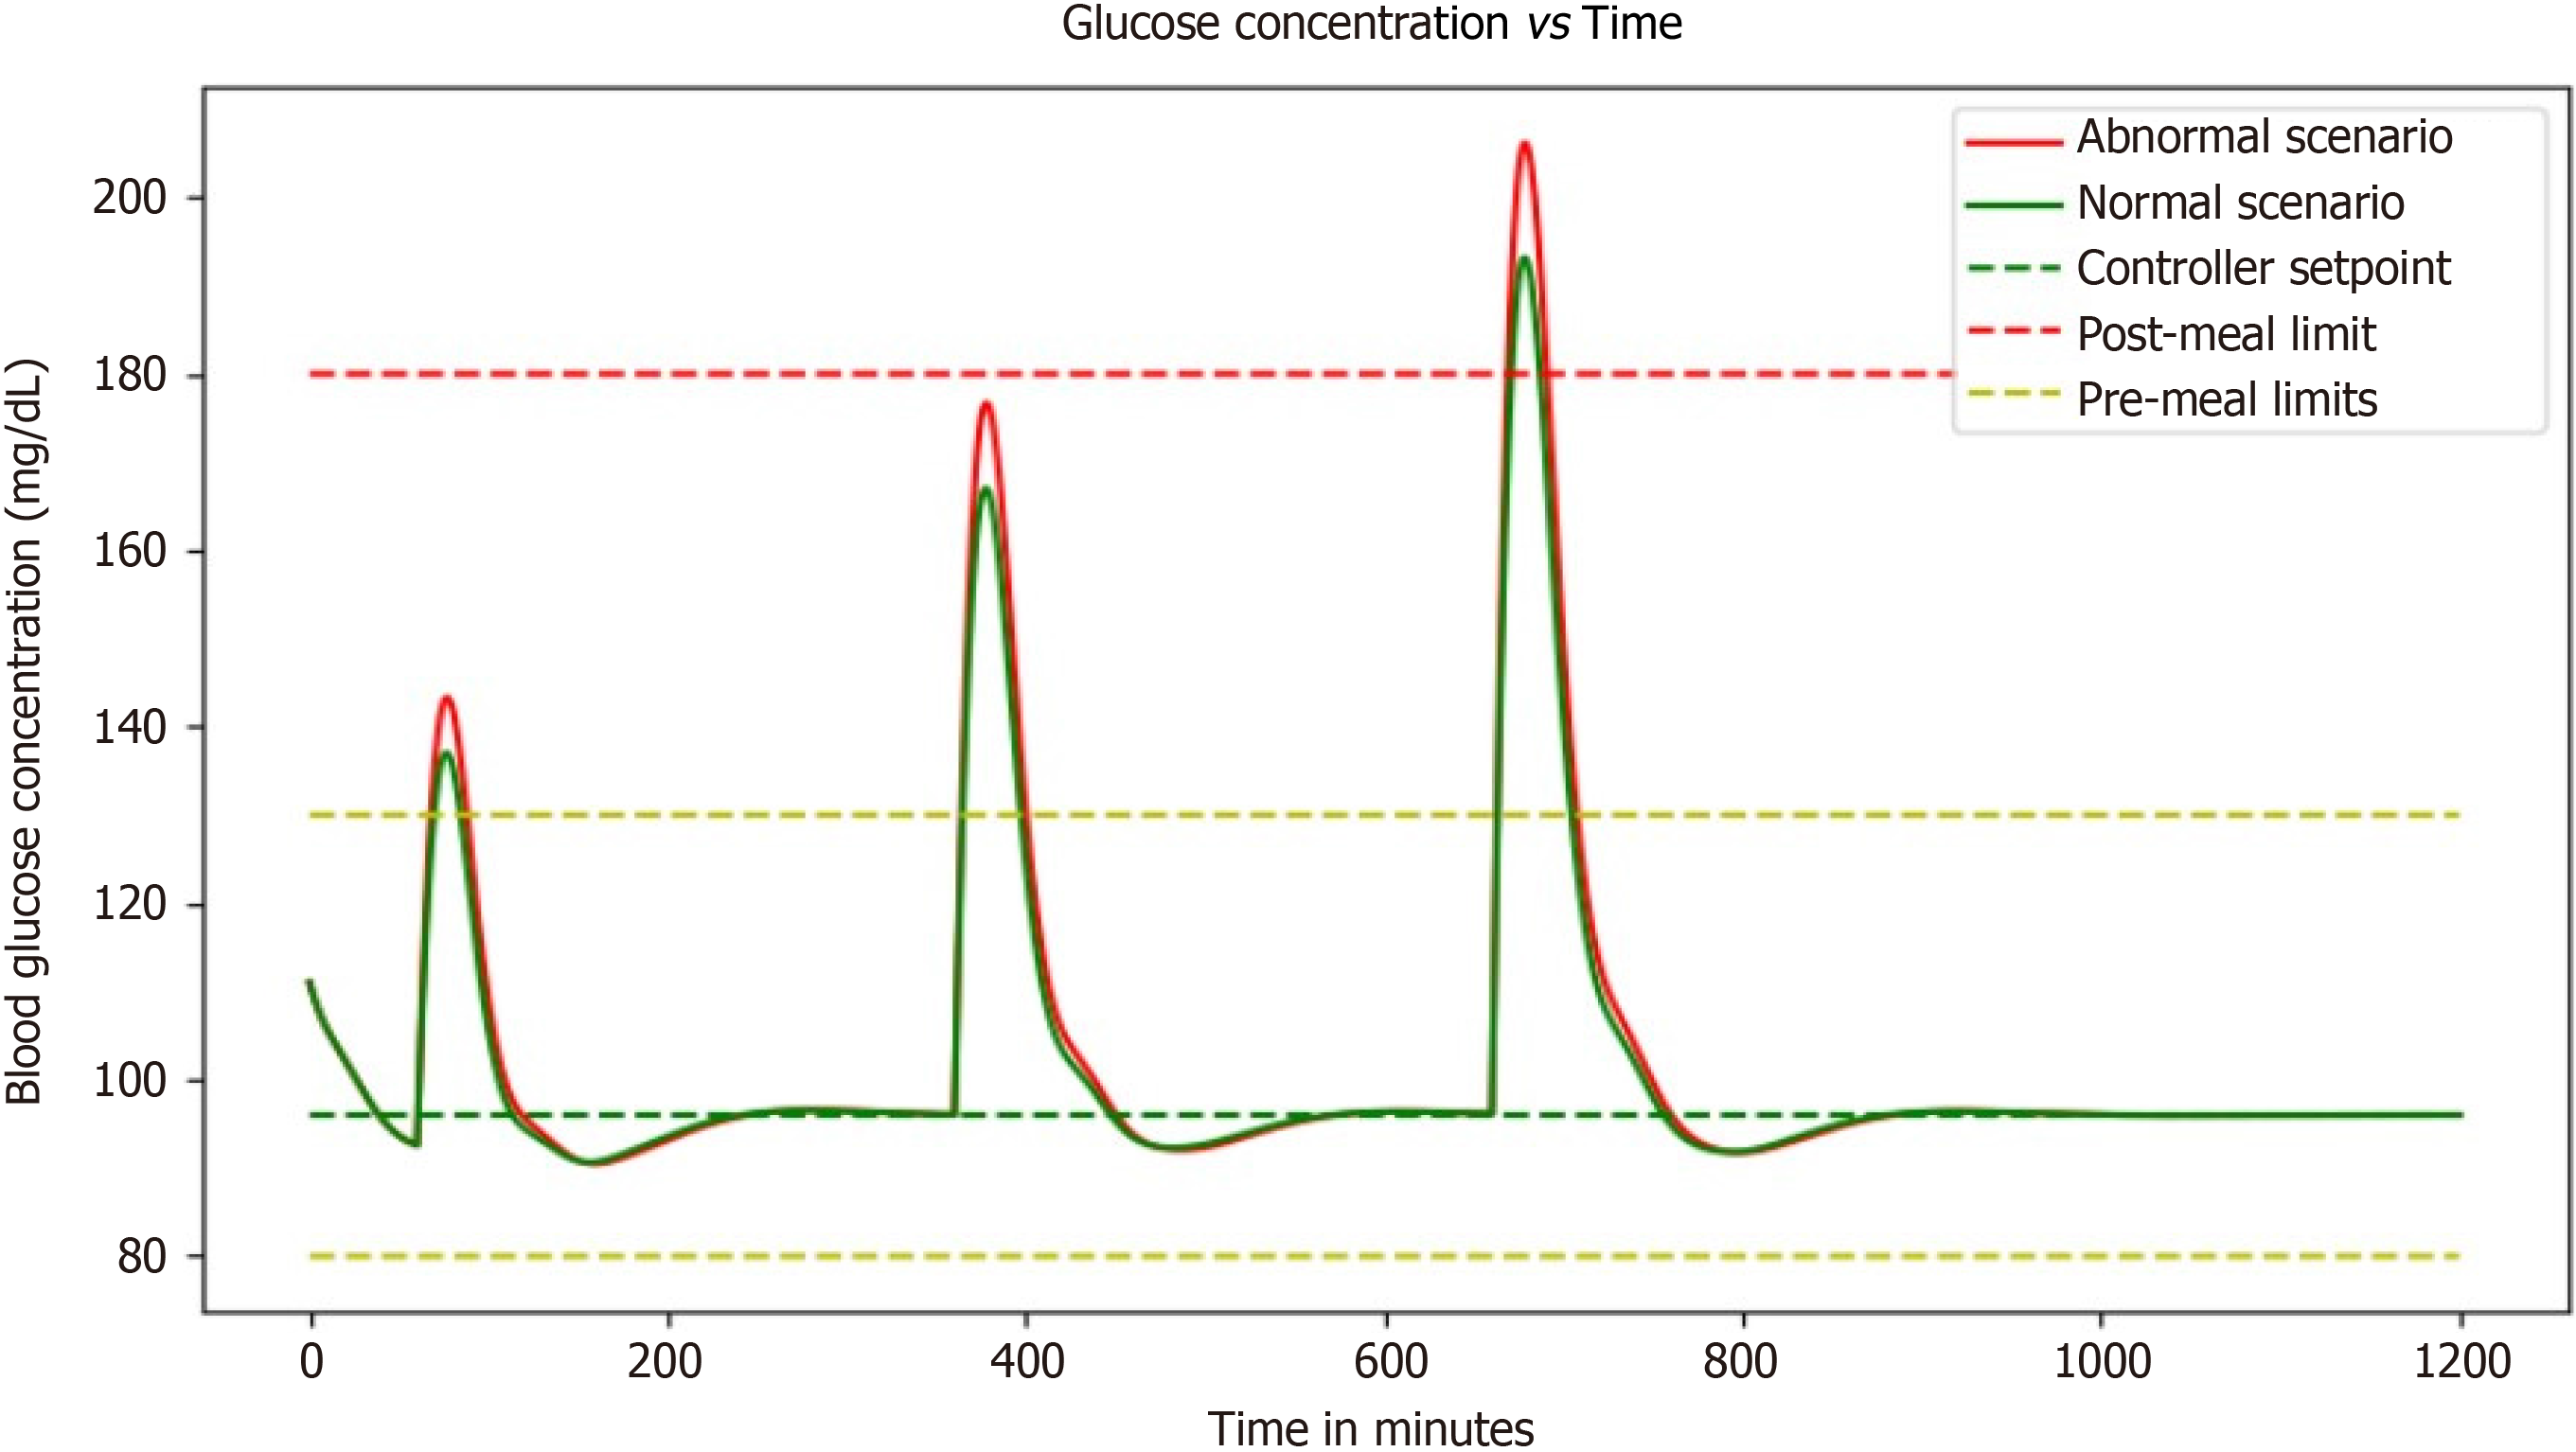
Figure 9 Graph illustrating the combined effect of proportional-integral-derivative controller with basal dose which is measured to evaluate the ability to effectively regulate glucose levels.
- Citation: Medanki S, Dommati N, Bodapati HH, Katru VNSK, Moses G, Komaraju A, Donepudi NS, Yalamanchili D, Sateesh J, Turimerla P. Artificial intelligence powered glucose monitoring and controlling system: Pumping module. World J Exp Med 2024; 14(1): 87916
- URL: https://www.wjgnet.com/2220-315x/full/v14/i1/87916.htm
- DOI: https://dx.doi.org/10.5493/wjem.v14.i1.87916


