Copyright
©The Author(s) 2025.
World J Exp Med. Jun 20, 2025; 15(2): 102175
Published online Jun 20, 2025. doi: 10.5493/wjem.v15.i2.102175
Published online Jun 20, 2025. doi: 10.5493/wjem.v15.i2.102175
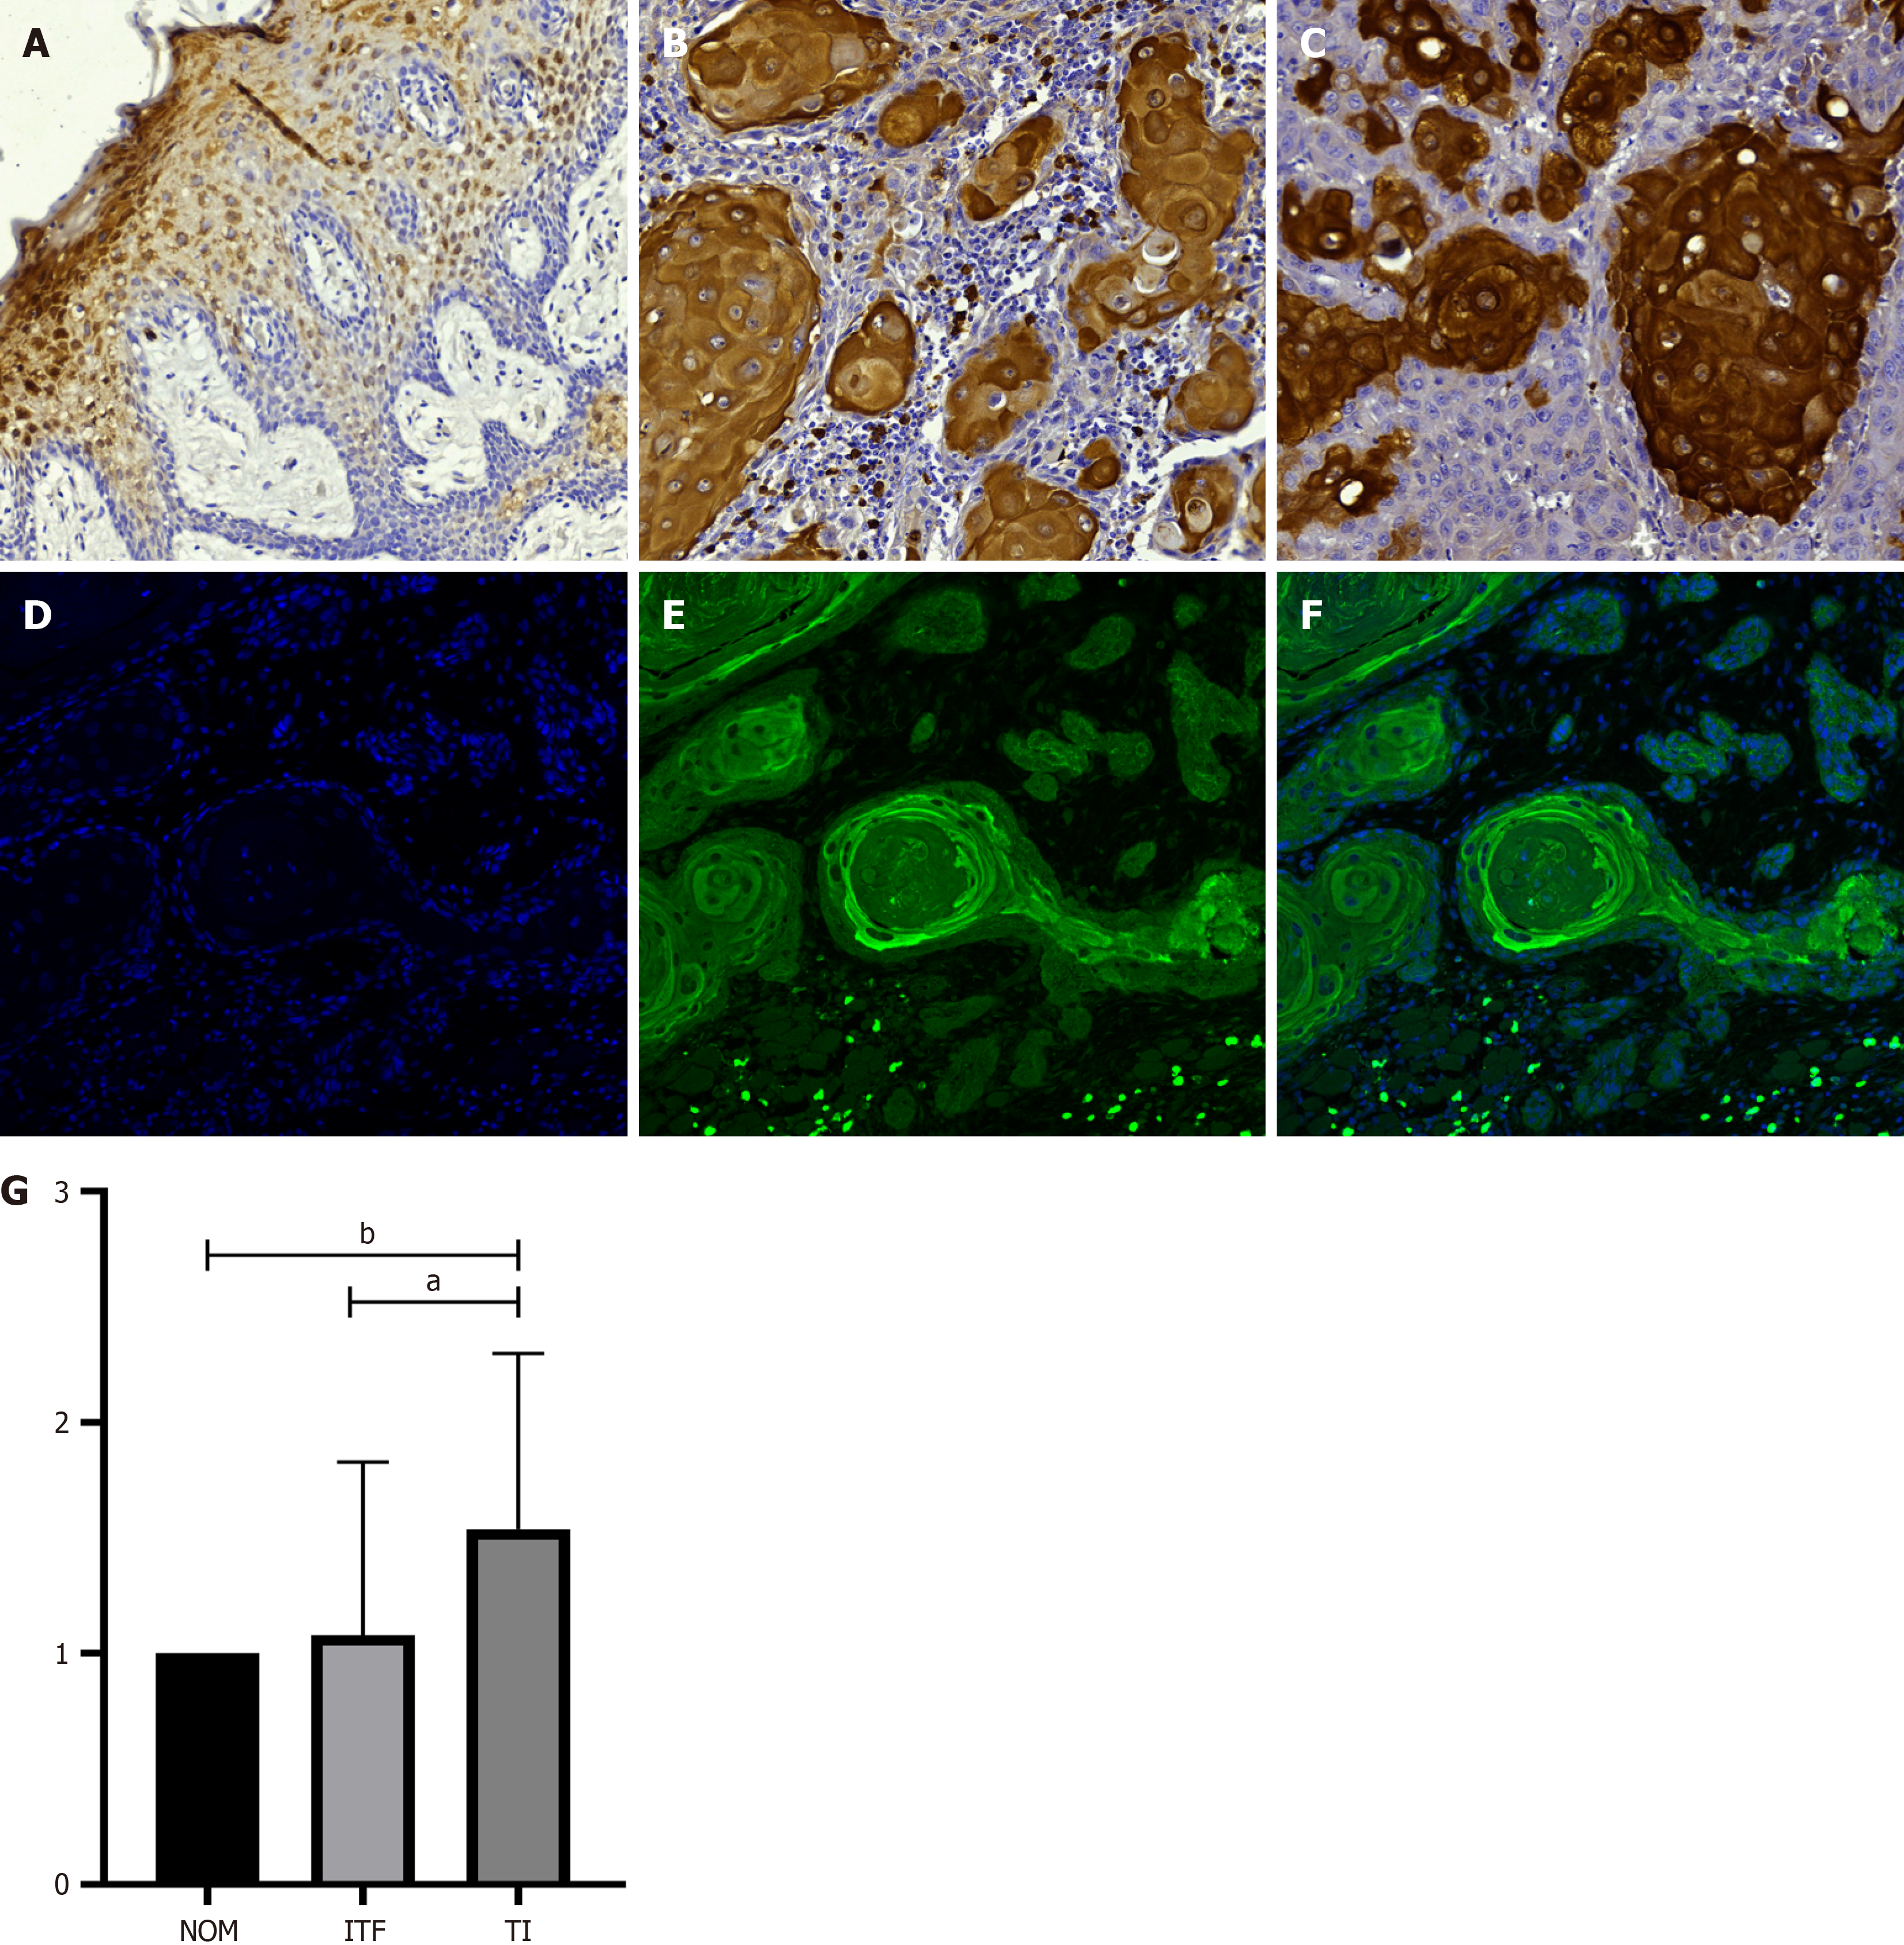
Figure 1 Expression of hypoxia-inducible factor 1-alpha.
A: Immunohistochemical expression of hypoxia-inducible factor 1-alpha (HIF-1α) in the normal oral mucosa (NOM); B: Invasive tumor front (ITF); C: Tumor islands (TI). HIF-1α expression was significantly different between the TI and ITF regions (P = 0.0134). Additionally, a significant difference was observed between TI and NOM (P = 0.0115). (Immunohistochemistry, 20 × magnification); D: DAPI-stained nuclei (blue); E: HIF-1α expression (green); F: Merged image showing HIF-1α localization in both the cytoplasm and nucleus of neoplastic cells (Immunofluorescence, 20 × magnification); G: HIF-1α expression was significantly different between the TI and ITF regions (aP = 0.0134). Additionally, a significant difference was observed between TI and NOM (bP = 0.0115).
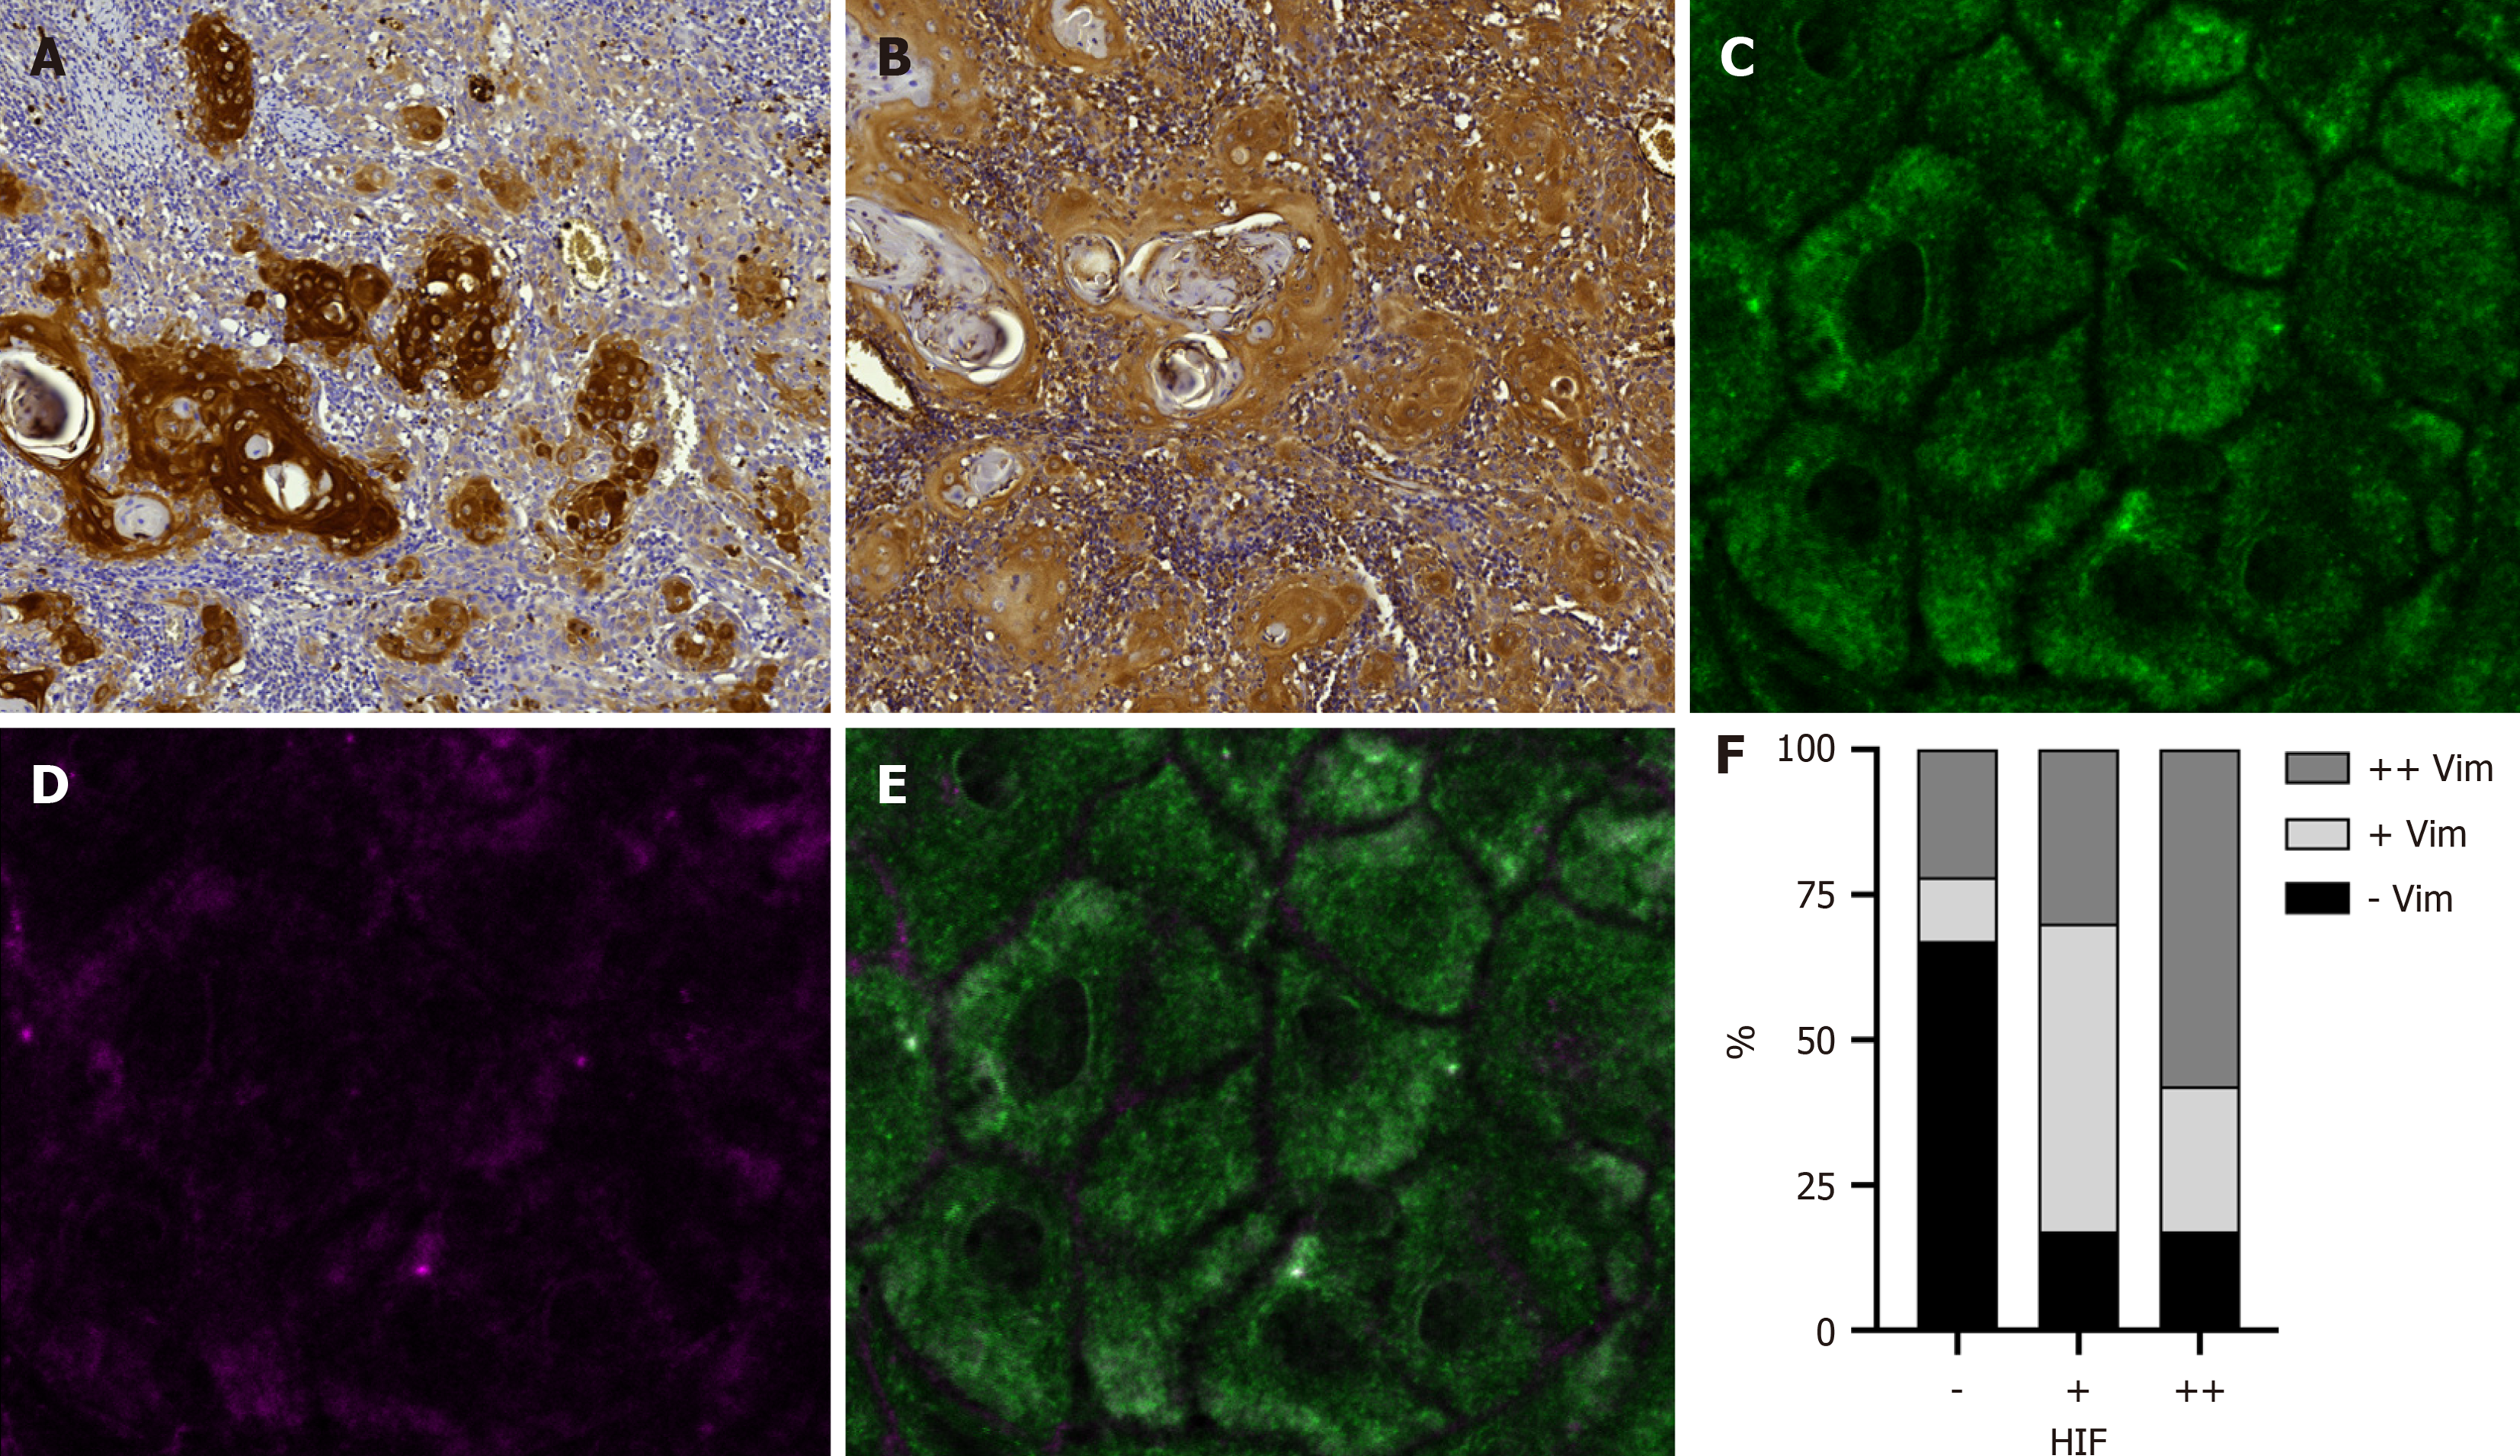
Figure 2 Correlation of hypoxia-inducible factor 1-alpha expression with vimentin expression.
A: Immunohistochemical expression of hypoxia-inducible factor 1-alpha (HIF-1α); B: Vimentin expression, which was significantly correlated with HIF-1α (P = 0.017). (Immunohistochemistry, 20 × magnification); C: HIF-1α expression (green); D: Vimentin expression (magenta); E: Colocalization of HIF-1α and vimentin (white) in images obtained via confocal microscopy (Immunofluorescence, 63 × magnification); F: Vimentin expression was significantly correlated with HIF-1α (P = 0.017).
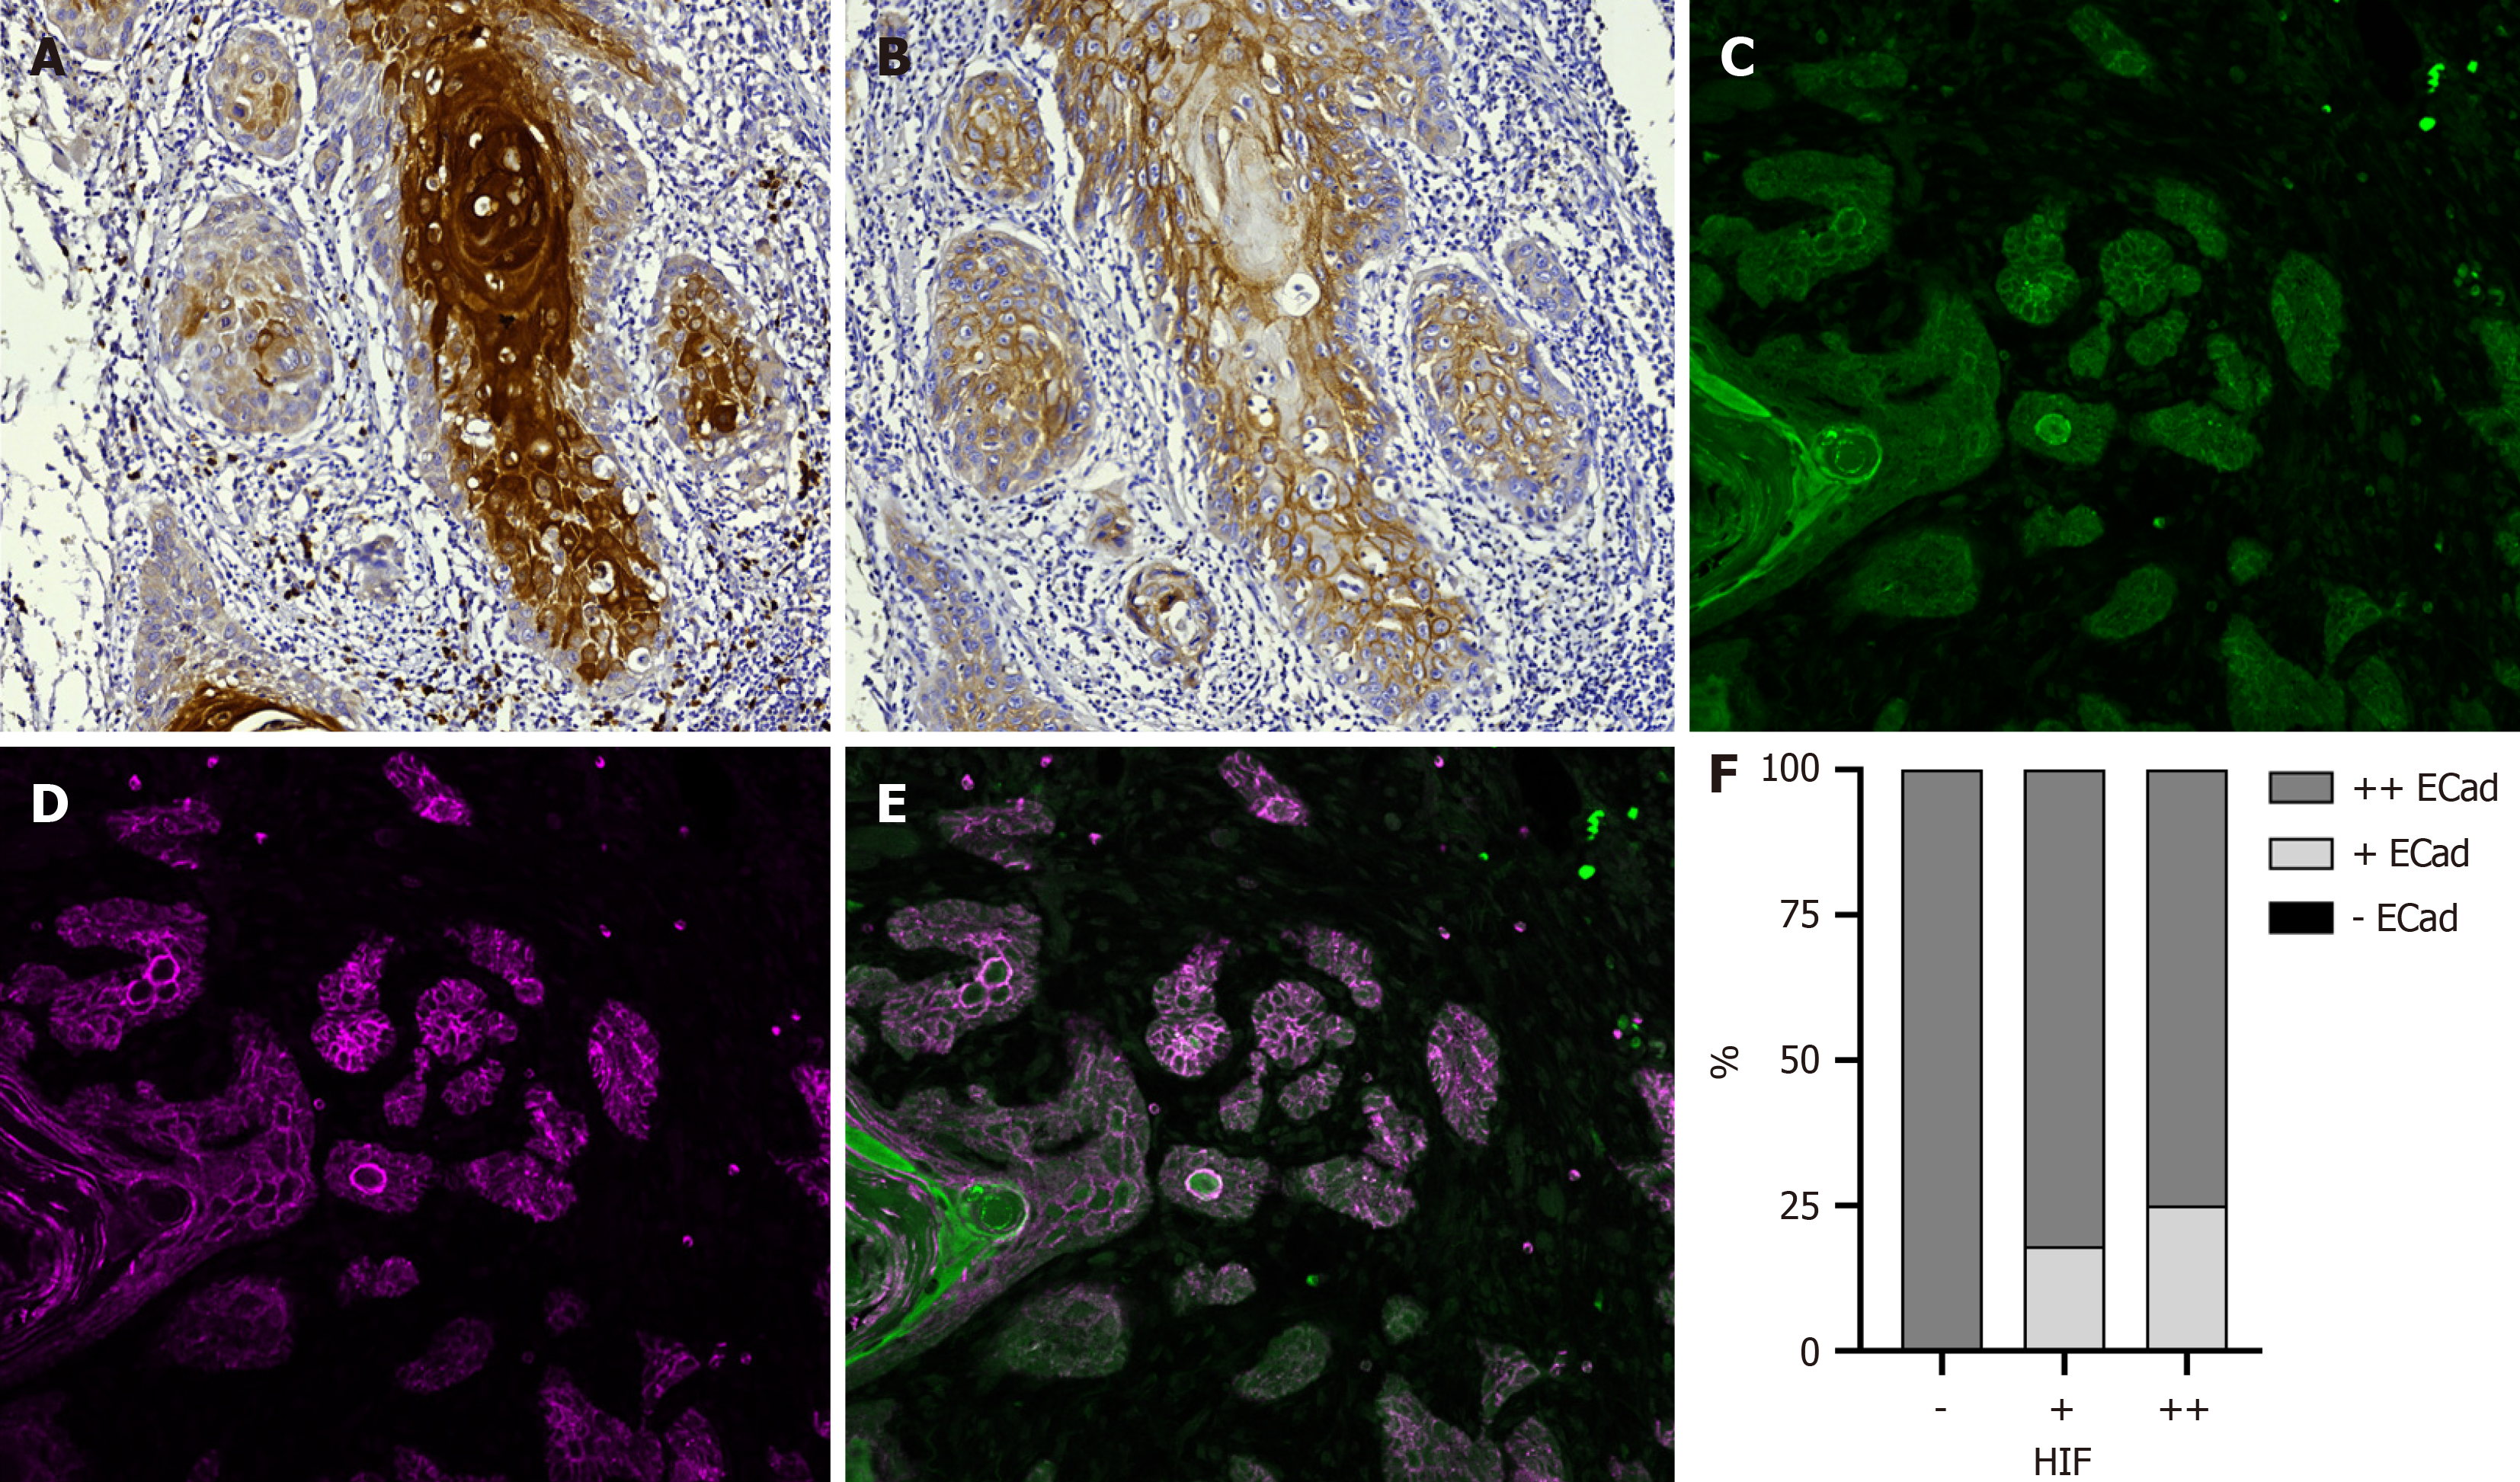
Figure 3 Correlation of hypoxia-inducible factor 1-alpha expression with E-cadherin expression.
A: Immunohistochemical expression of hypoxia-inducible factor 1-alpha (HIF-1α); B: E-cadherin expression. No significant correlation was found between HIF-1α and E-cadherin expression (P = 0.287). (Immunohistochemistry, 9 × magnification); C: HIF-1α expression (green); D: E-cadherin expression (magenta); E: Colocalization of HIF-1α and E-cadherin (white) in images obtained via confocal microscopy (Immunofluorescence, 20 × magnification); F: No significant correlation was found between HIF-1α and E-cadherin expression (P = 0.287).
- Citation: Silveira FM, Schuch LF, Pereira-Prado V, Molina-Frechero N, Lopez-Verdin S, Gómez Palacio-Gastélum M, Arocena M, Niklander S, Sicco E, Bologna-Molina R. Hypoxia-inducible factor-1α at the invasive tumor front in oral squamous cell carcinoma. World J Exp Med 2025; 15(2): 102175
- URL: https://www.wjgnet.com/2220-315x/full/v15/i2/102175.htm
- DOI: https://dx.doi.org/10.5493/wjem.v15.i2.102175


