Copyright
©The Author(s) 2015.
World J Crit Care Med. May 4, 2015; 4(2): 116-129
Published online May 4, 2015. doi: 10.5492/wjccm.v4.i2.116
Published online May 4, 2015. doi: 10.5492/wjccm.v4.i2.116
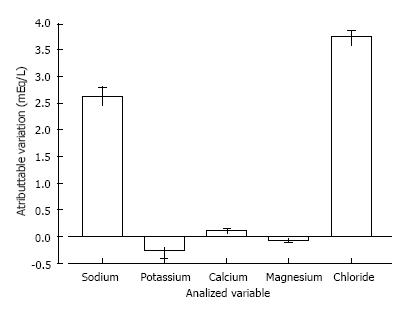
Figure 1 Variation of plasma electrolytes concentration immediately after 2000 ± 300 mL infusion of 0.
9% saline in septic patients. Adapted from Park et al[30].
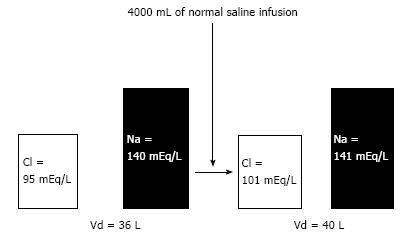
Figure 2 A monocompartimental model of intravascular 0.
9% saline infusion, simulating the extracellular volume modification. To the initial distribution volume (Vd) = 36 L (approximately 60% of body mass of 60 kg), the total AMMOUNT of Cl- and Na+ were 3420 and 5040 mEq respectively. The infusion of 4000 mL of 0.9% saline results in additional 616 mEq of Cl- and Na+ to the total QUANTITY of extracellular electrolytes, that is, 4036 and 5656 mEq of Cl- and Na+ respectively. The new total AMMOUNT of electrolytes are distributed in a new Vd of 40 (36 + 4) liters, resulting in the new concentrations, where the chloride elevation was more striking than the sodium elevation.
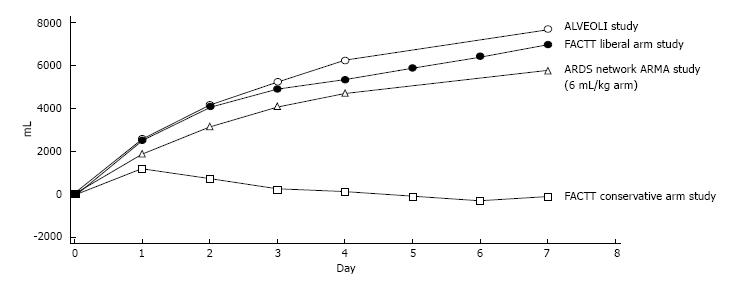
Figure 3 Cumulative fluid balances of the acute respiratory distress syndrome network group studies.
The FACTT conservative fluid strategy arm returned to the neutral fluid balance within the first three days after randomization. The former strategy did not result in better survival, however patients were ventilated for less time and spent less time in the ICU in the conservative group. Adapted from Wiedemann et al[11]. ARDS: Acute respiratory distress syndrome; ICU: Intensive care unit.
- Citation: Besen BAMP, Gobatto ALN, Melro LMG, Maciel AT, Park M. Fluid and electrolyte overload in critically ill patients: An overview. World J Crit Care Med 2015; 4(2): 116-129
- URL: https://www.wjgnet.com/2220-3141/full/v4/i2/116.htm
- DOI: https://dx.doi.org/10.5492/wjccm.v4.i2.116


