Copyright
©The Author(s) 2023.
World J Crit Care Med. Jun 9, 2023; 12(3): 116-129
Published online Jun 9, 2023. doi: 10.5492/wjccm.v12.i3.116
Published online Jun 9, 2023. doi: 10.5492/wjccm.v12.i3.116
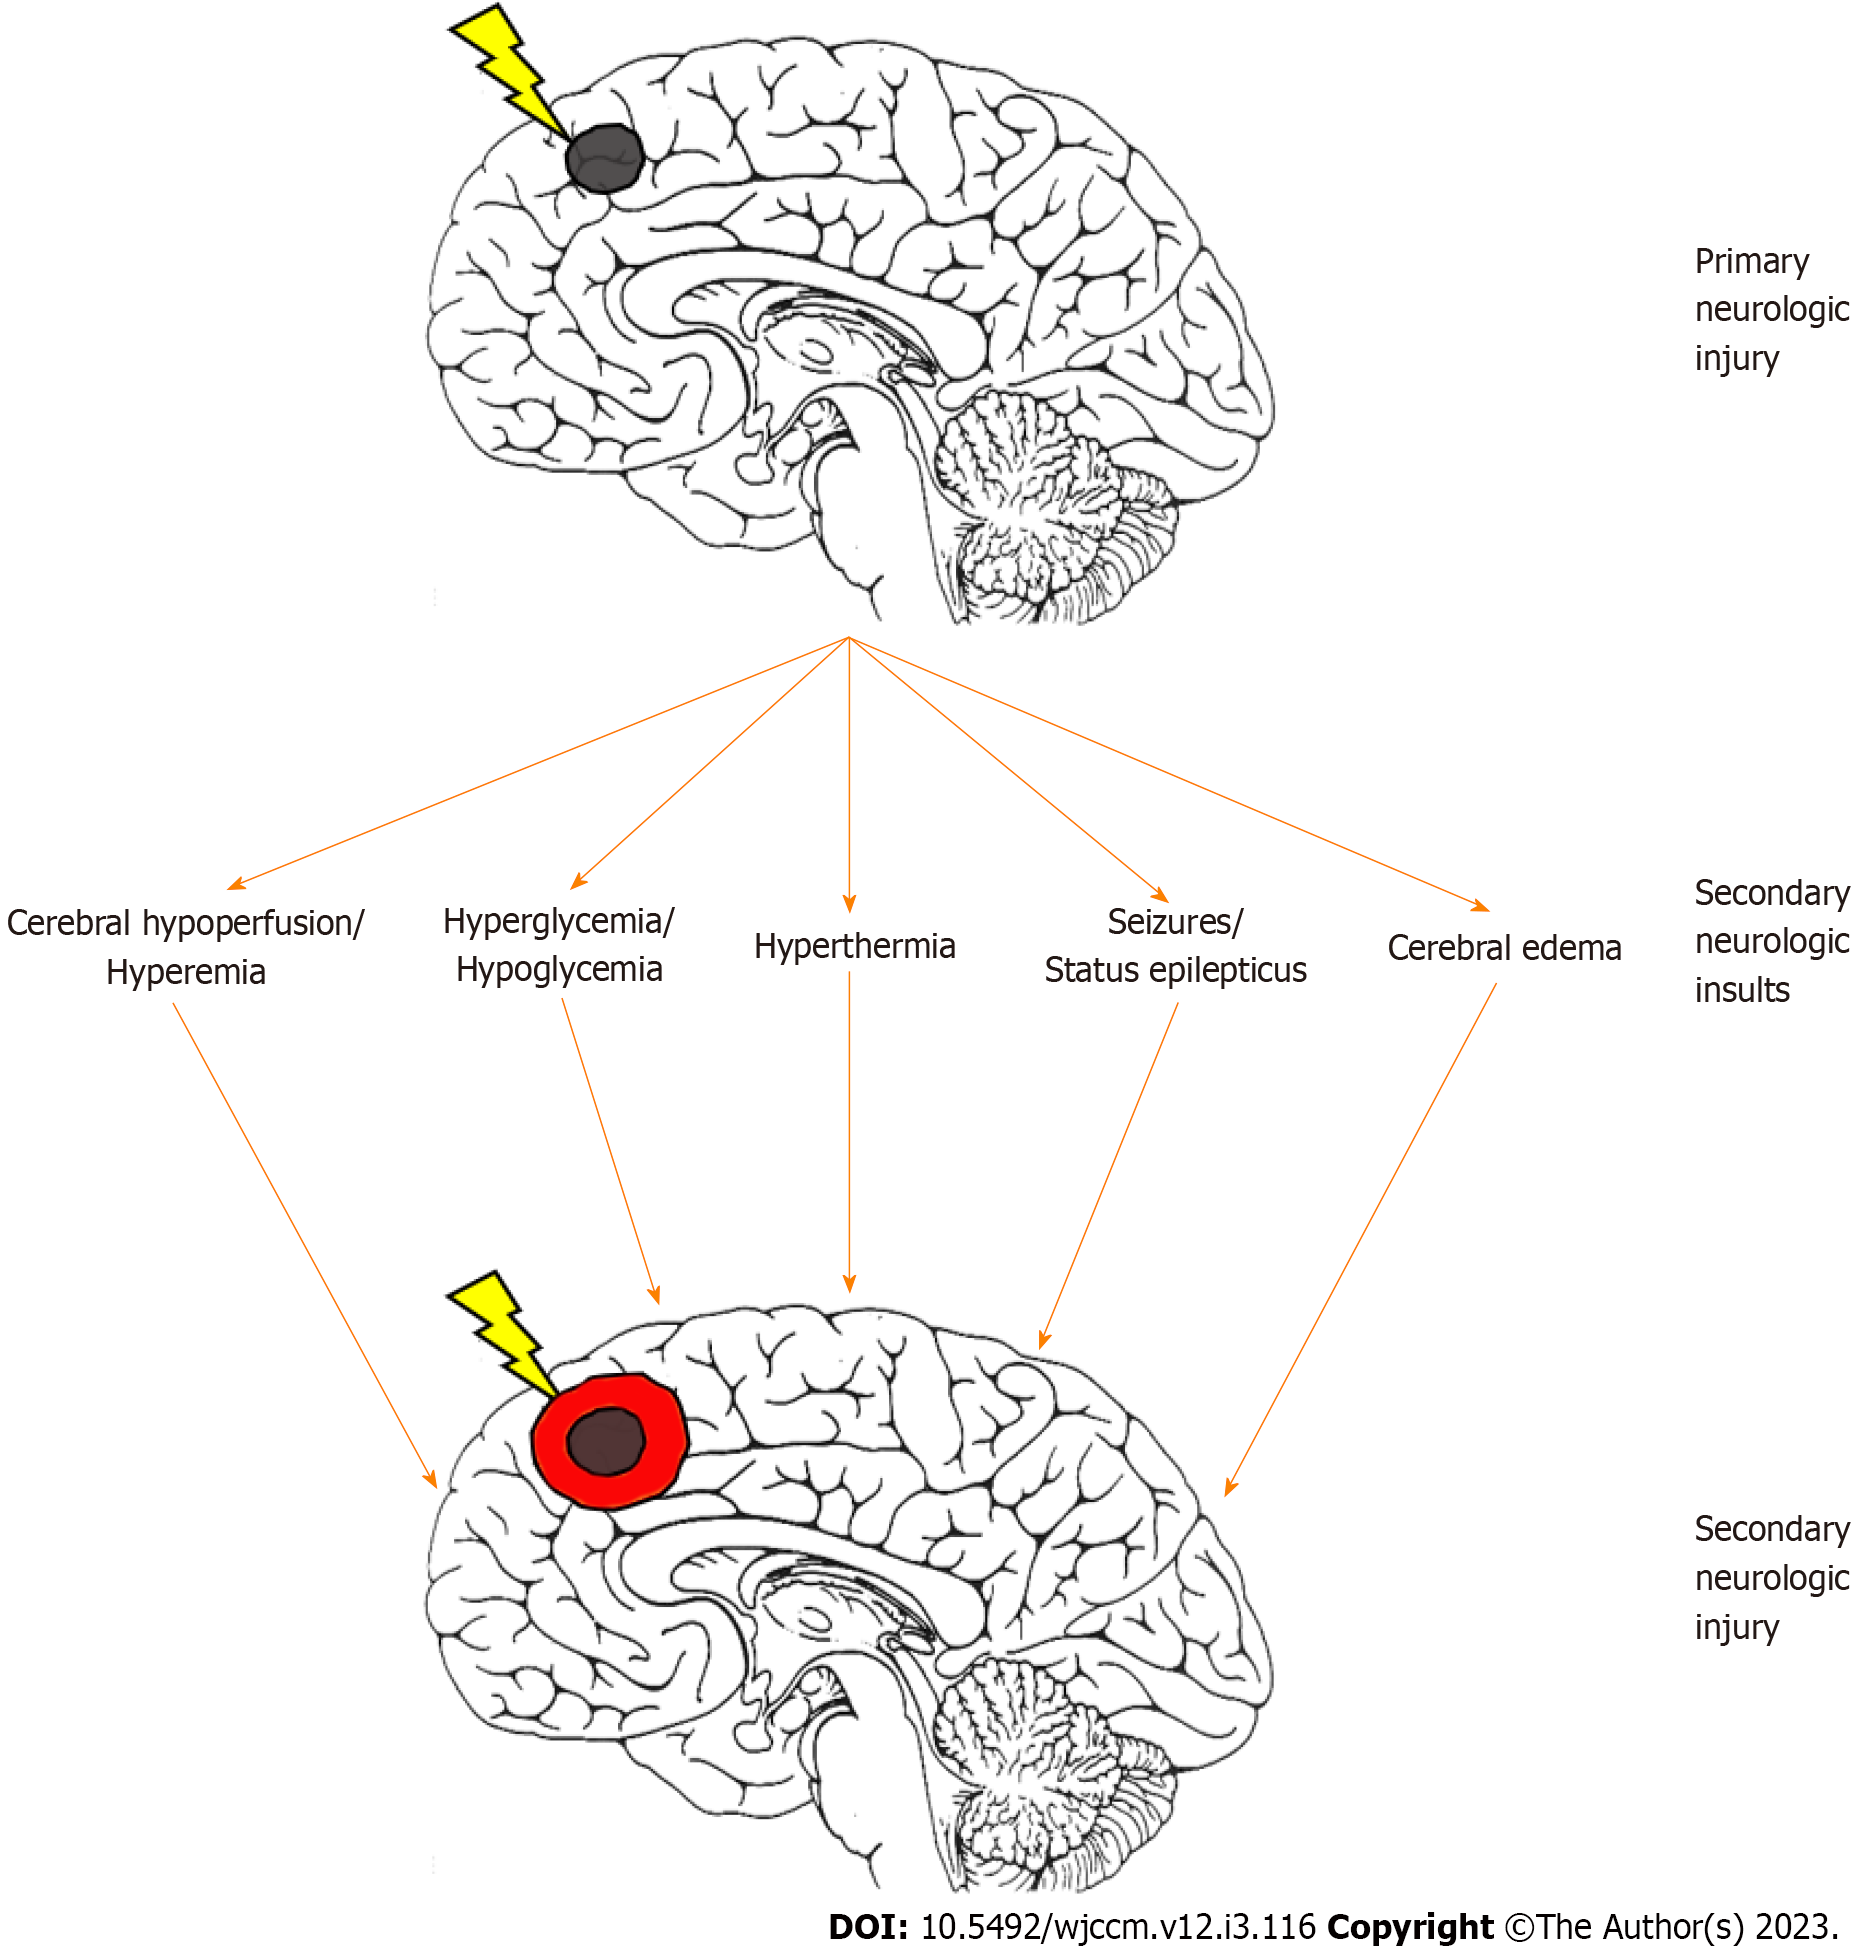
Figure 1 Development of secondary neurologic injury after pediatric acute brain injury.
After primary brain injury (black circle), a host of secondary neurologic insults can contribute to worsening of the initial injury, resulting in secondary neurologic injury (red circle). Neuromonitoring for secondary brain insults and optimization of neuroprotection may help mitigate against secondary neurologic injury in children with acute brain injuries.
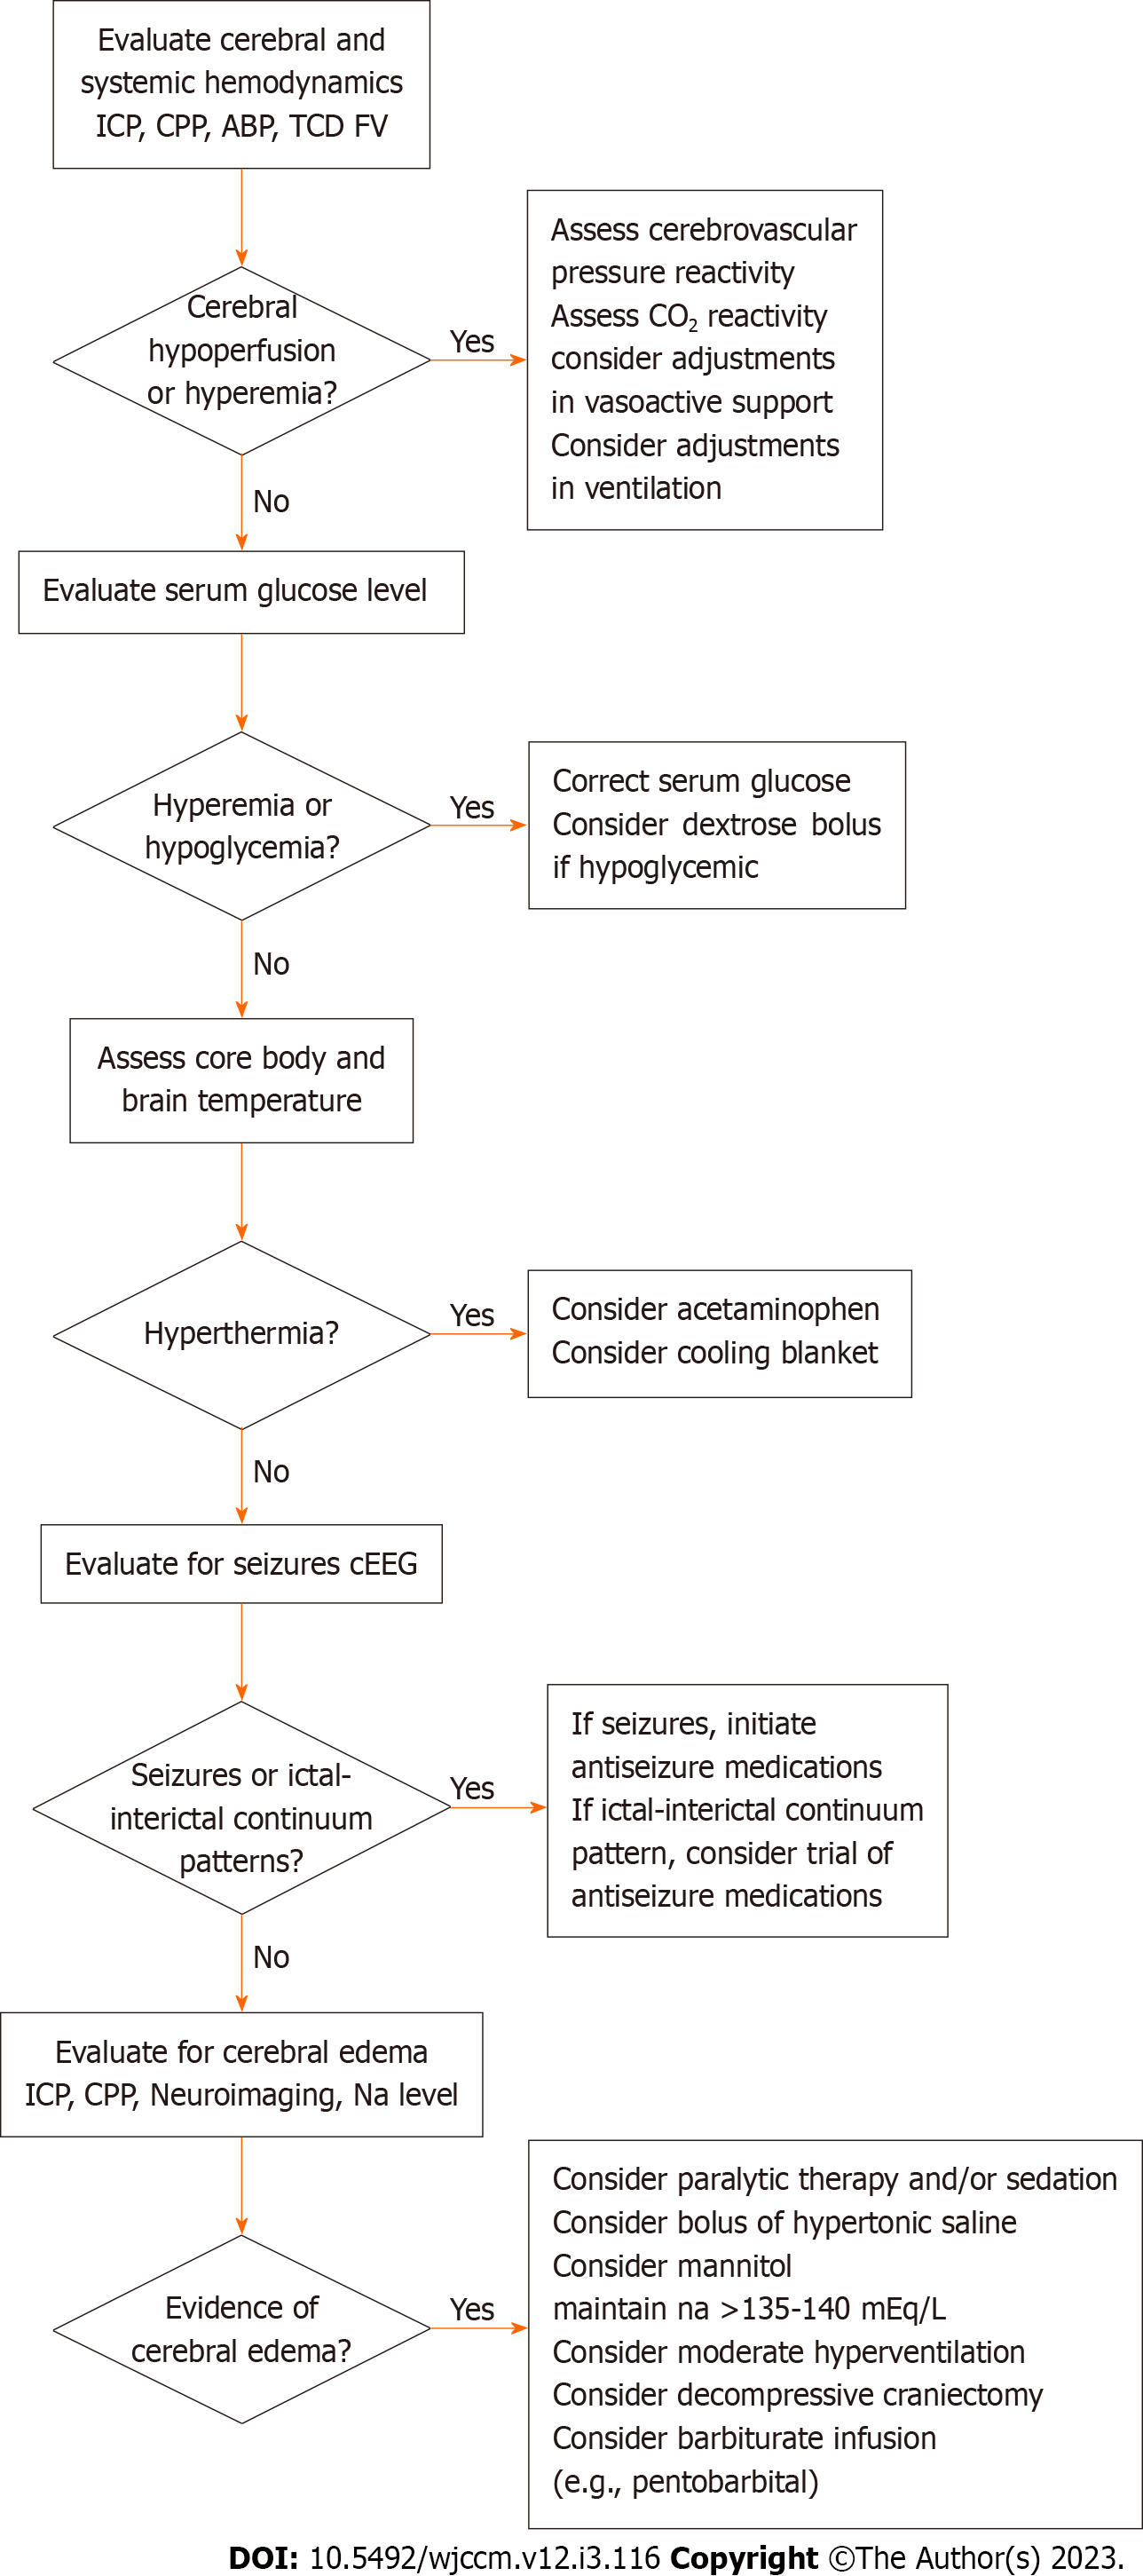
Figure 2 Stepwise algorithm for neuroprotection in pediatric neurocritical care.
ICP: Intracranial pressure; CPP: Cerebral perfusion pressure; ABP: Arterial blood pressure; TCD: Transcranial Doppler ultrasound; FV: Flow velocities; CO2: Carbon reactivity; cEEG: Continuous electroencephalography; NA: Sodium; mEq/L: Milliequivalents per liter.
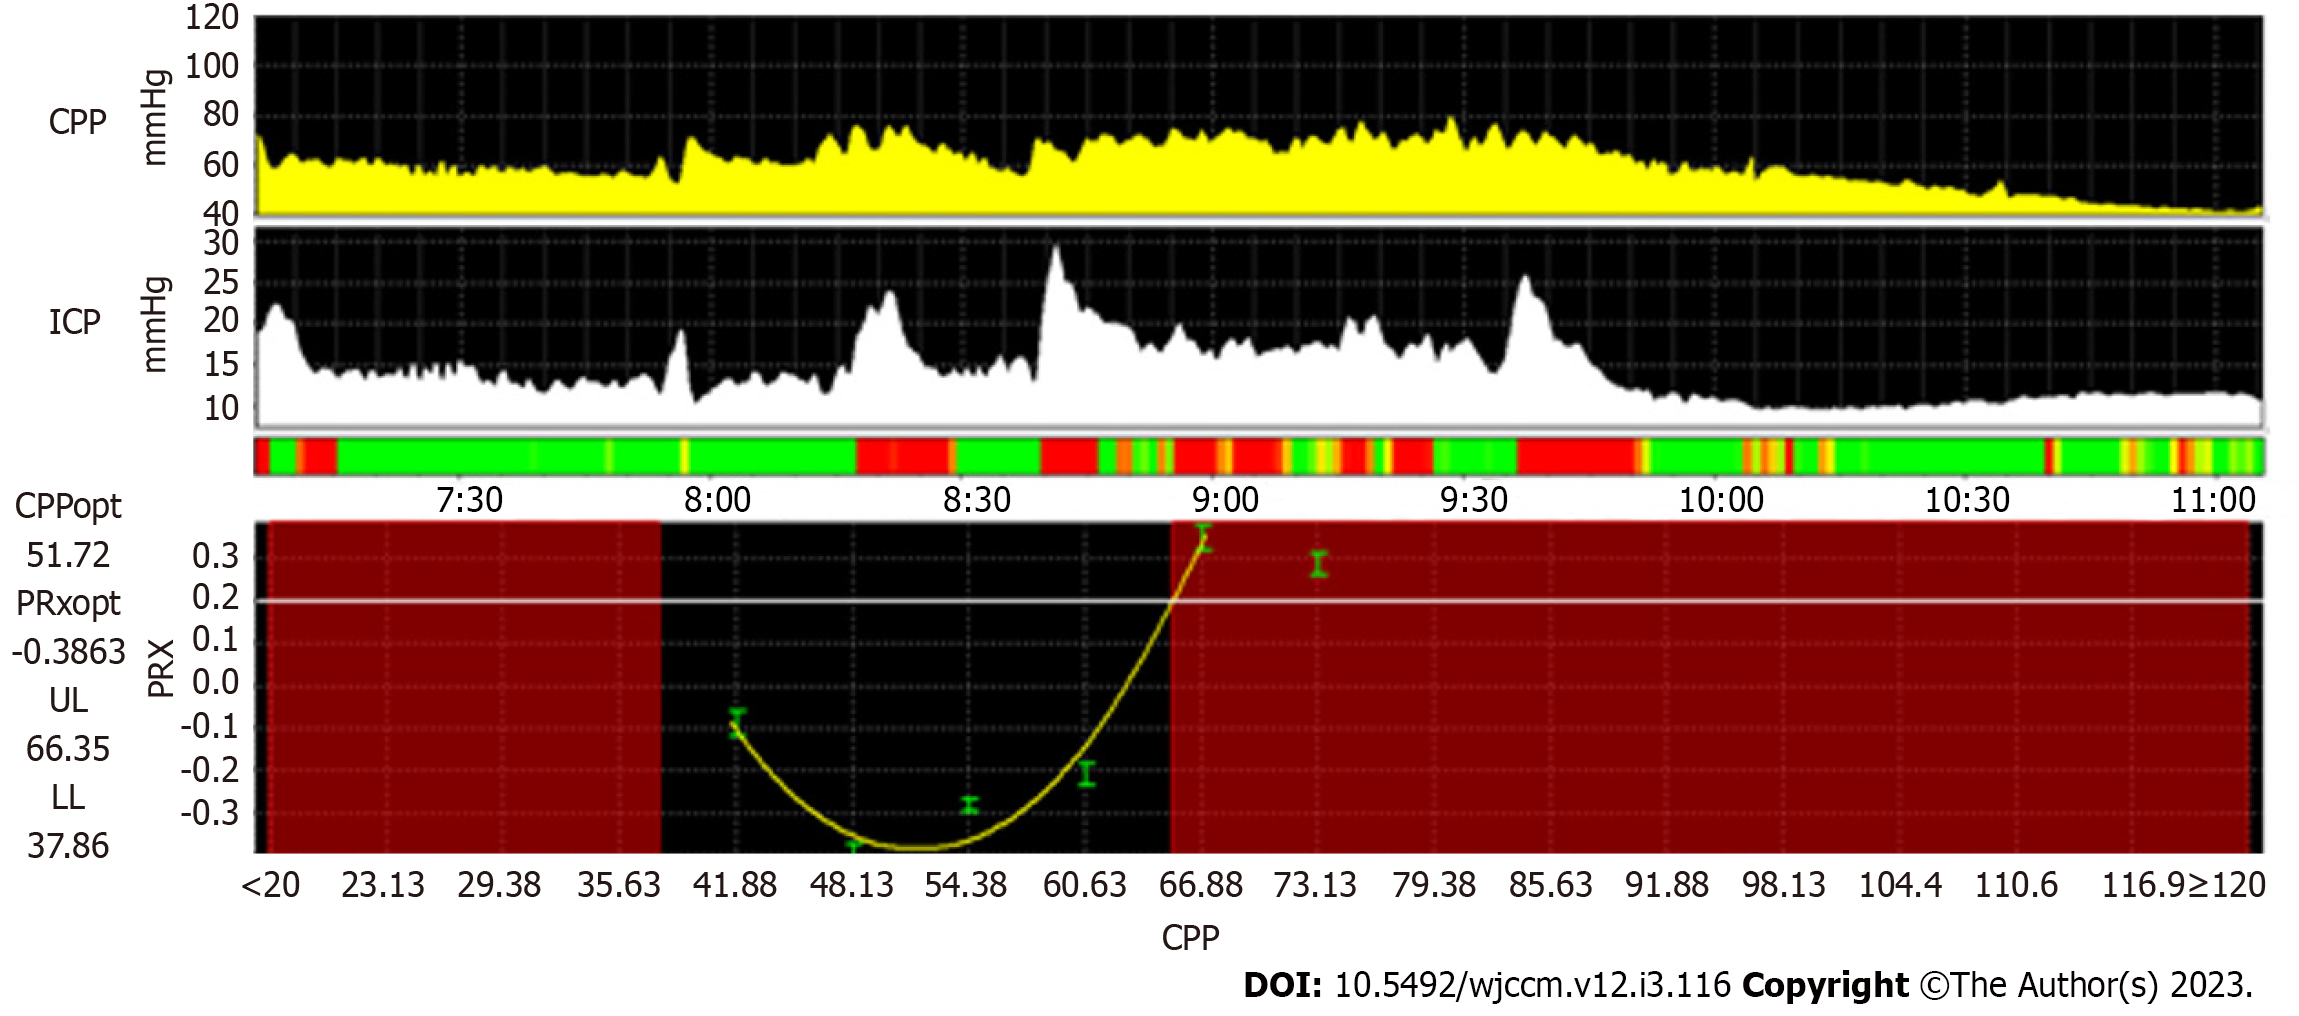
Figure 3 Example of identification of optimal cerebral perfusion in a 2-year-old male with severe traumatic brain injury.
Here, the PRx is plotted across a range of CPP values over a four-hour window, demonstrating a parabolic curve which suggests that the lowest point of the curve (51.72 mmHg; CPPopt) represents the CPP at which cerebrovascular pressure reactivity is most efficient. By using cutoffs of greater than 0.2, the lower limit of cerebrovascular pressure reactivity is estimated at 37.86 mmHg and the upper limit of cerebrovascular pressure reactivity is estimated at 66.35 mmHg. PRx: Pressure reactivity index; CPP: Cerebral perfusion pressure; CPPOpt: Optimal cerebral perfusion pressure; ICP: Intracranial pressure; PRXopt: Optimal pressure reactivity index; UL: Upper limit of cerebrovascular pressure reactivity; LL: Lower limit of cerebrovascular pressure reactivity.
- Citation: Kochar A, Hildebrandt K, Silverstein R, Appavu B. Approaches to neuroprotection in pediatric neurocritical care. World J Crit Care Med 2023; 12(3): 116-129
- URL: https://www.wjgnet.com/2220-3141/full/v12/i3/116.htm
- DOI: https://dx.doi.org/10.5492/wjccm.v12.i3.116


