Copyright
©The Author(s) 2024.
World J Clin Pediatr. Sep 9, 2024; 13(3): 98468
Published online Sep 9, 2024. doi: 10.5409/wjcp.v13.i3.98468
Published online Sep 9, 2024. doi: 10.5409/wjcp.v13.i3.98468
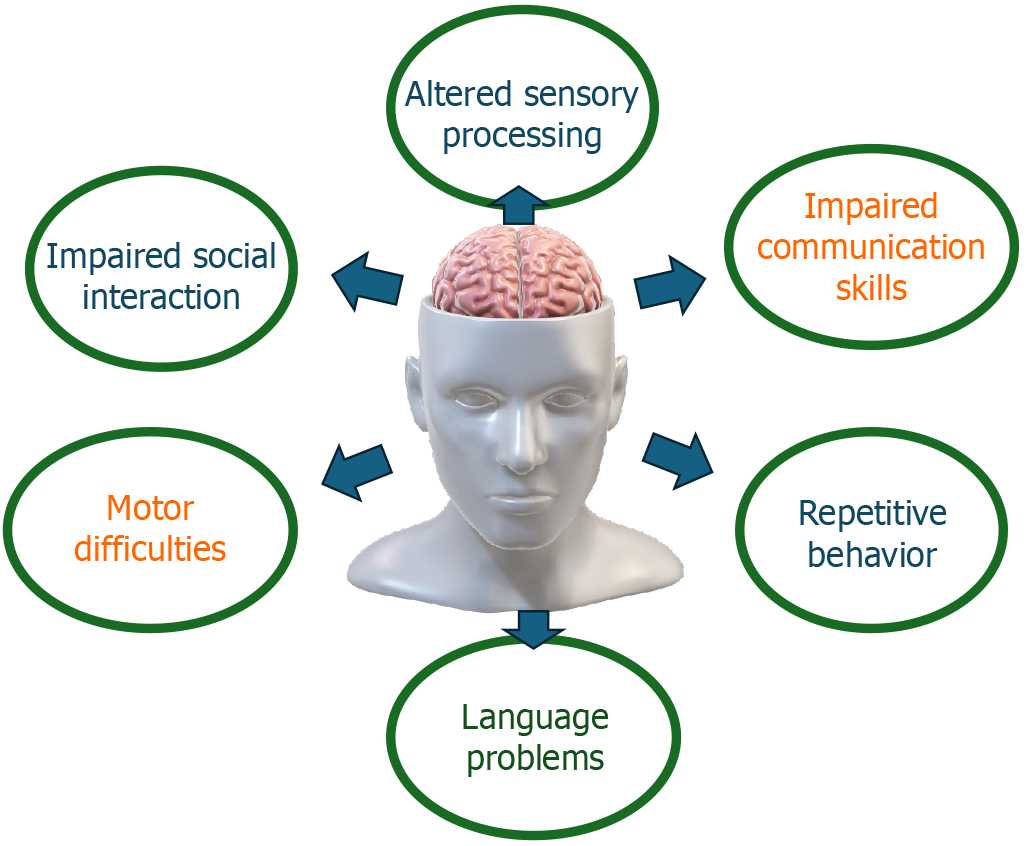
Figure 1
The main clinical manifestations of autism spectrum disorder.
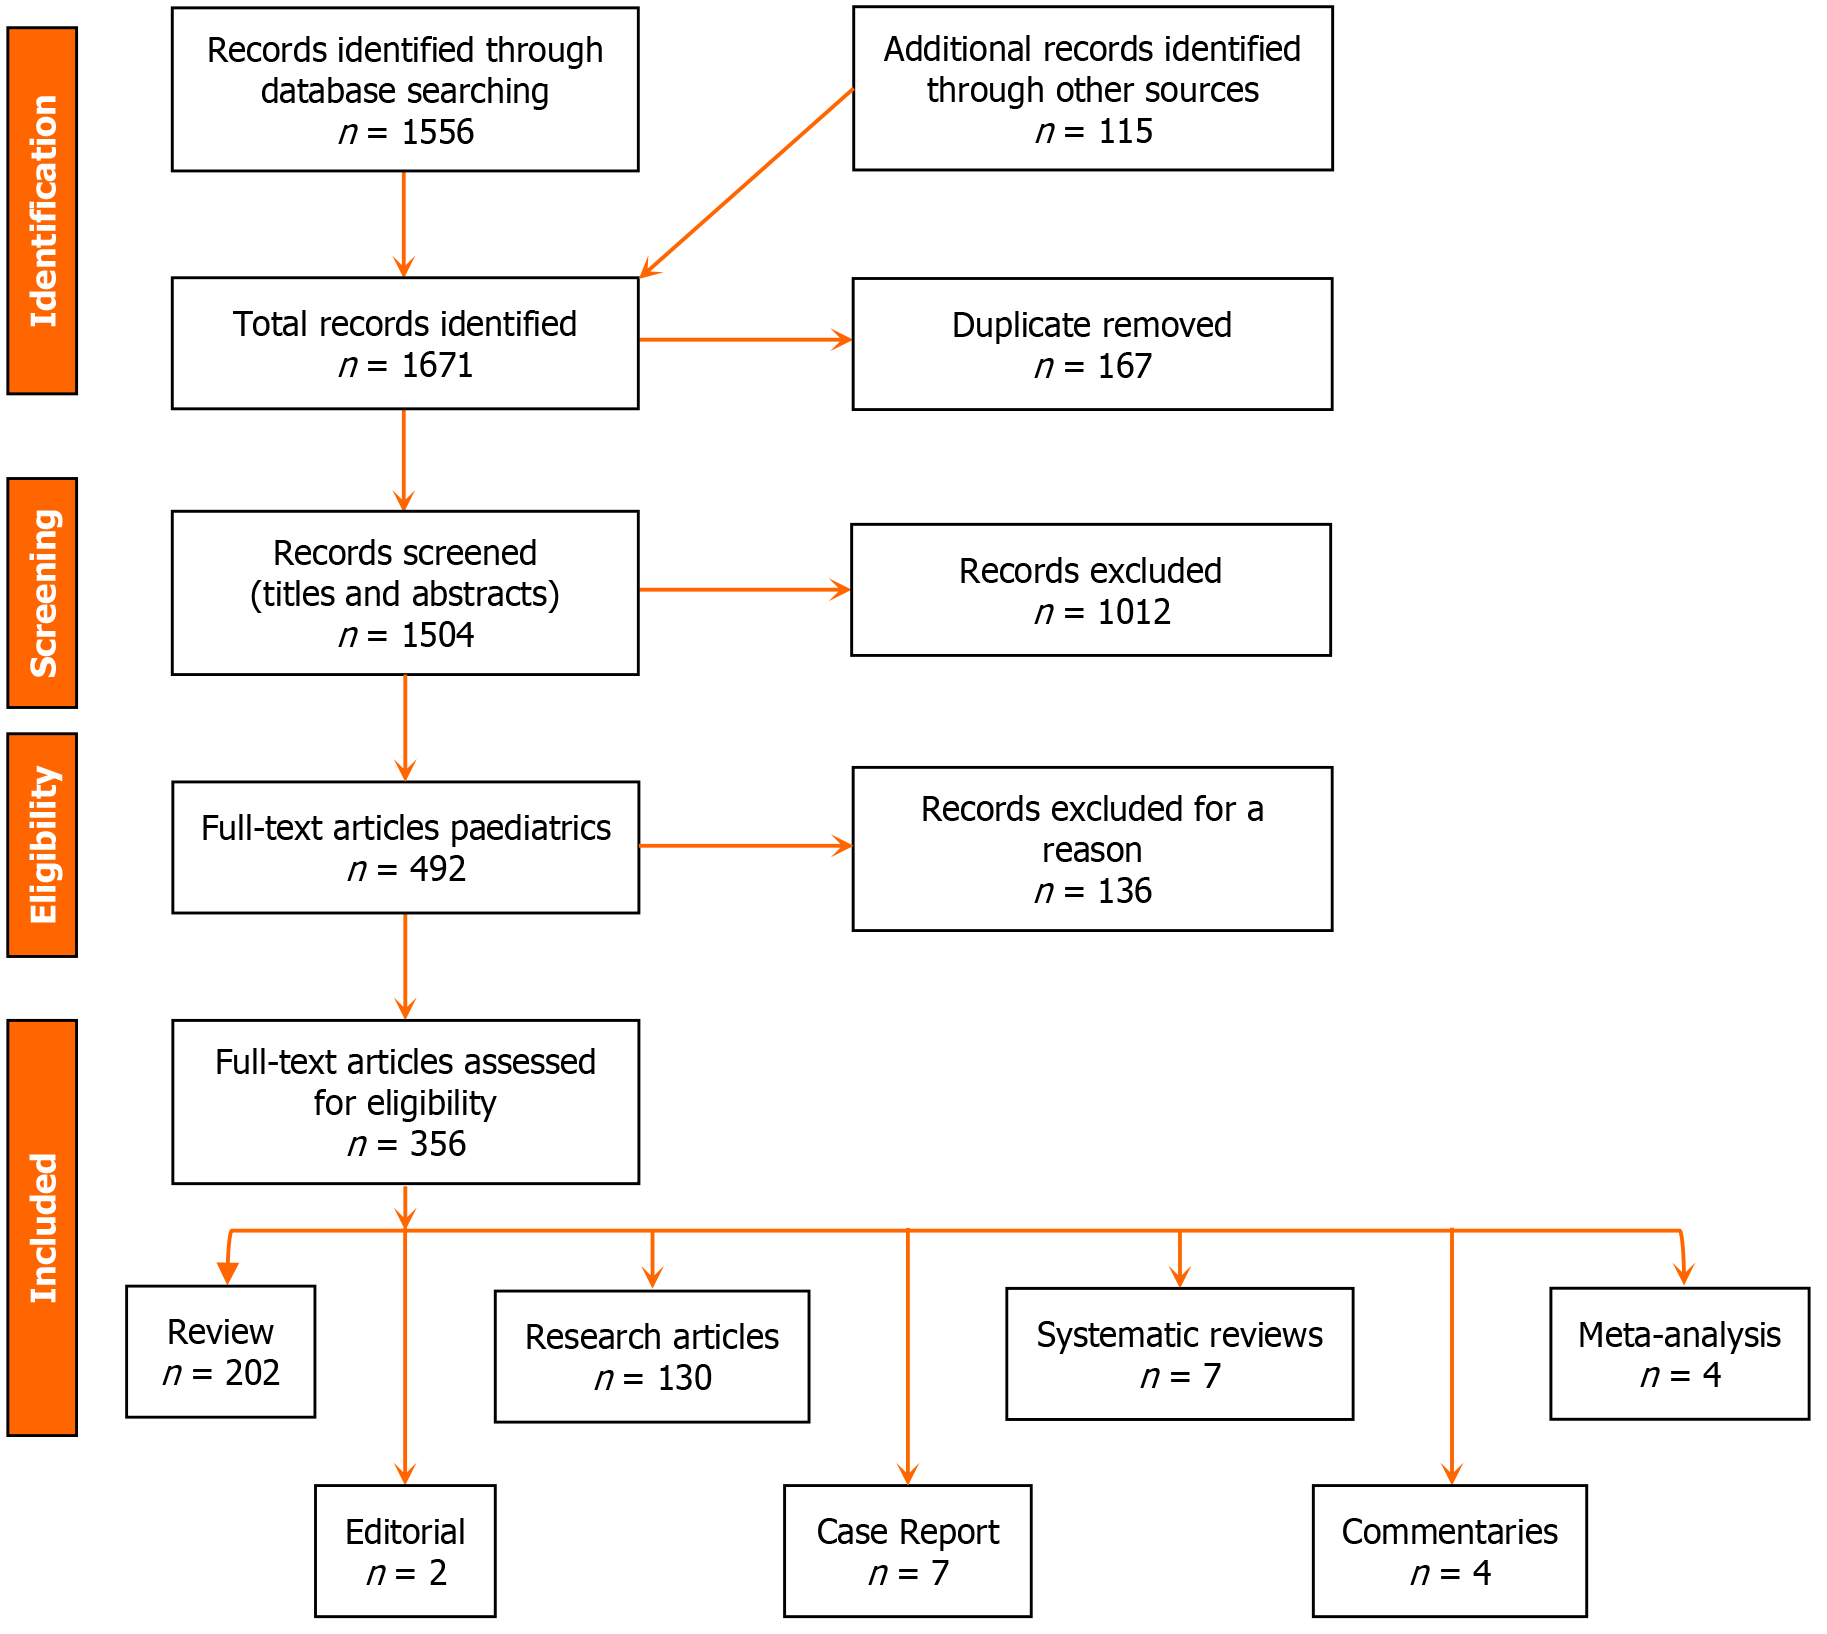
Figure 2
The study flow chart.
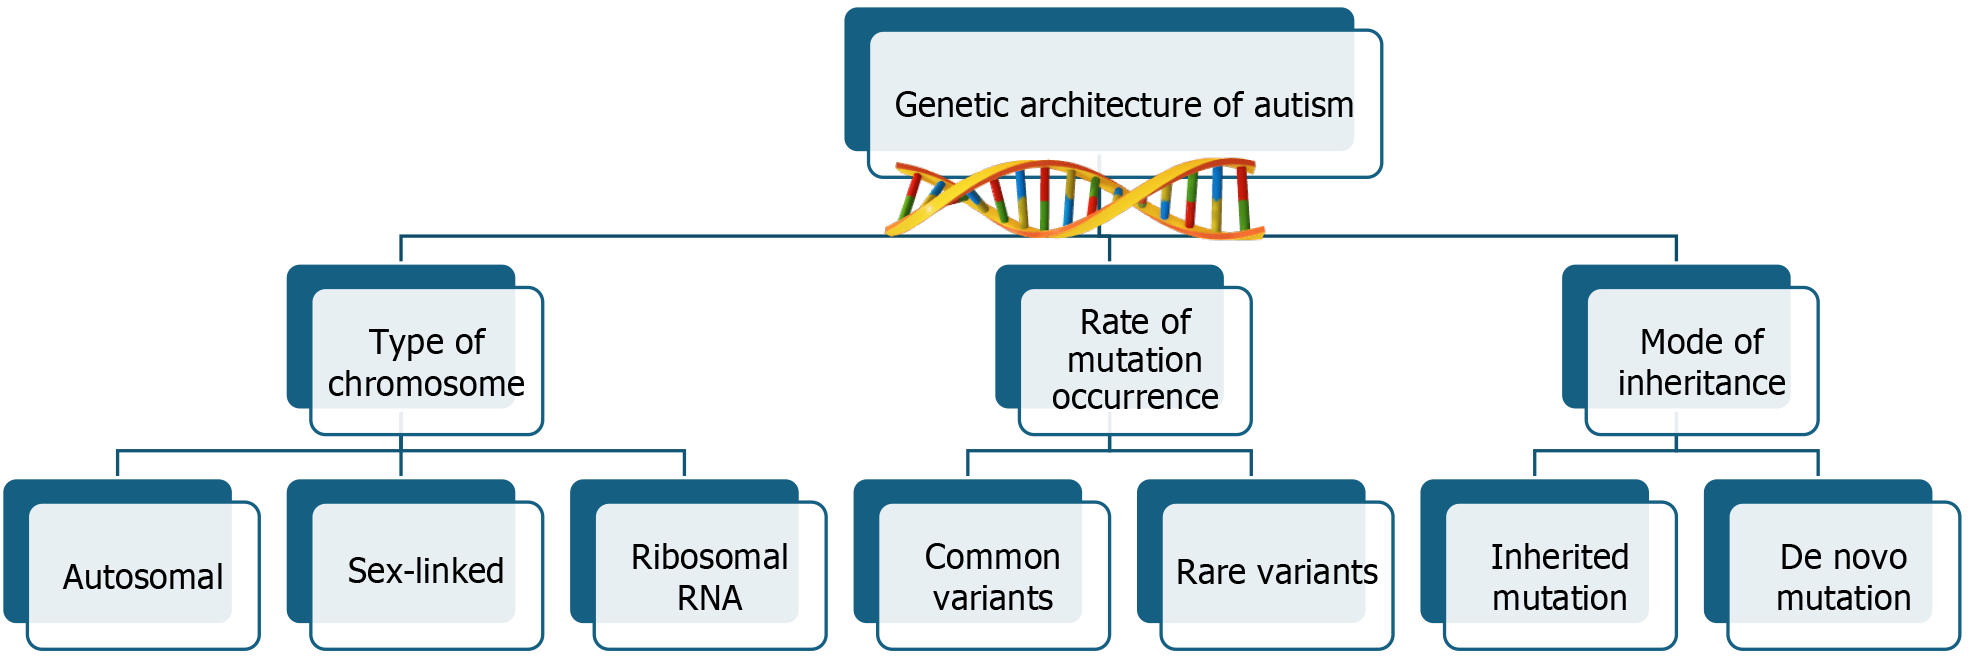
Figure 3
Simple diagrammatic presentation of the genetic architecture of autism.
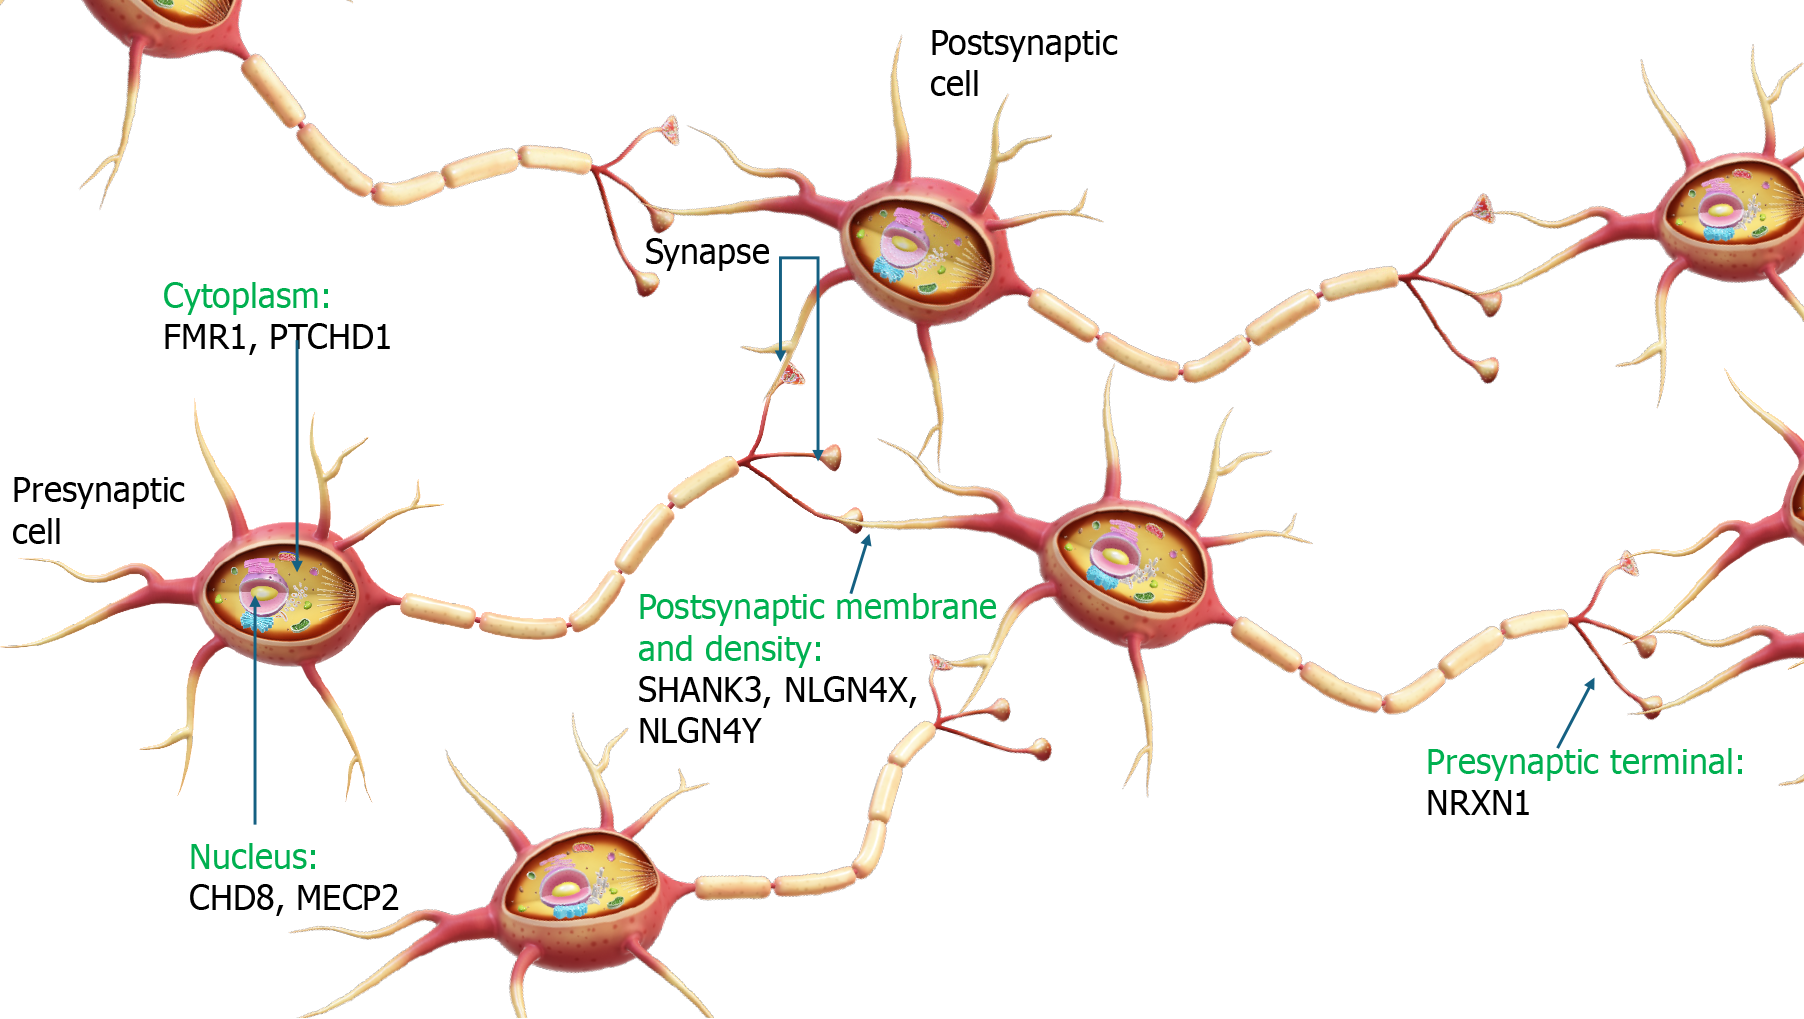
Figure 4 Genetic mutations in autism spectrum disorder: Functions and localizations of representative molecules.
This figure provides an overview of representative molecules and their roles in synaptic function, focusing on the structure of a synapse, including the presynaptic terminal (containing neurotransmitter vesicles), the postsynaptic density (containing receptors and signaling proteins), and the synaptic cleft (space between presynaptic and postsynaptic terminals). Key molecules include CHD8 (chromatin remodeling, gene expression regulation; nucleus; mutations disrupt gene expression, affecting synaptic development), SHANK3 (postsynaptic scaffold protein; postsynaptic density; mutations affect synaptic signaling and plasticity), MECP2 (DNA methylation regulation, transcriptional repression; nucleus; mutations affect neuronal function), FMR1 (regulates synaptic protein synthesis; cytoplasm, dendrites; mutations affect synaptic strength and plasticity), NRXN1 (cell adhesion, synaptic transmission; presynaptic terminal; mutations impair synaptic adhesion and neurotransmitter release), NLGN4X (cell adhesion molecule; postsynaptic membrane; mutations disrupt synaptic signaling and connectivity, especially in males), NLGN4Y [similar to NLGN4X; postsynaptic membrane; variations contribute to sex differences in autism spectrum disorder (ASD)], and PTCHD1 (involved in the Hedgehog signaling pathway; cell membrane and cytoplasm; mutations linked to ASD and intellectual disabilities, more pronounced in males). The synaptic diagram illustrates the overall structure with labeled components, and molecule annotations place symbols representing each molecule at their respective localizations within the synapse, using arrows or lines to indicate their functional roles and the impact of mutations. Additional notes include color coding for different molecules to distinguish their roles and localizations and a legend explaining the symbols, colors, and impact of mutations. This figure underscores the importance of synaptic proteins and pathways in maintaining proper signaling and plasticity, with genetic mutations leading to impaired synaptic function central to ASD pathology.
- Citation: Al-Beltagi M, Saeed NK, Bediwy AS, Bediwy EA, Elbeltagi R. Decoding the genetic landscape of autism: A comprehensive review. World J Clin Pediatr 2024; 13(3): 98468
- URL: https://www.wjgnet.com/2219-2808/full/v13/i3/98468.htm
- DOI: https://dx.doi.org/10.5409/wjcp.v13.i3.98468


