Copyright
©The Author(s) 2018.
World J Anesthesiol. Mar 27, 2018; 7(1): 1-9
Published online Mar 27, 2018. doi: 10.5313/wja.v7.i1.1
Published online Mar 27, 2018. doi: 10.5313/wja.v7.i1.1
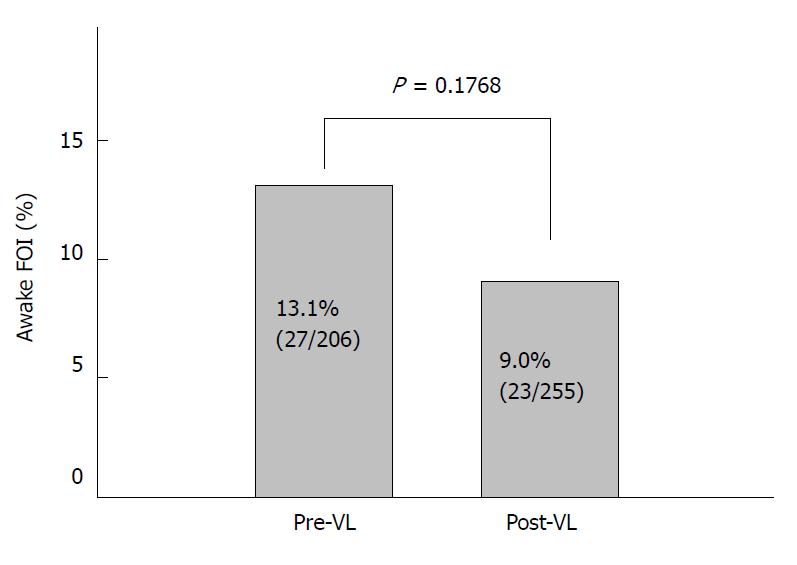
Figure 1 Awake fiberoptic intubation rate in the pre- video laryngoscope group and post video group.
P value calculated with Fisher’s exact test. VL: Video laryngoscope; FOI: Fiberoptic intubation.
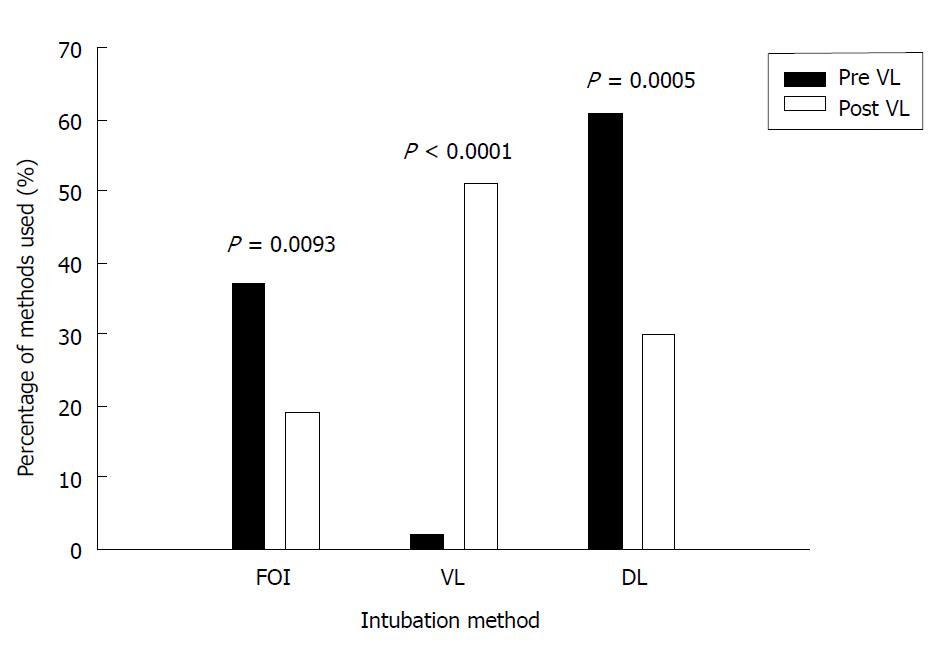
Figure 2 Change in intubation method of predicted difficult airways before and after introduction of video laryngoscopes.
P value calculated with χ2 test of equal proportion. VL: Vodeo laryngoscope; FOI: Fiberoptic intubation; DL: Direct laryngoscopy.
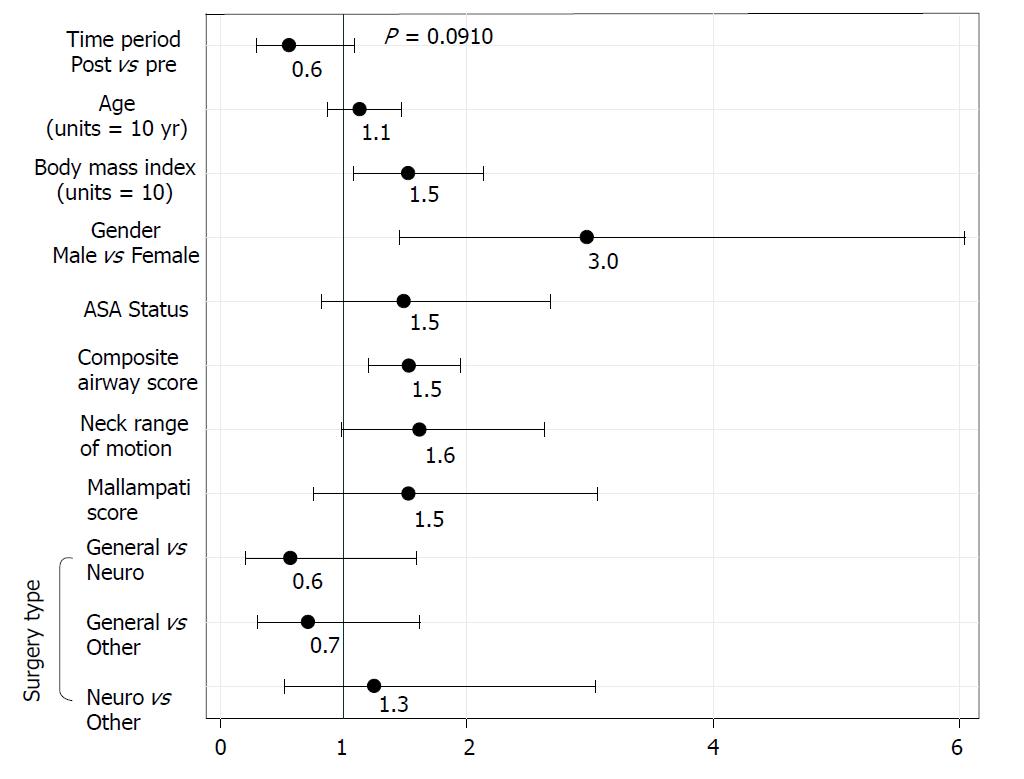
Figure 3 Plot of odds ratio with 95% wald confidence limits of various predictive factors for awake fiberoptic intubation.
Statistics calculated with logistic regression.
- Citation: Jarzebowski M, Rajagopal A, Austell B, Moric M, Buvanendran A. Change in management of predicted difficult airways following introduction of video laryngoscopes. World J Anesthesiol 2018; 7(1): 1-9
- URL: https://www.wjgnet.com/2218-6182/full/v7/i1/1.htm
- DOI: https://dx.doi.org/10.5313/wja.v7.i1.1


