Copyright
©The Author(s) 2018.
World J Orthop. Dec 18, 2018; 9(12): 292-299
Published online Dec 18, 2018. doi: 10.5312/wjo.v9.i12.292
Published online Dec 18, 2018. doi: 10.5312/wjo.v9.i12.292
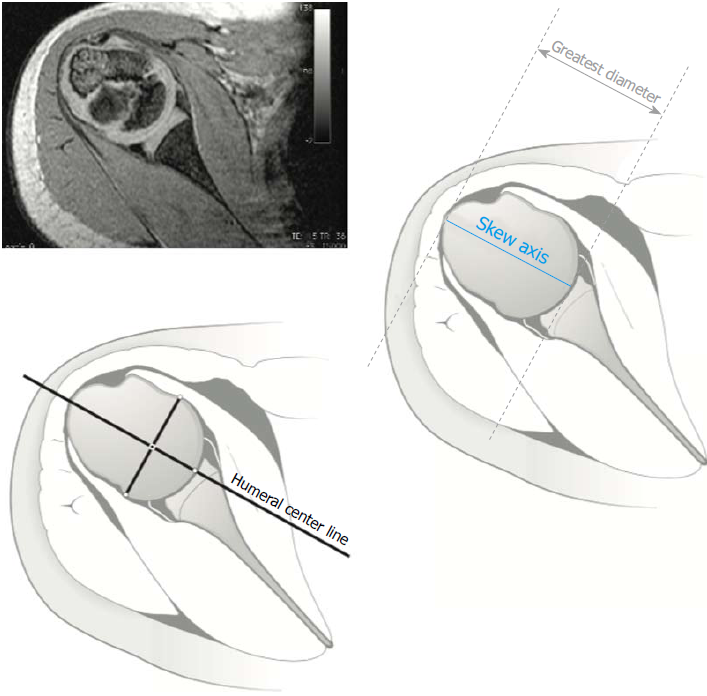
Figure 1 Schematic illustration of measurement parameters applied to a magnetic resonance imaging slice from the proximal part of the normal uninvolved, humerus.
(Reproduced with modification from: Pearl ML, et al. Geometry of the proximal humeral articular surface in young children: a study to define normal and analyze the dysplasia due to brachial plexus birth palsy. J Shoulder Elbow Surg 2013; 22: 1274-84. Reproduced with permission from Elsevier.)
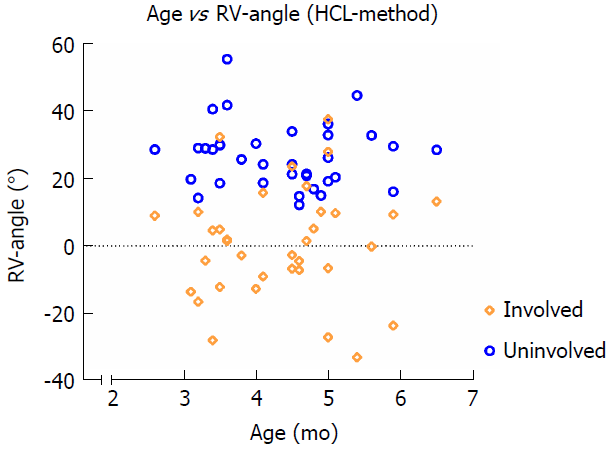
Figure 2 The distribution among measurements using the humeral center line as a proximal axis.
HCL: Humeral center line; RV-angle: Retroversion angle.
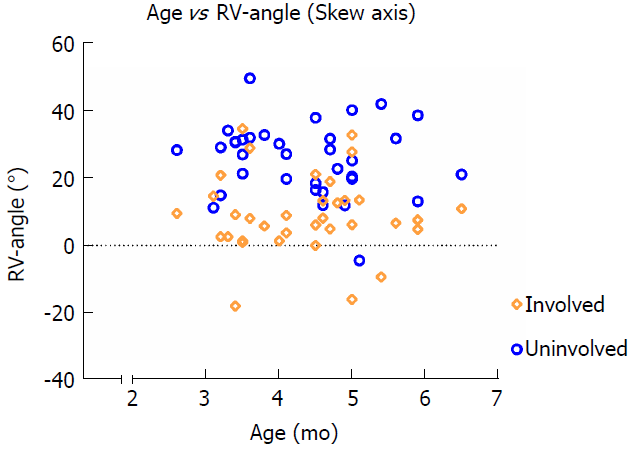
Figure 3 The distribution among measurements using the skew axis as a proximal axis.
In the deformed humeral head, the skew axis yields systematically higher values compared to the humeral center line. RV-angle: Retroversion angle.
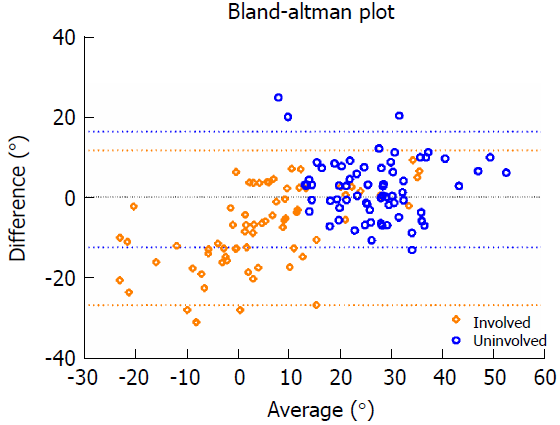
Figure 4 The distribution of measurement in the involved shoulder is larger than on the involved side, indicating measurement differences between the skew axis and humeral center line are larger on the involved side.
The blue and orange dotted lines represent the 95% limits of agreement.
- Citation: van de Bunt F, Pearl ML, van Essen T, van der Sluijs JA. Humeral retroversion and shoulder muscle changes in infants with internal rotation contractures following brachial plexus birth palsy. World J Orthop 2018; 9(12): 292-299
- URL: https://www.wjgnet.com/2218-5836/full/v9/i12/292.htm
- DOI: https://dx.doi.org/10.5312/wjo.v9.i12.292


