Copyright
©The Author(s) 2017.
World J Orthop. Sep 18, 2017; 8(9): 719-725
Published online Sep 18, 2017. doi: 10.5312/wjo.v8.i9.719
Published online Sep 18, 2017. doi: 10.5312/wjo.v8.i9.719
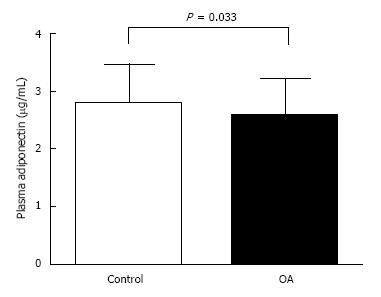
Figure 1 Adiponectin levels in plasma between control and osteoarthritis groups.
OA: Osteoarthritis.
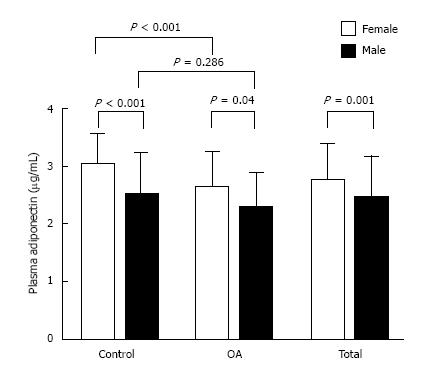
Figure 2 Comparison of plasma adiponectin levels between female and male in control group osteoarthritis group and total subjects.
OA: Osteoarthritis.
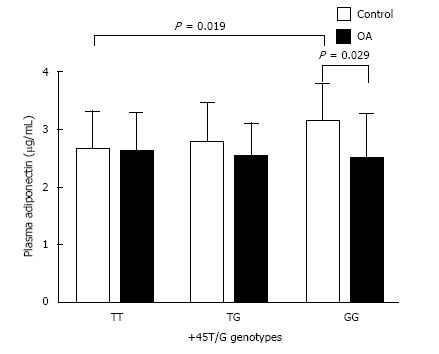
Figure 3 Genotypes of +45T/G locus and their plasma adiponectin levels in control group and osteoarthritis group.
OA: Osteoarthritis.
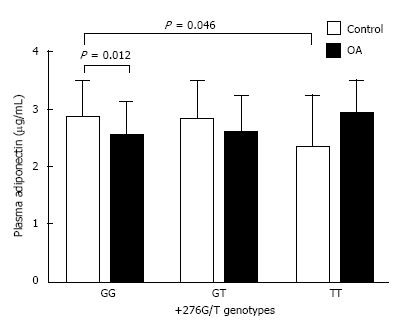
Figure 4 Genotypes of +276G/T locus and their plasma adiponectin levels in control group and osteoarthritis group.
OA: Osteoarthritis.
- Citation: Zhan D, Thumtecho S, Tanavalee A, Yuktanandana P, Anomasiri W, Honsawek S. Association of adiponectin gene polymorphisms with knee osteoarthritis. World J Orthop 2017; 8(9): 719-725
- URL: https://www.wjgnet.com/2218-5836/full/v8/i9/719.htm
- DOI: https://dx.doi.org/10.5312/wjo.v8.i9.719


