Copyright
©The Author(s) 2017.
World J Orthop. Nov 18, 2017; 8(11): 829-835
Published online Nov 18, 2017. doi: 10.5312/wjo.v8.i11.829
Published online Nov 18, 2017. doi: 10.5312/wjo.v8.i11.829
Figure 1 Subdividing the specimens of vertebroplasty (left) and kyphoplasty (right) to 9 smaller cubes in 3 layers in order to evaluate the regional variations in stress distribution.
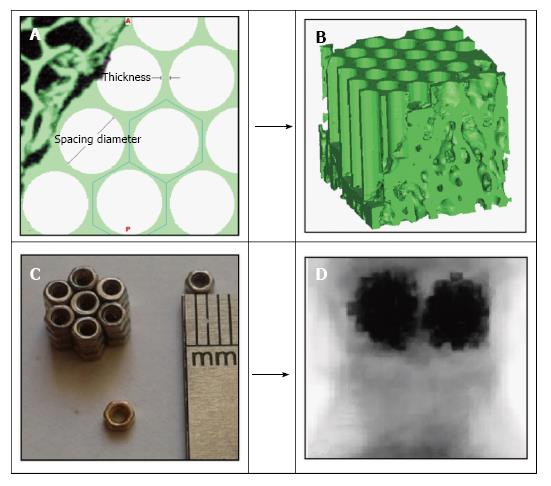
Figure 2 Spacing diameter and thickness.
A and B: Design of hexagonal porous structure; C and D: Using a symmetric circle pattern equivalent to; the embedded hexagonal structure in the experimental study (Ref [21]), already performed.
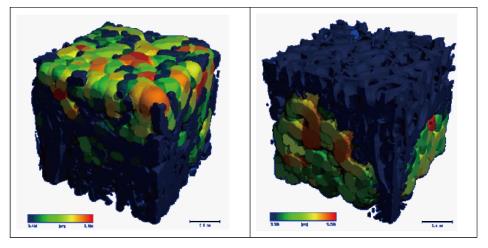
Figure 3 Different cement distribution in the vertebroplasty (left) and kyphoplasty (right).
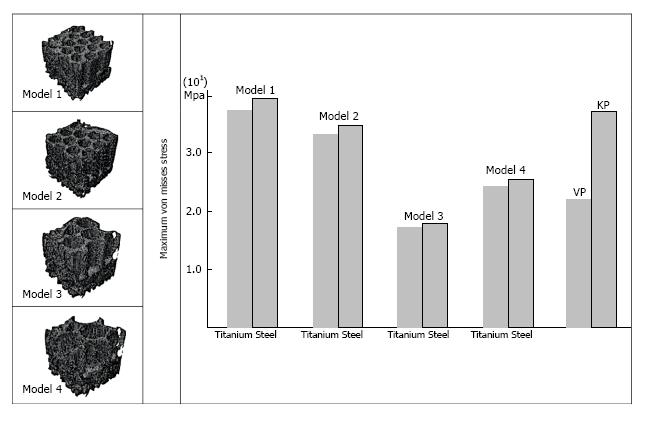
Figure 4 Maximum von misses stress in the cube with geometrically different hexagonal structures: model 1 to 4 and also in the vertebroplasty and kyphoplasty in the form of bar graph.
- Citation: Faradonbeh SAH, Jamshidi N. Biomechanical assessment of new surgical method instead of kyphoplasty to improve the mechanical behavior of the vertebra: Micro finite element study. World J Orthop 2017; 8(11): 829-835
- URL: https://www.wjgnet.com/2218-5836/full/v8/i11/829.htm
- DOI: https://dx.doi.org/10.5312/wjo.v8.i11.829


