Copyright
©The Author(s) 2024.
World J Orthop. Sep 18, 2024; 15(9): 870-881
Published online Sep 18, 2024. doi: 10.5312/wjo.v15.i9.870
Published online Sep 18, 2024. doi: 10.5312/wjo.v15.i9.870
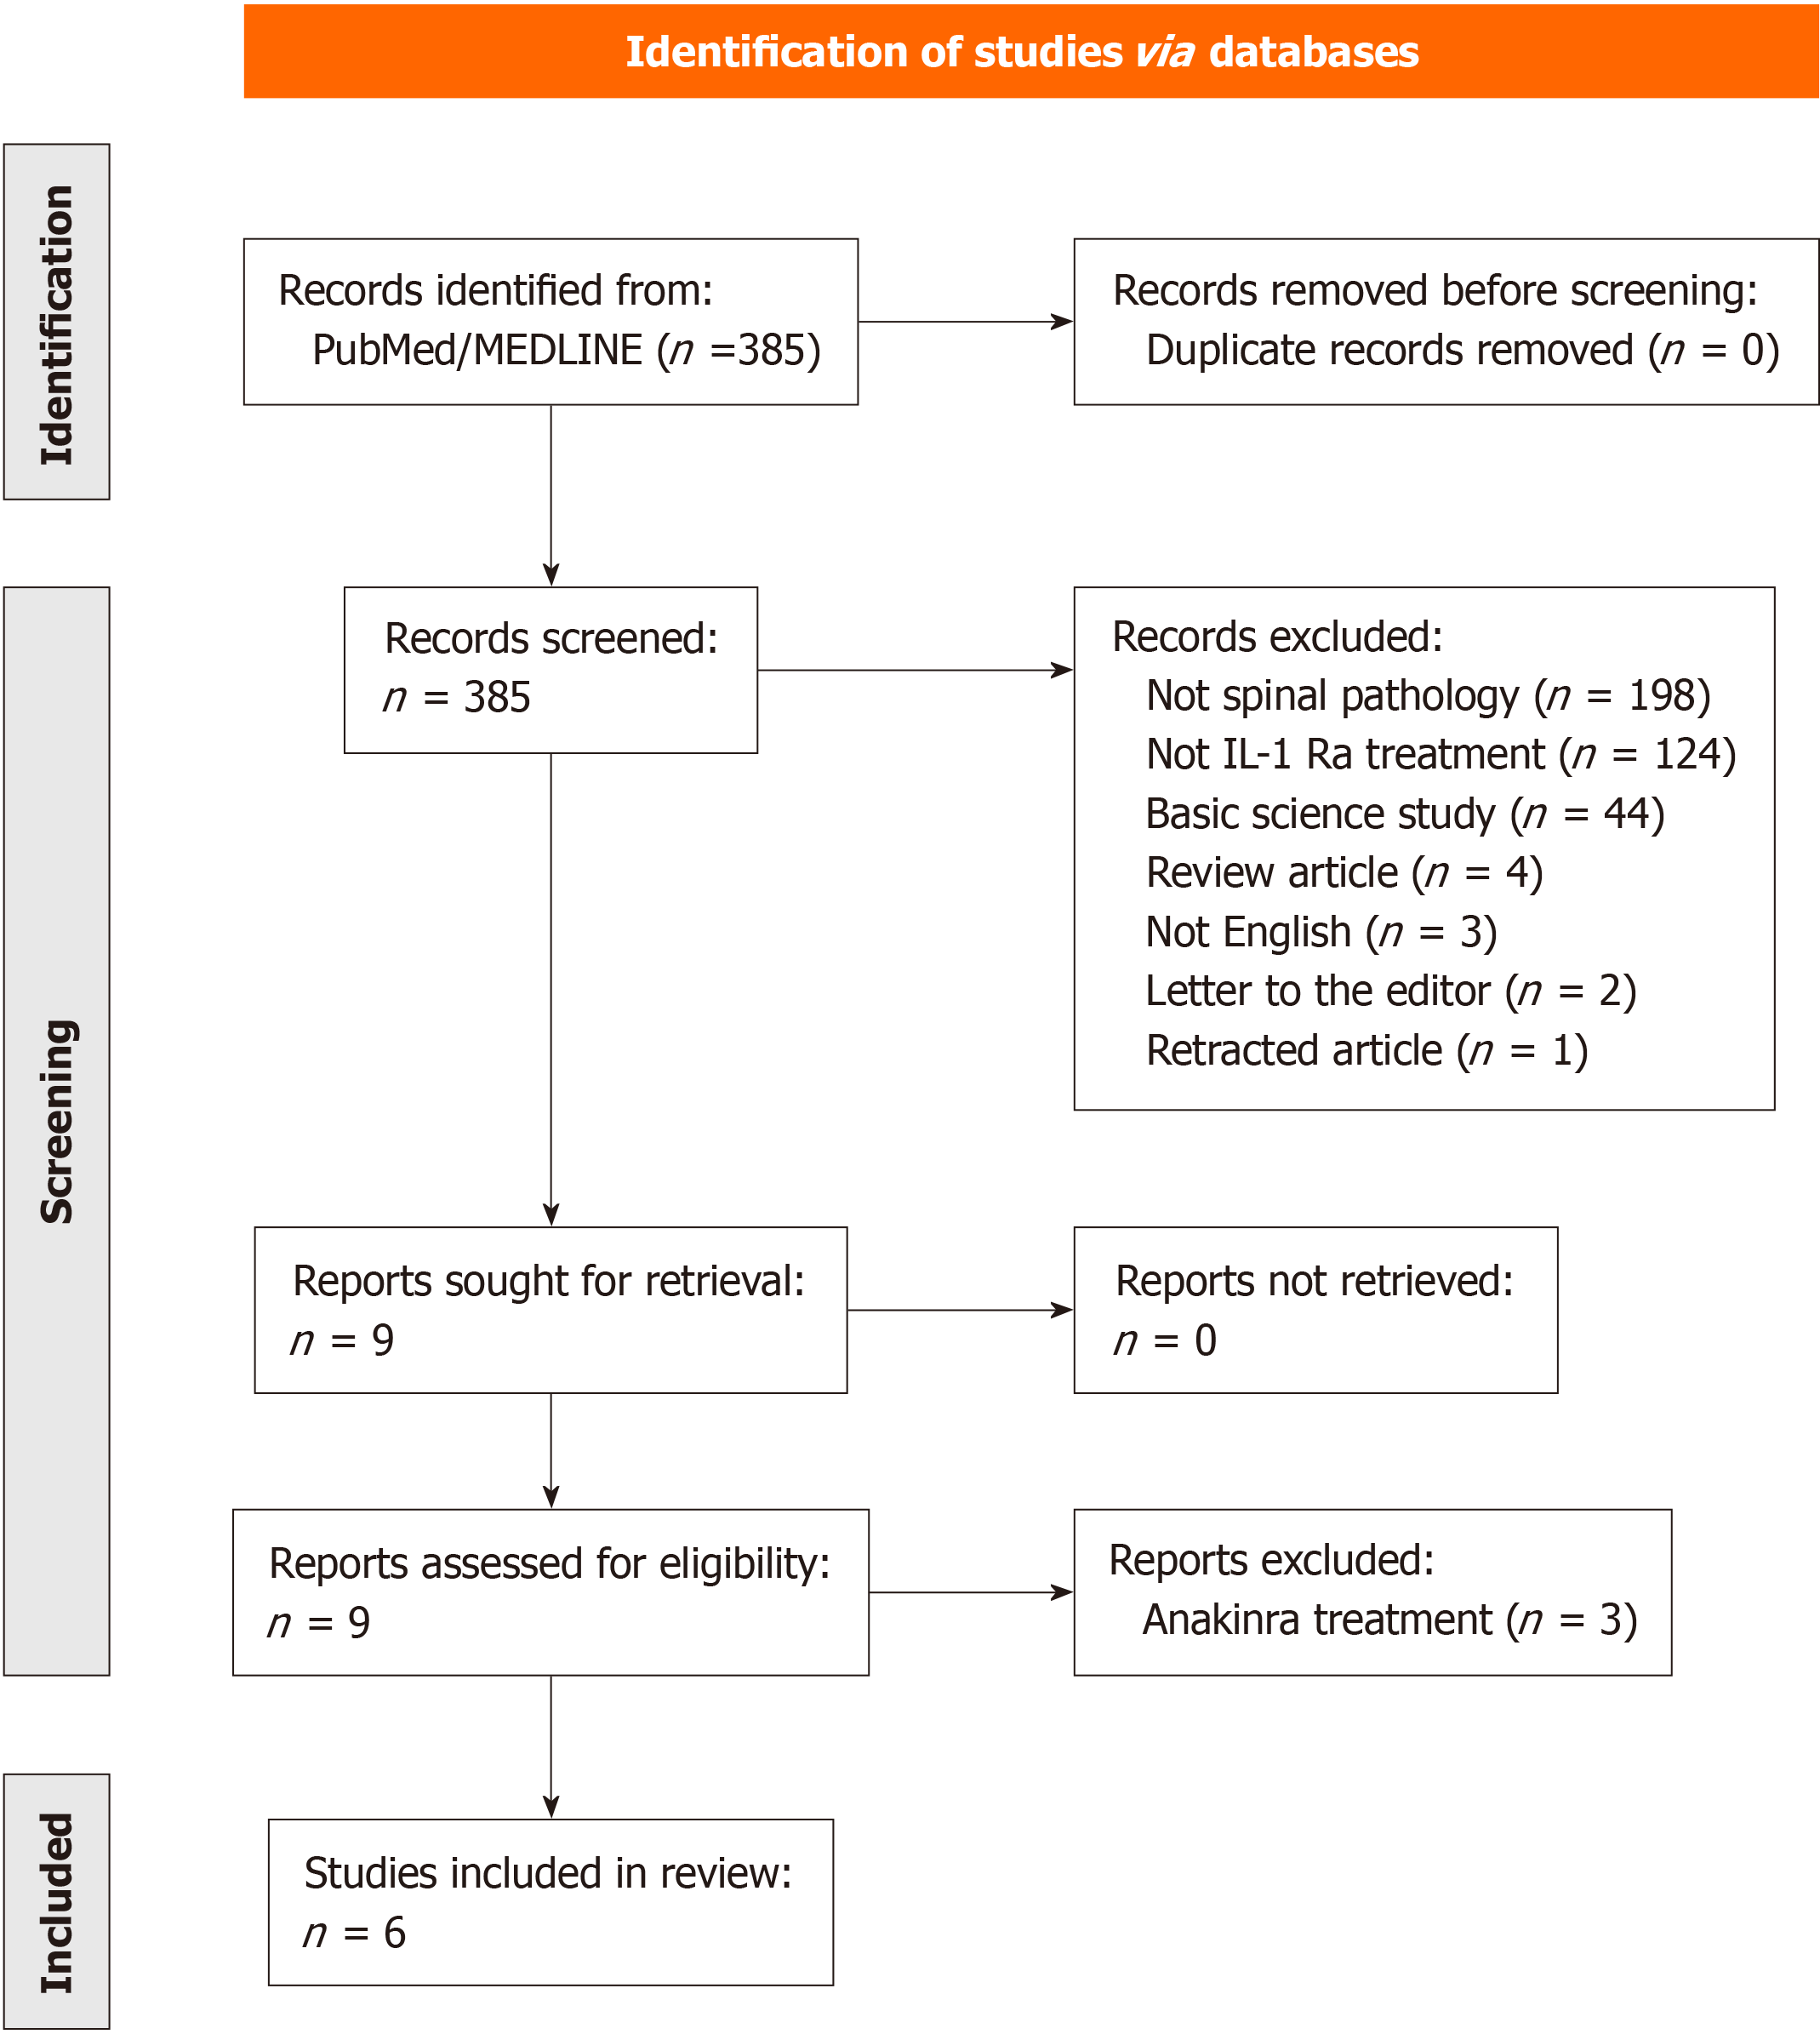
Figure 1
The preferred reporting items for systematic reviews and meta-analyses flowchart of search results.
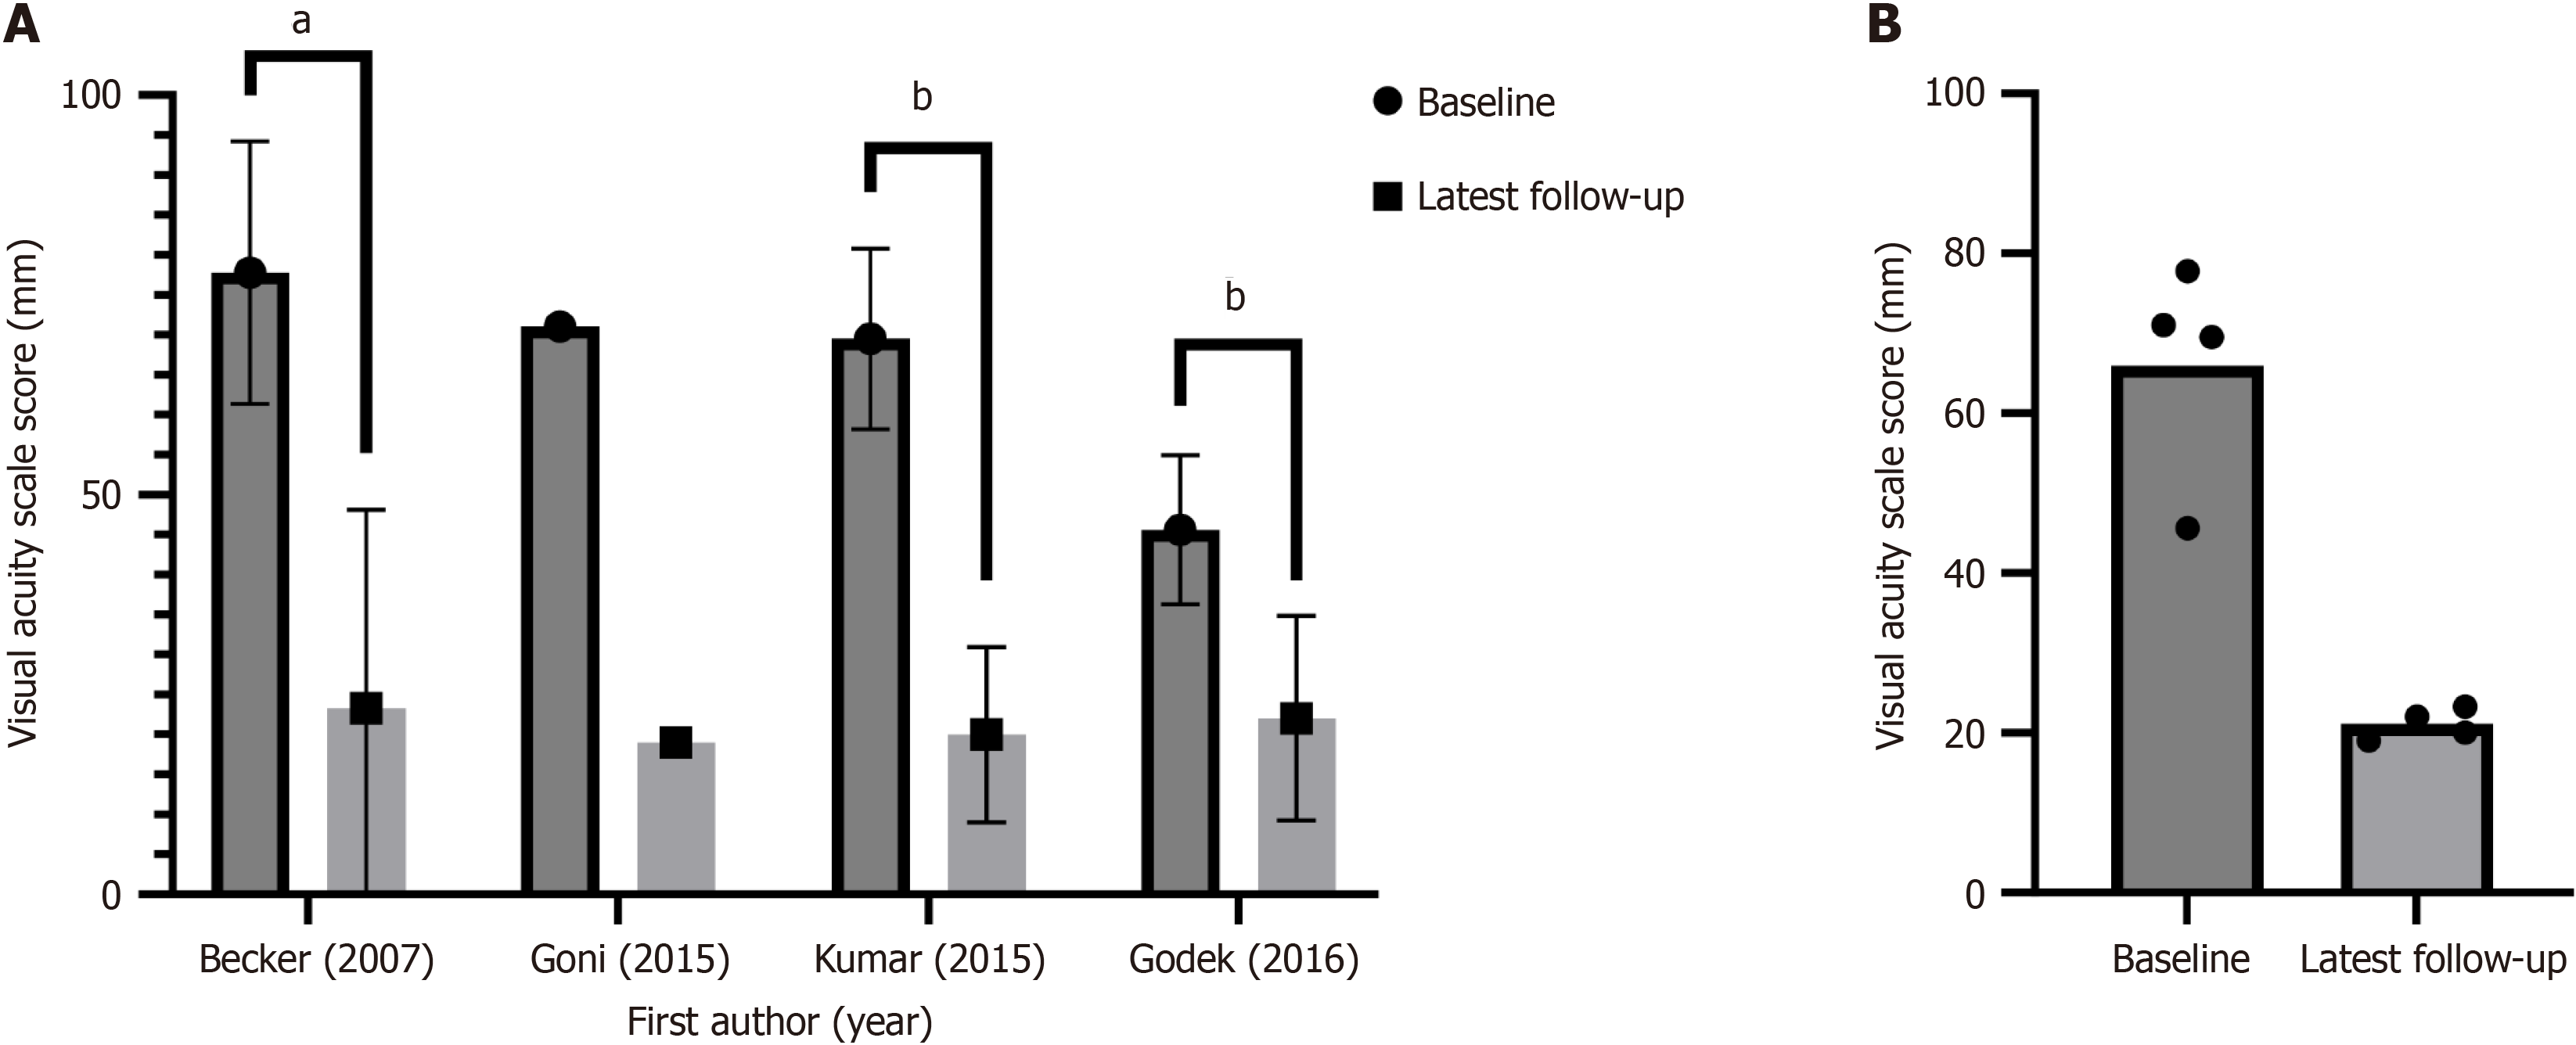
Figure 2 Patient visual acuity scale scores at baseline and at latest follow-up.
A: The mean and standard deviation visual acuity scale (VAS) scores are depicted at baseline and latest follow-up after autologous conditioned serum injection for each of four included studies Becker et al[15]: n = 32, Goni et al[16]: n = 20, HS et al[17]: n = 20, Godek et al[19]: n = 15. Goni et al[16] did not report standard deviations for reported VAS scores or conduct pairwise comparison between baseline and follow-up VAS scores; B: The combined mean VAS scores are depicted at baseline and follow-up as reported by Becker et al[15], Goni et al[16], HS et al[17], and Godek et al[19]. aP < 0.05; bP < 0.01.
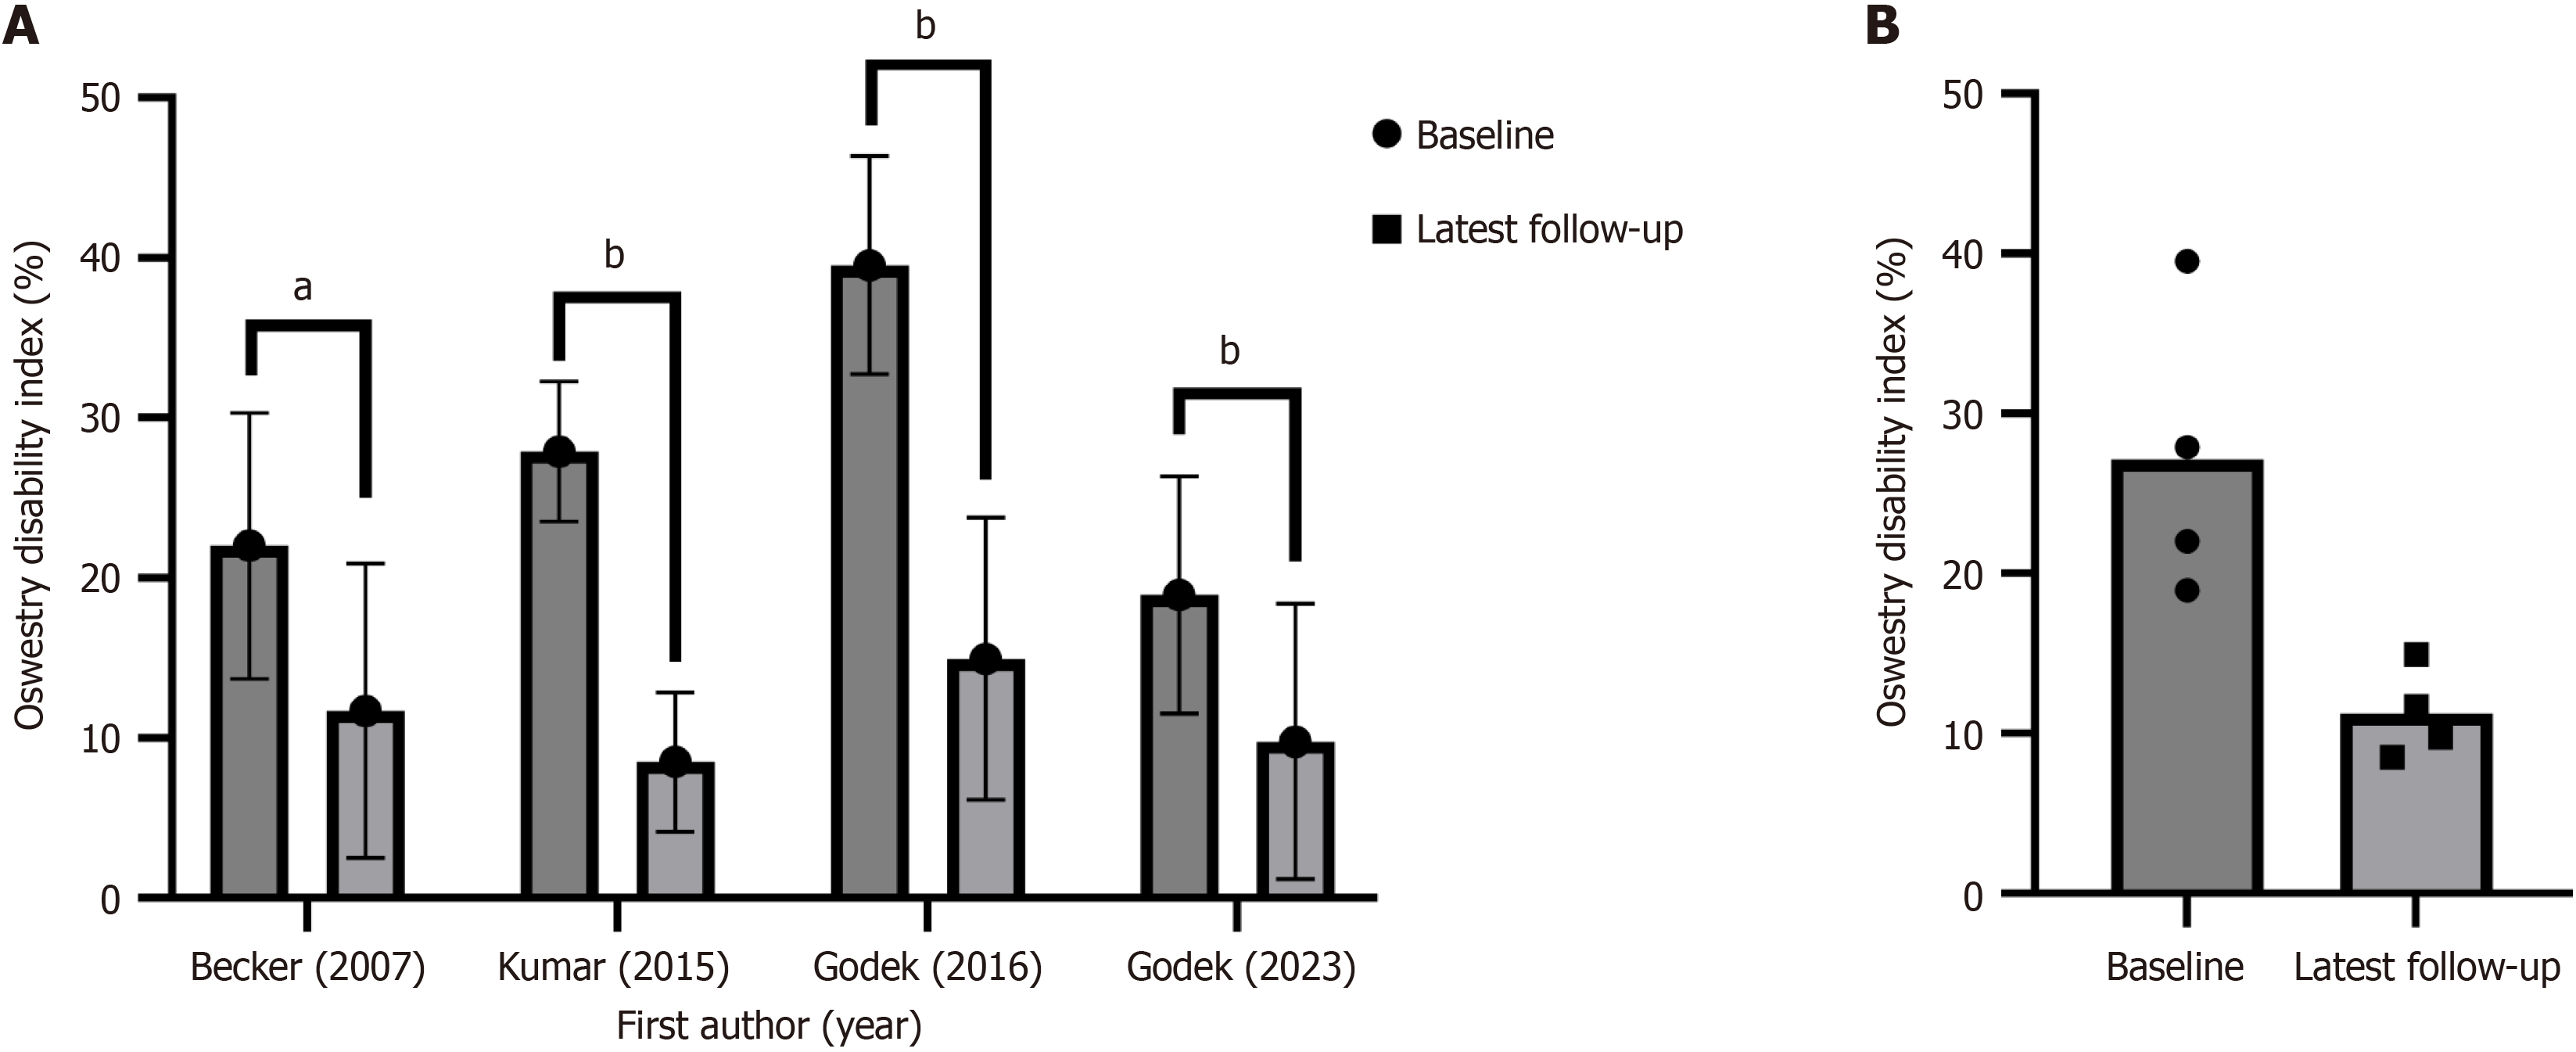
Figure 3 Patient Oswestry disability index at baseline and at latest follow-up.
A: The mean and standard deviation Oswestry disability index (ODI) are depicted at baseline and latest follow-up after autologous conditioned serum injection for each of four included studies Becker et al[15]: n = 32, HS et al[17]: n = 20, Godek et al[19]: n = 15. Godek et al[13]: n = 100; B: The combined mean ODI scores are depicted at baseline and follow-up as reported by Becker et al[15], HS et al[17], Godek et al[19], and Godek et al[13]. aP < 0.05; bP < 0.01.
- Citation: Rajkovic CJ, Merckling ML, Lee AW, Subah G, Malhotra A, Thomas ZD, Zeller SL, Wainwright JV, Kinon MD. Conservative management of spinal pathology with autologous conditioned serum: A systematic review of the literature. World J Orthop 2024; 15(9): 870-881
- URL: https://www.wjgnet.com/2218-5836/full/v15/i9/870.htm
- DOI: https://dx.doi.org/10.5312/wjo.v15.i9.870


