Copyright
©The Author(s) 2024.
World J Orthop. Apr 18, 2024; 15(4): 363-378
Published online Apr 18, 2024. doi: 10.5312/wjo.v15.i4.363
Published online Apr 18, 2024. doi: 10.5312/wjo.v15.i4.363
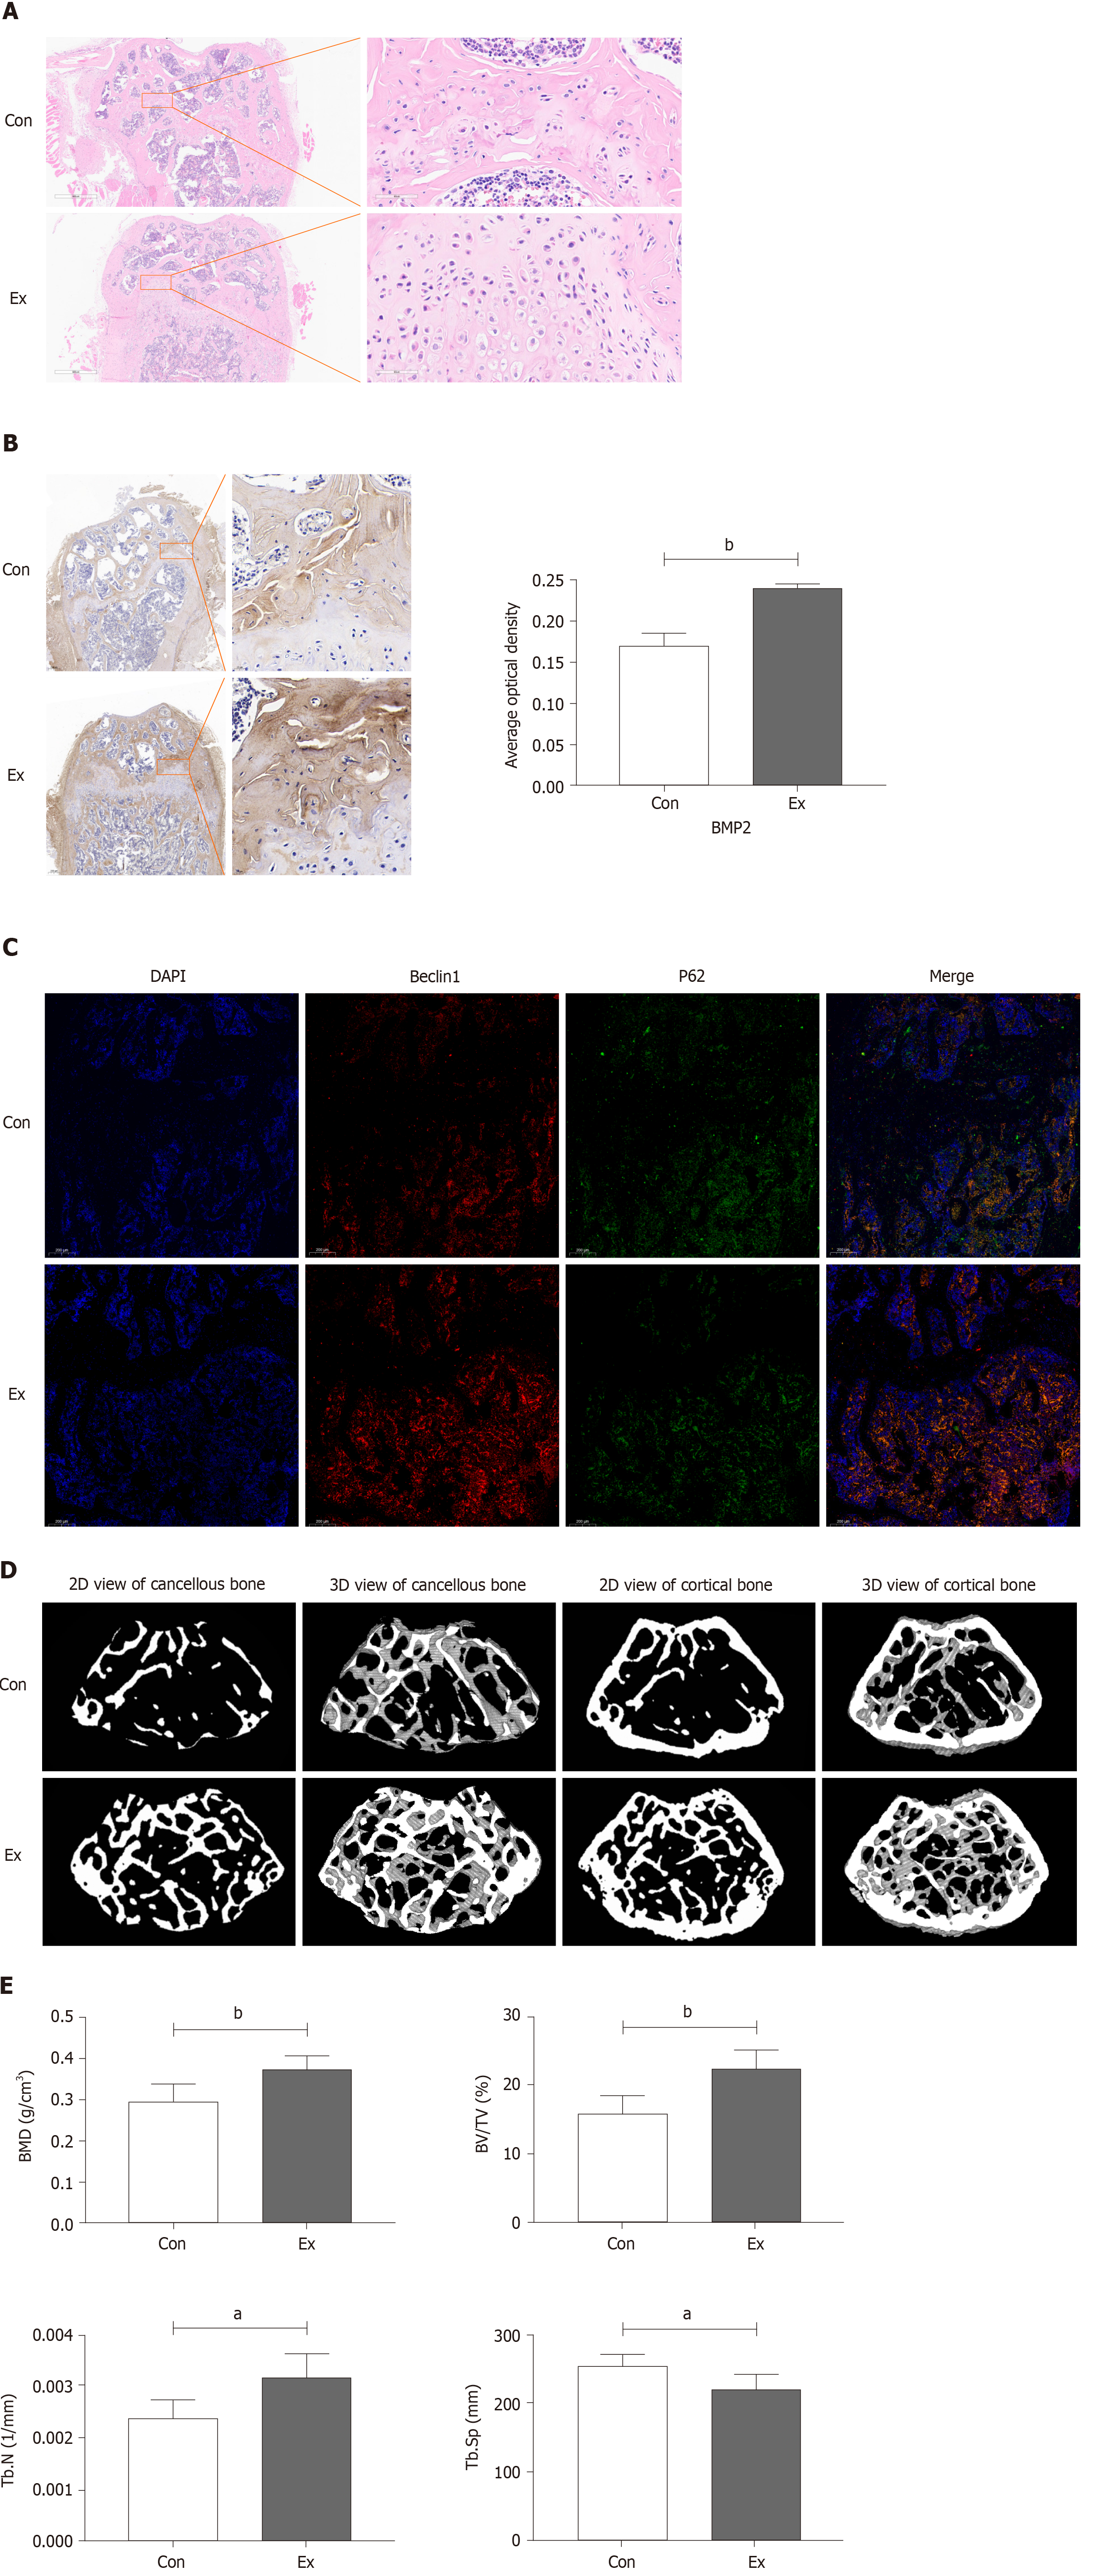
Figure 1 Exercise promotes bone formation in growing mice.
A: Hematoxylin-eosin staining of mouse femur; B: Changes in bone morphogenetic protein 2 protein expression in mouse femur by immunohistochemical staining; C: Changes in protein expression of Beclin1 and P62 in mouse femur by immunofluorescence staining; D and E: Reconstruction images and bone morphometric indices of changes in the distal femur in mice by micro-CT scanning. n = 6, aP < 0.05, bP < 0.01. Con: Control group; Ex: Treadmill exercise group.
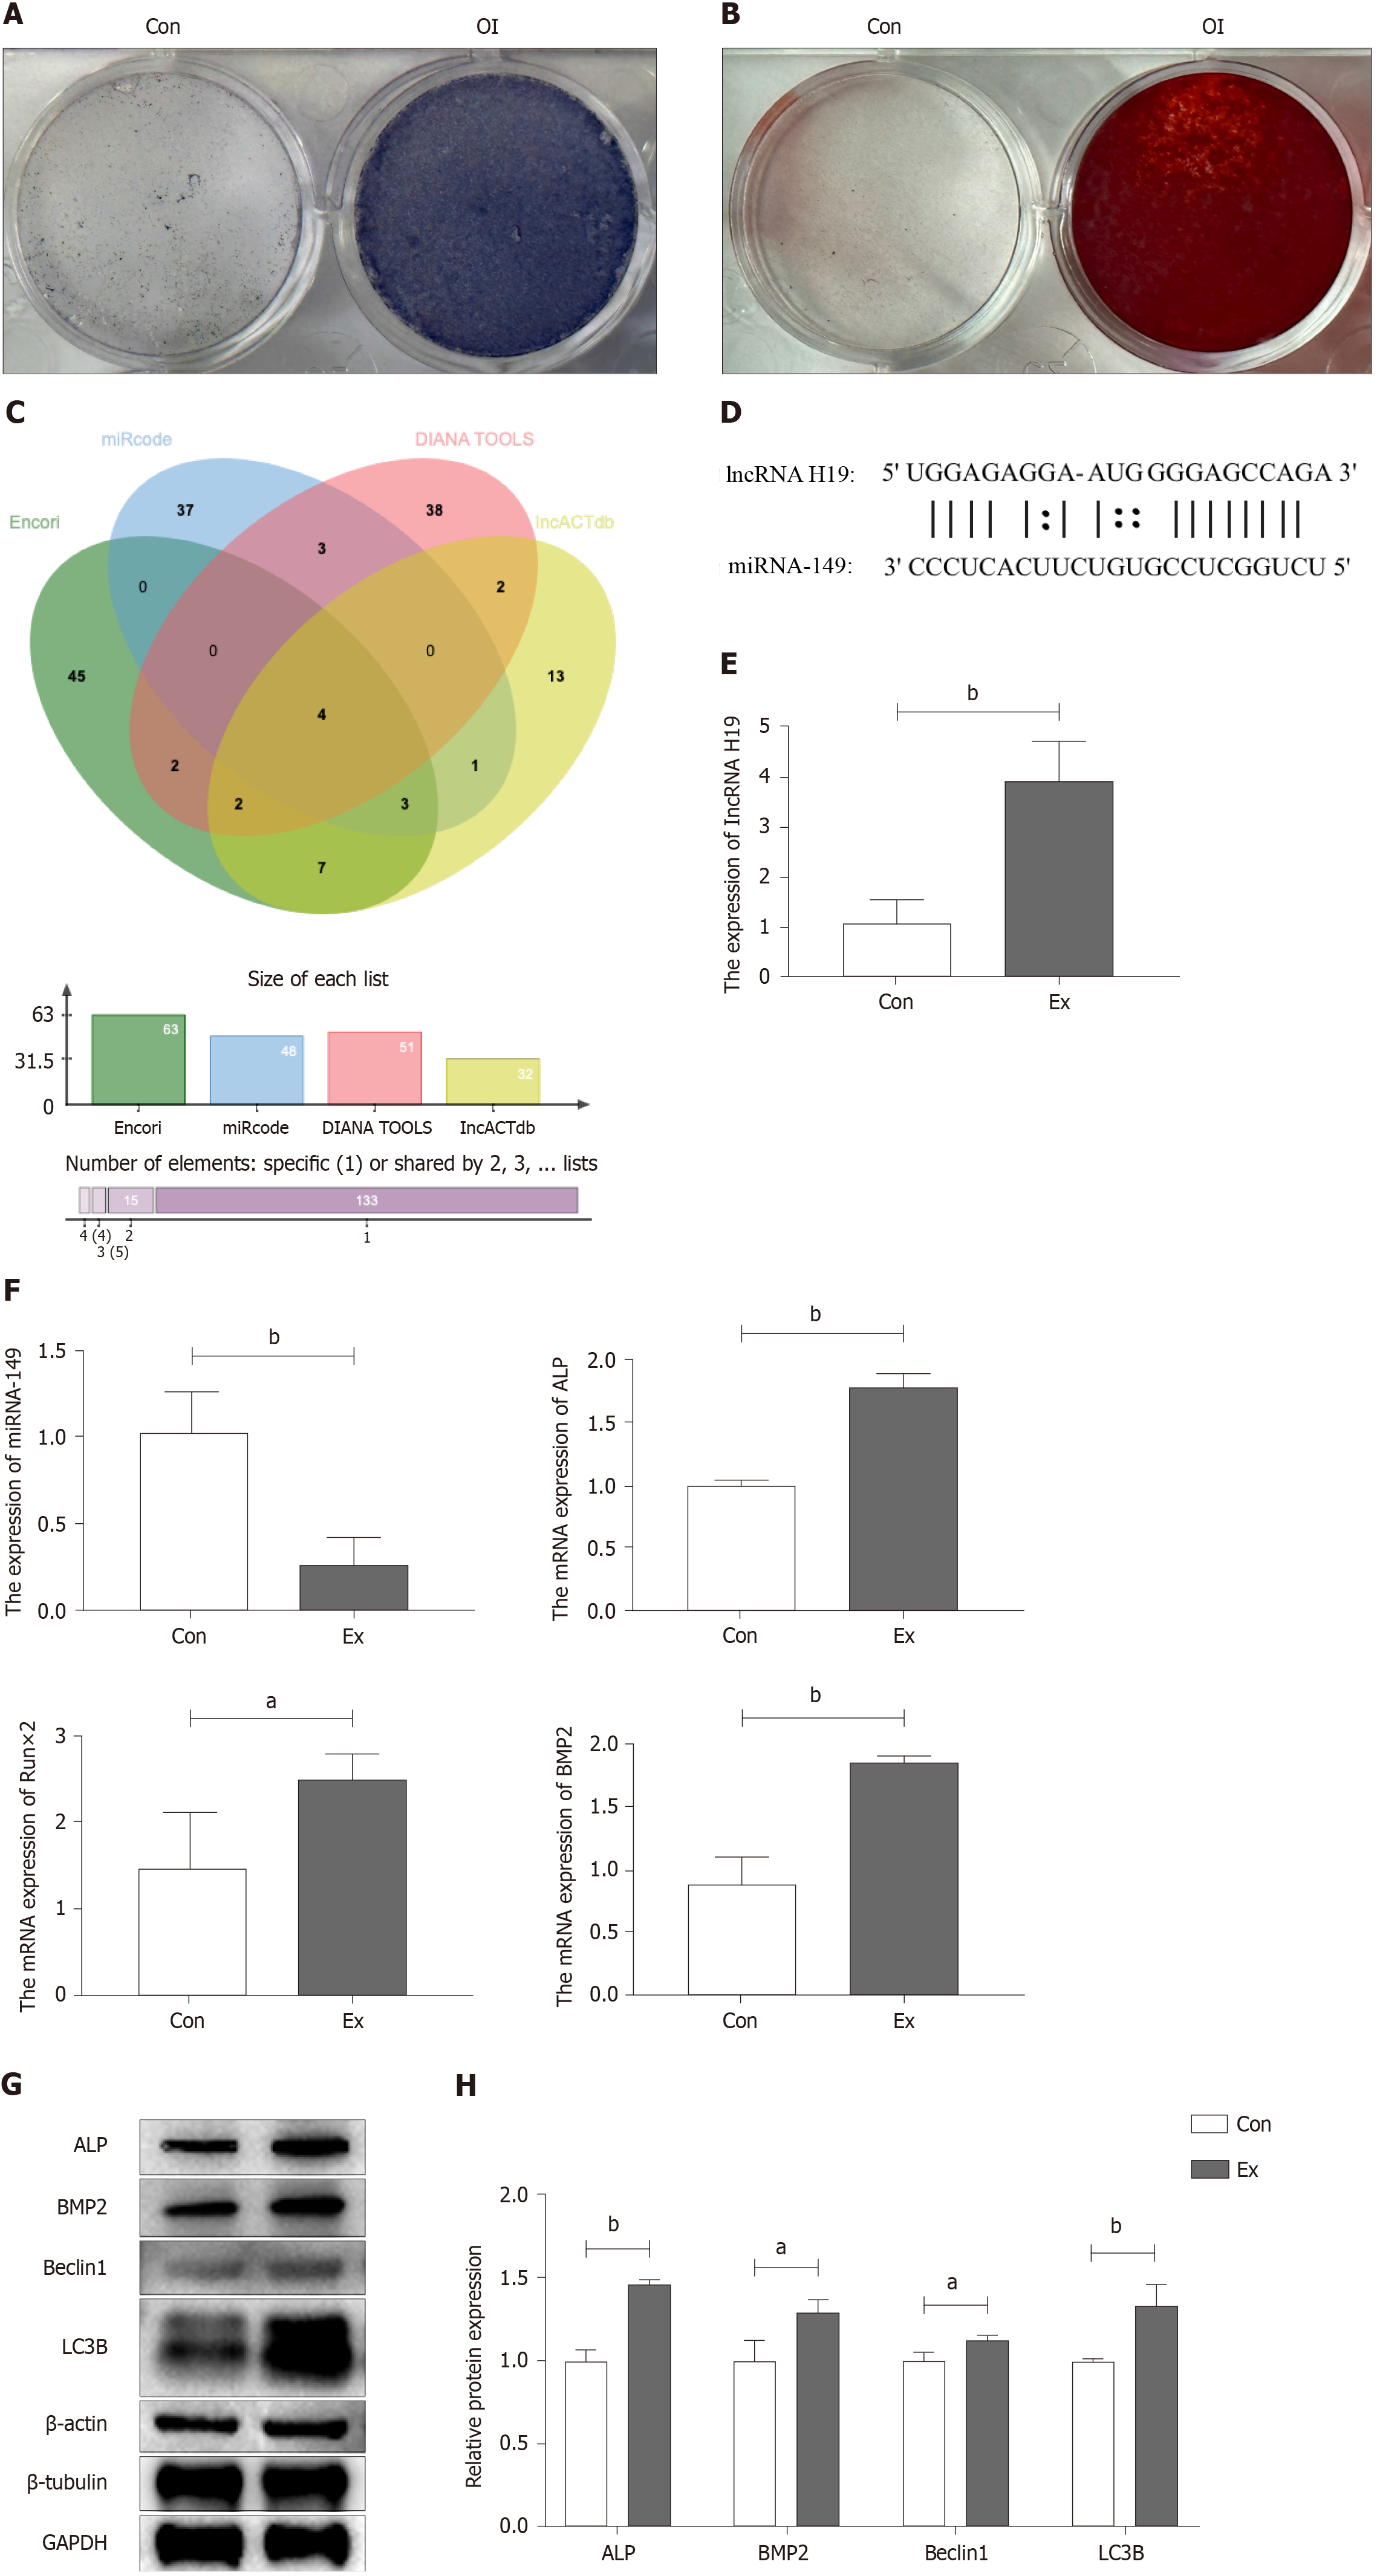
Figure 2 Exercise promotes osteogenic differentiation of mouse bone mesenchymal stem cells.
A: Alkaline phase staining of mouse bone mesenchymal stem cells (BMSCs) at 7 d of osteogenic differentiation induction; B: Alizarin red staining of mouse BMSCs at 14 d of osteogenic differentiation induction; C and D: Identification of potential miRNAs targets of lncRNA H19 by bioinformatics analysis; E and F: Changes in mRNA levels of lncRNA H19, miR-149, and osteogenic differentiation-associated markers after induction of osteogenic differentiation in mouse primary BMSCs by RT-qPCR; G and H: Changes in protein level of osteogenic differentiation-related marker and autophagy-related marker after induction of osteogenic differentiation in mouse primary BMSCs. n = 3, aP < 0.05, bP < 0.01. Con: Control group; OI: Osteogenic differentiation induction; Ex: Treadmill exercise group.
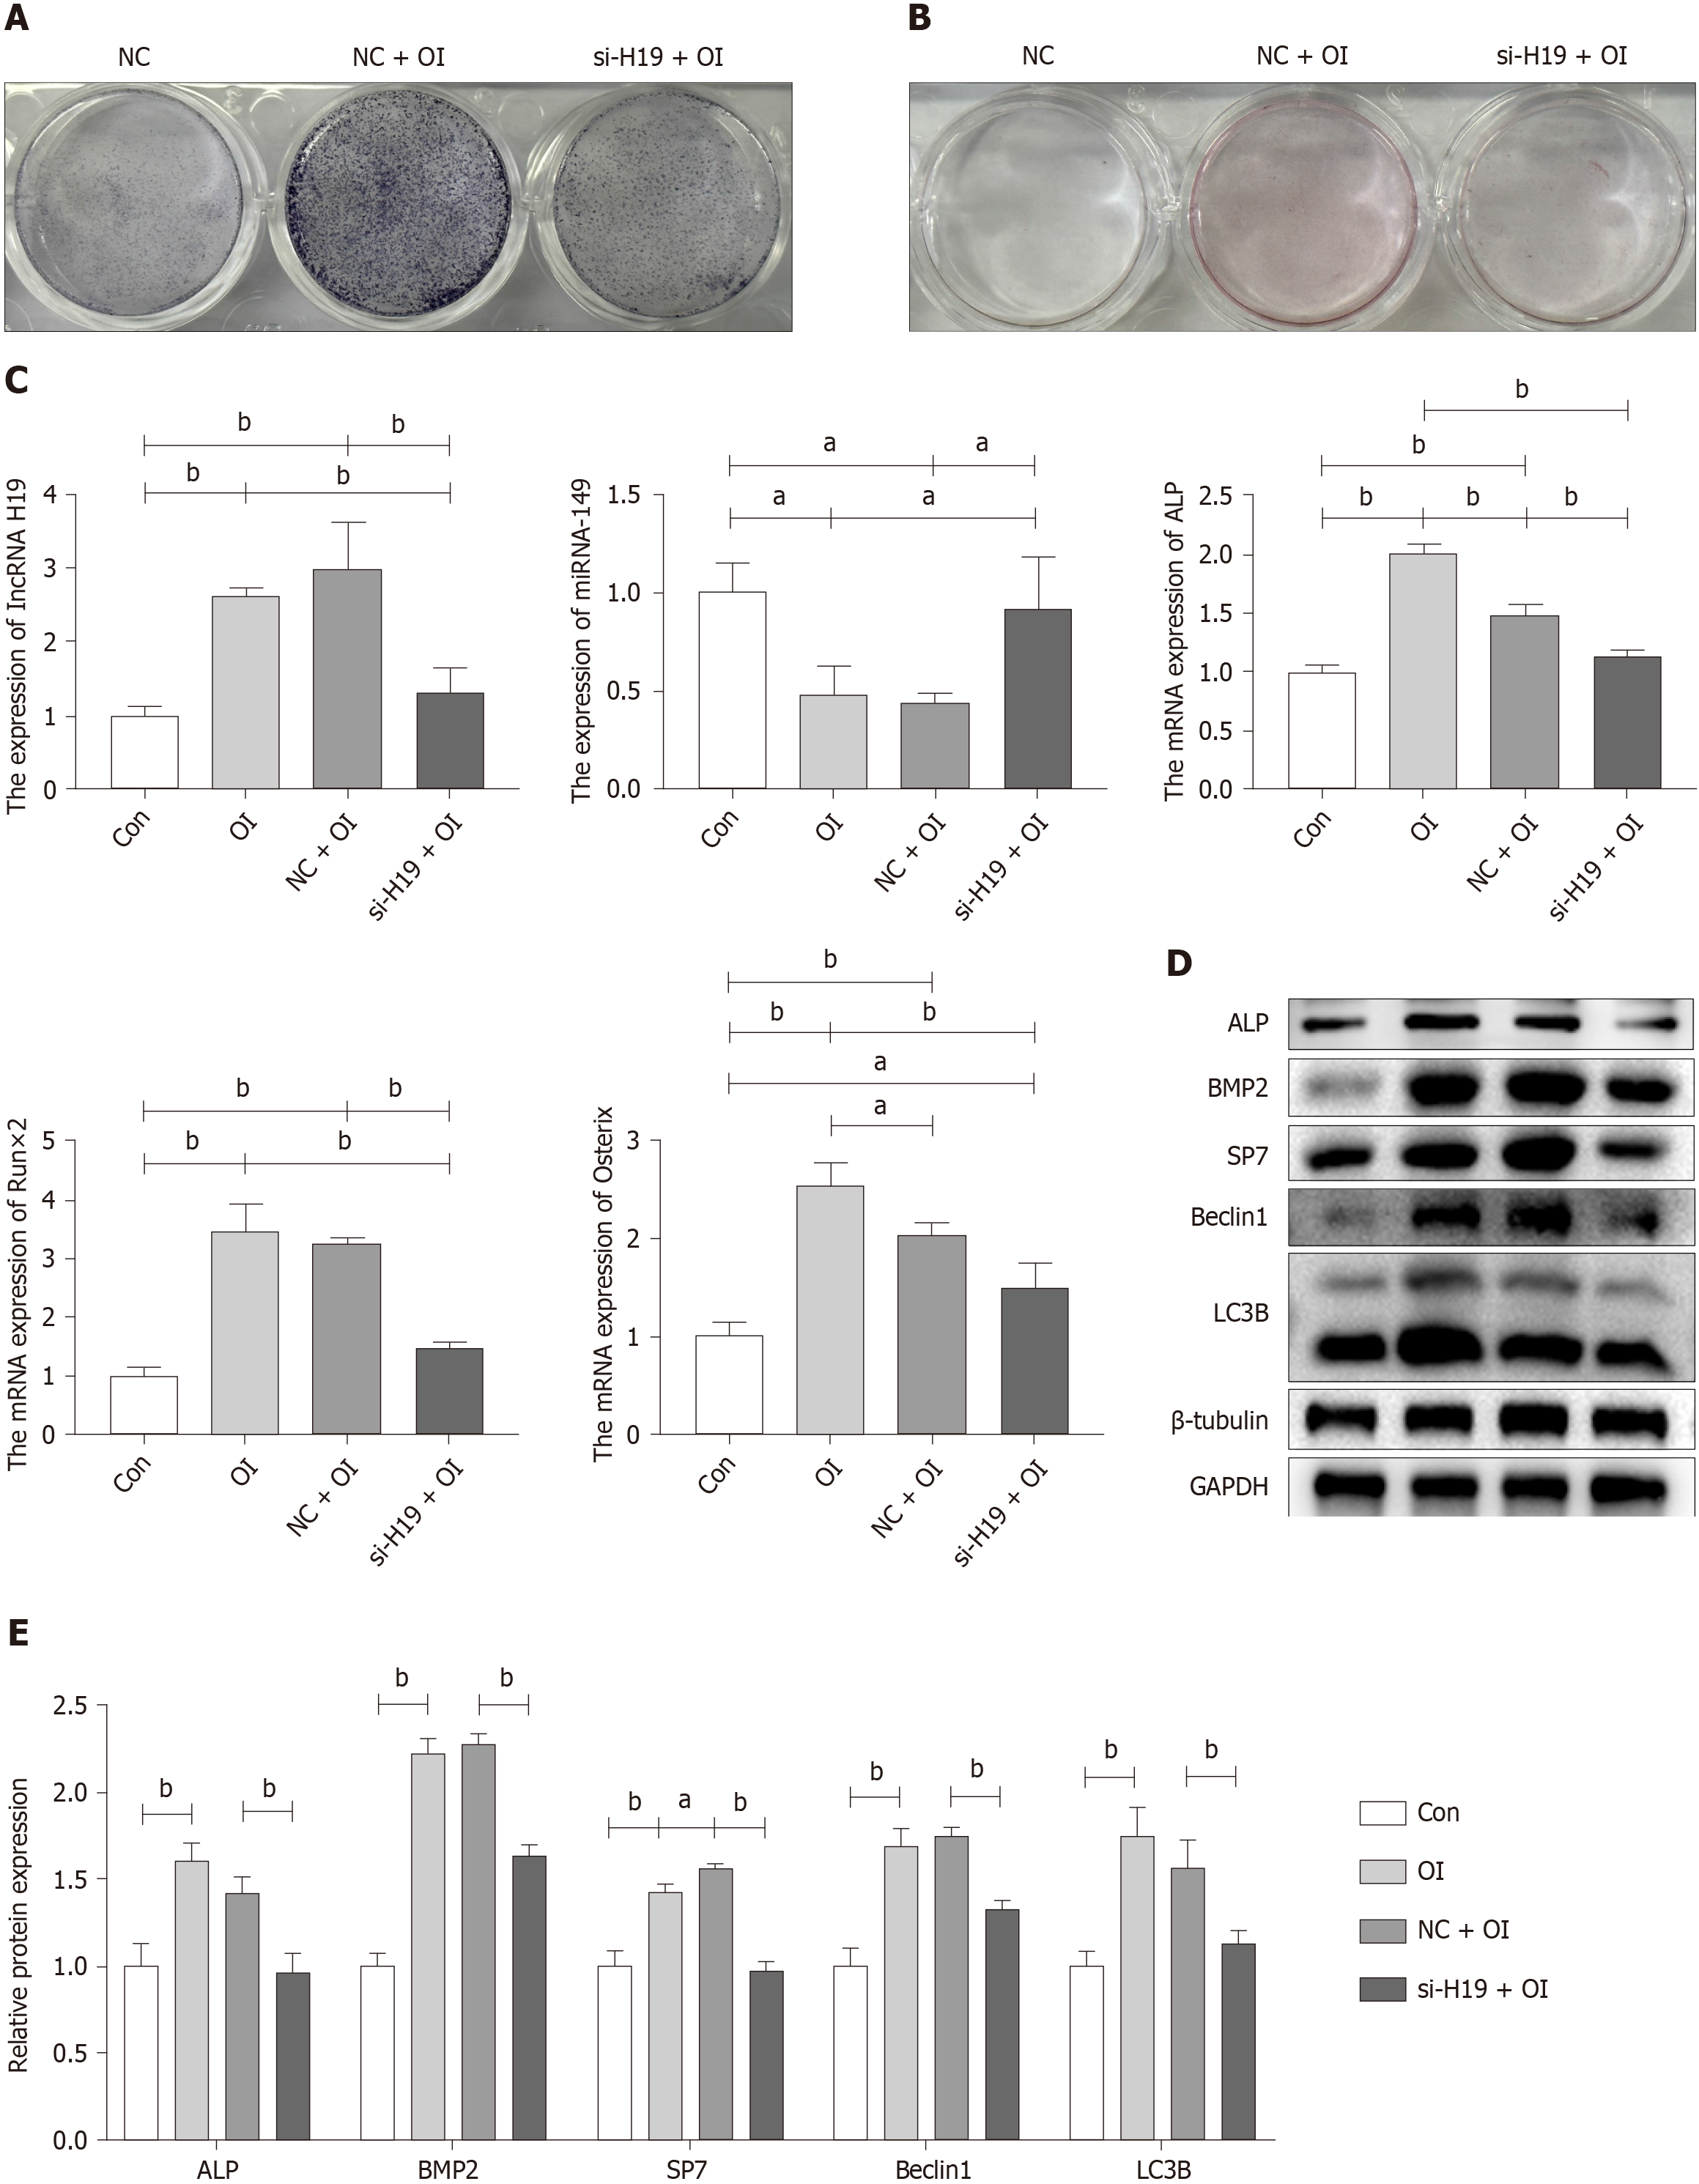
Figure 3 Exercise promotes osteogenic differentiation of bone mesenchymal stem cells through upregulation of lncRNA H19/miR-149.
A: Alkaline phase staining of bone mesenchymal stem cells (BMSCs) 3 d after osteogenic induction of differentiation; B: Alizarin red staining of BMSCs 3 d after osteogenic induction of differentiation; C: Gene expression changes of lncRNA H19, miR-149 and osteogenic differentiation-related markers in BMSCs after osteogenic differentiation induction and si-lncRNA H19 interference by RT-qPCR; D and E: Protein expression changes of osteogenic differentiation-associated markers and autophagy-associated markers in BMSCs after osteogenic differentiation induction and si-lncRNA H19 interference by WB technique. n = 3, aP < 0.05, bP < 0.01 . Con: Control group; NC: Negative control group; OI: Osteogenic differentiation induction group.
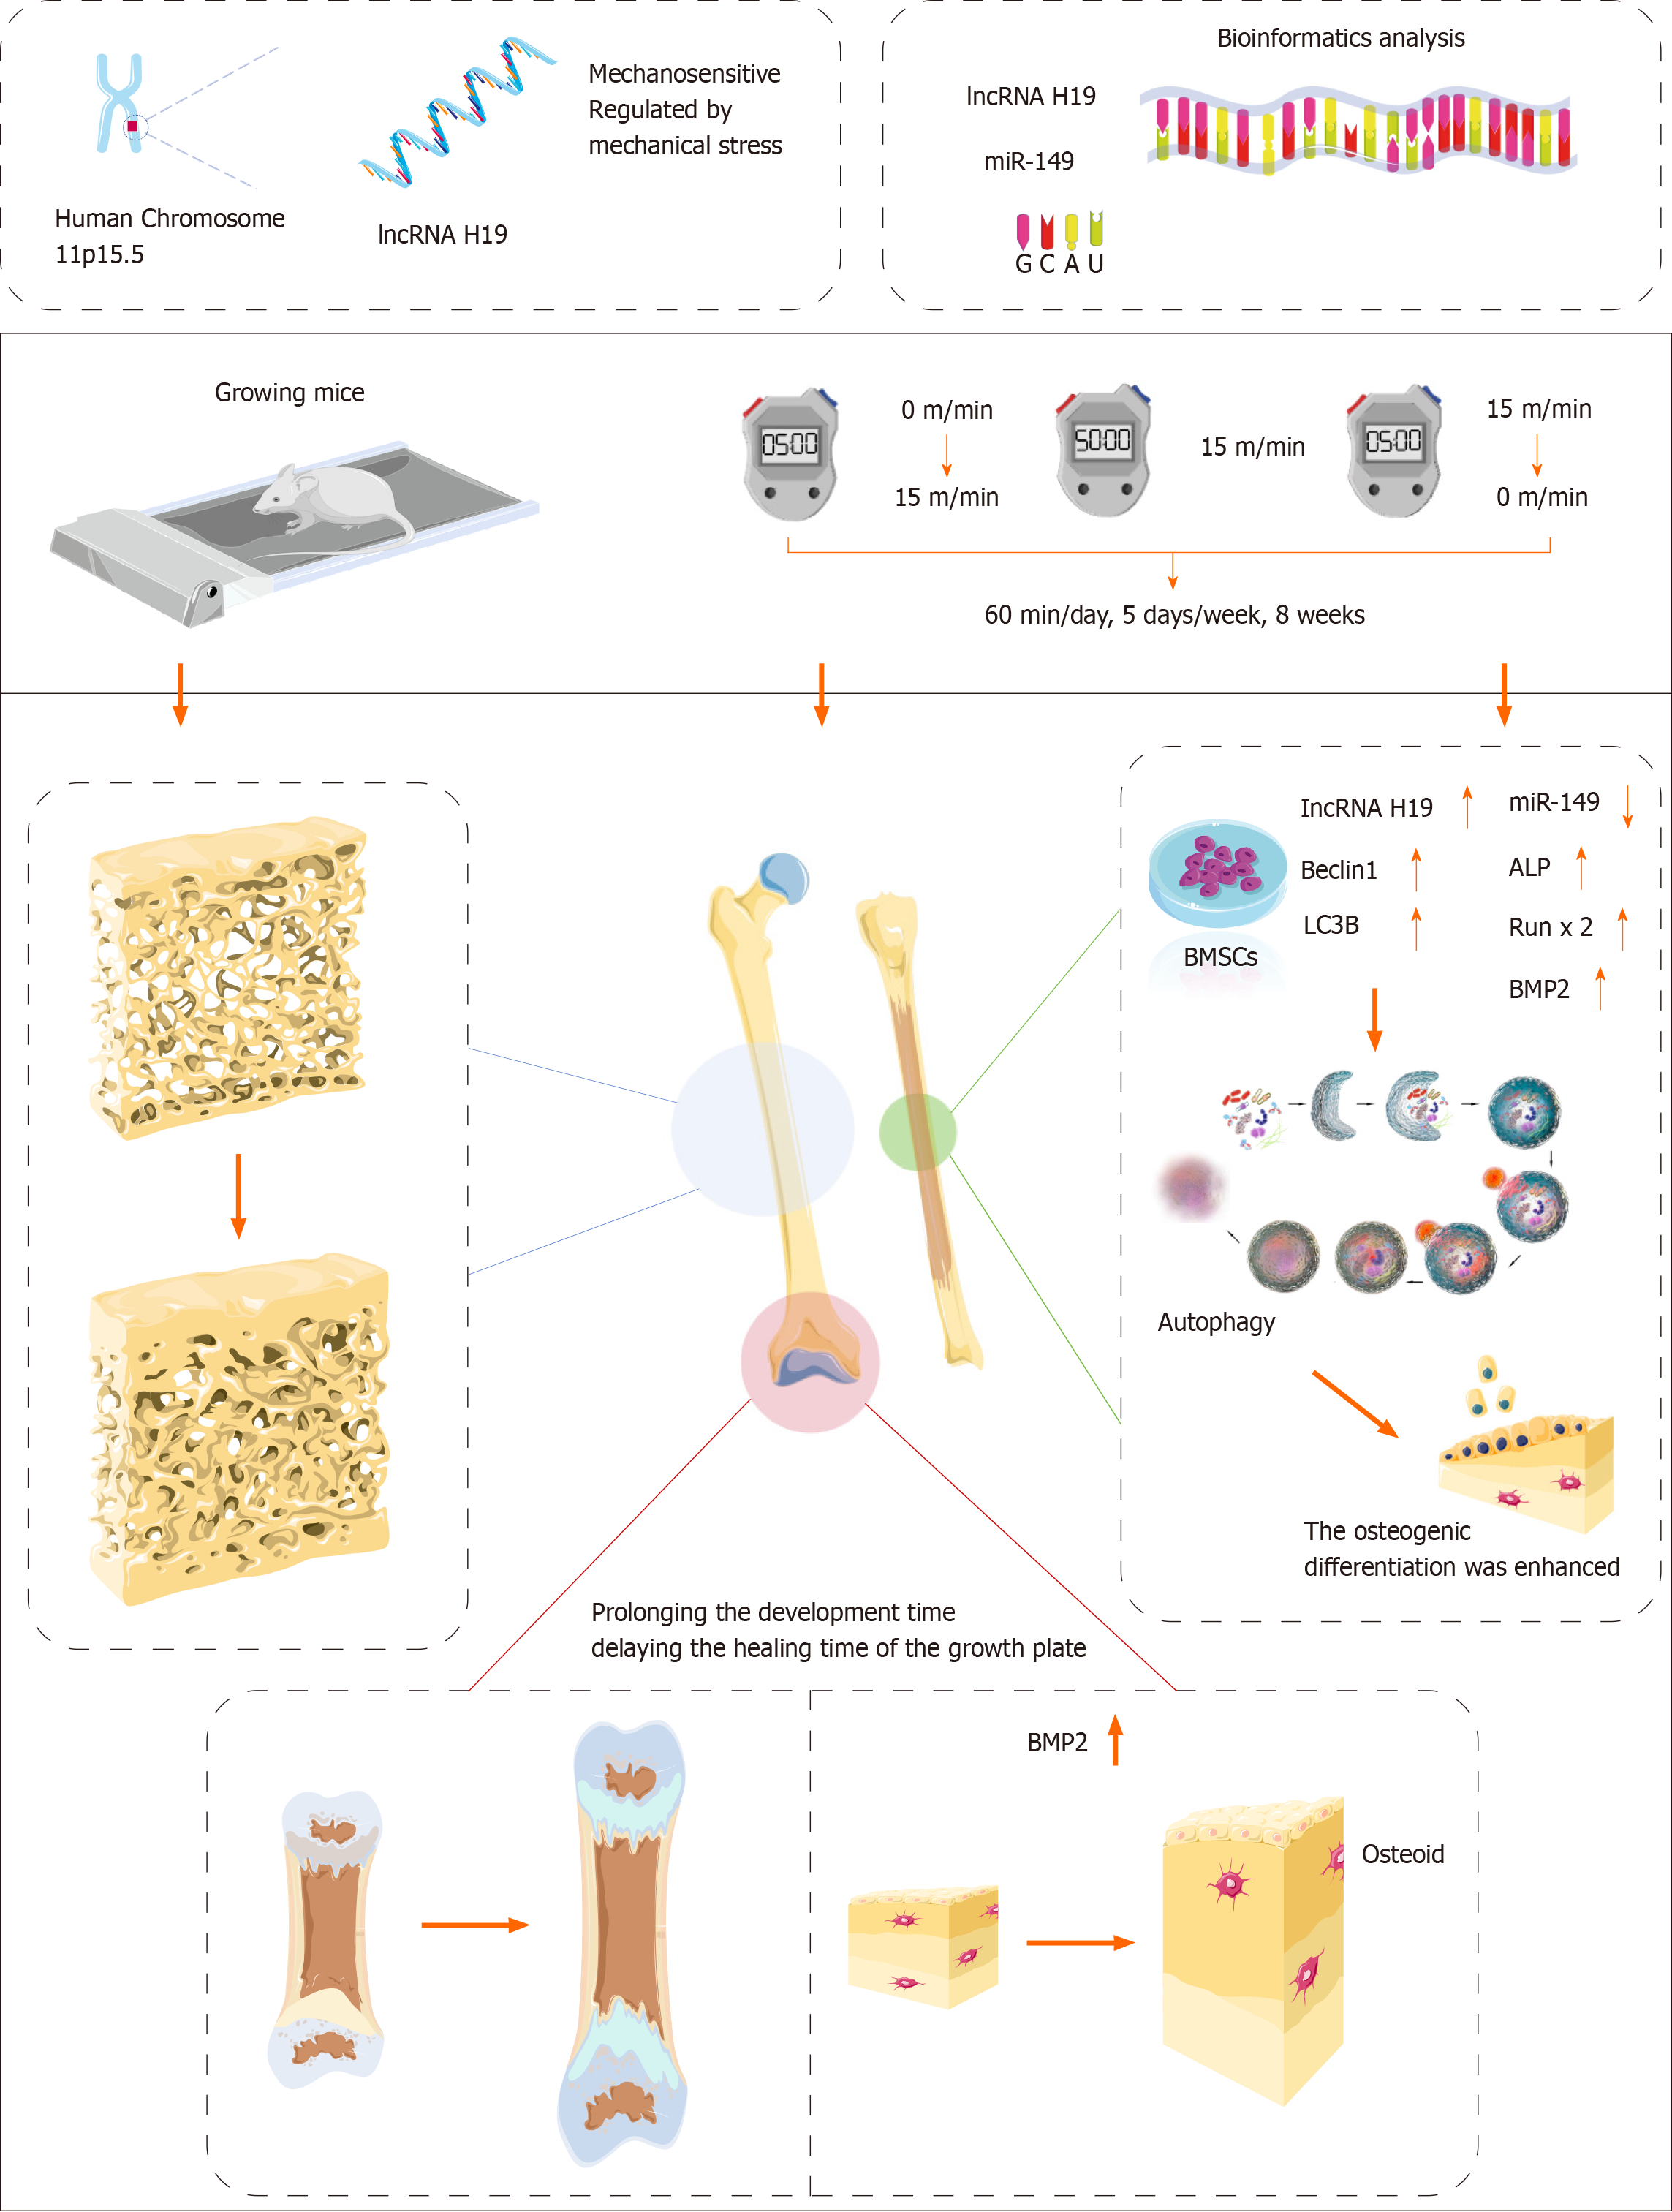
Figure 4
Summary diagram of this study.
- Citation: Zhou XC, Wang DX, Zhang CY, Yang YJ, Zhao RB, Liu SY, Ni GX. Exercise promotes osteogenic differentiation by activating the long non-coding RNA H19/microRNA-149 axis. World J Orthop 2024; 15(4): 363-378
- URL: https://www.wjgnet.com/2218-5836/full/v15/i4/363.htm
- DOI: https://dx.doi.org/10.5312/wjo.v15.i4.363


