Copyright
©The Author(s) 2023.
World J Orthop. Jun 18, 2023; 14(6): 485-501
Published online Jun 18, 2023. doi: 10.5312/wjo.v14.i6.485
Published online Jun 18, 2023. doi: 10.5312/wjo.v14.i6.485
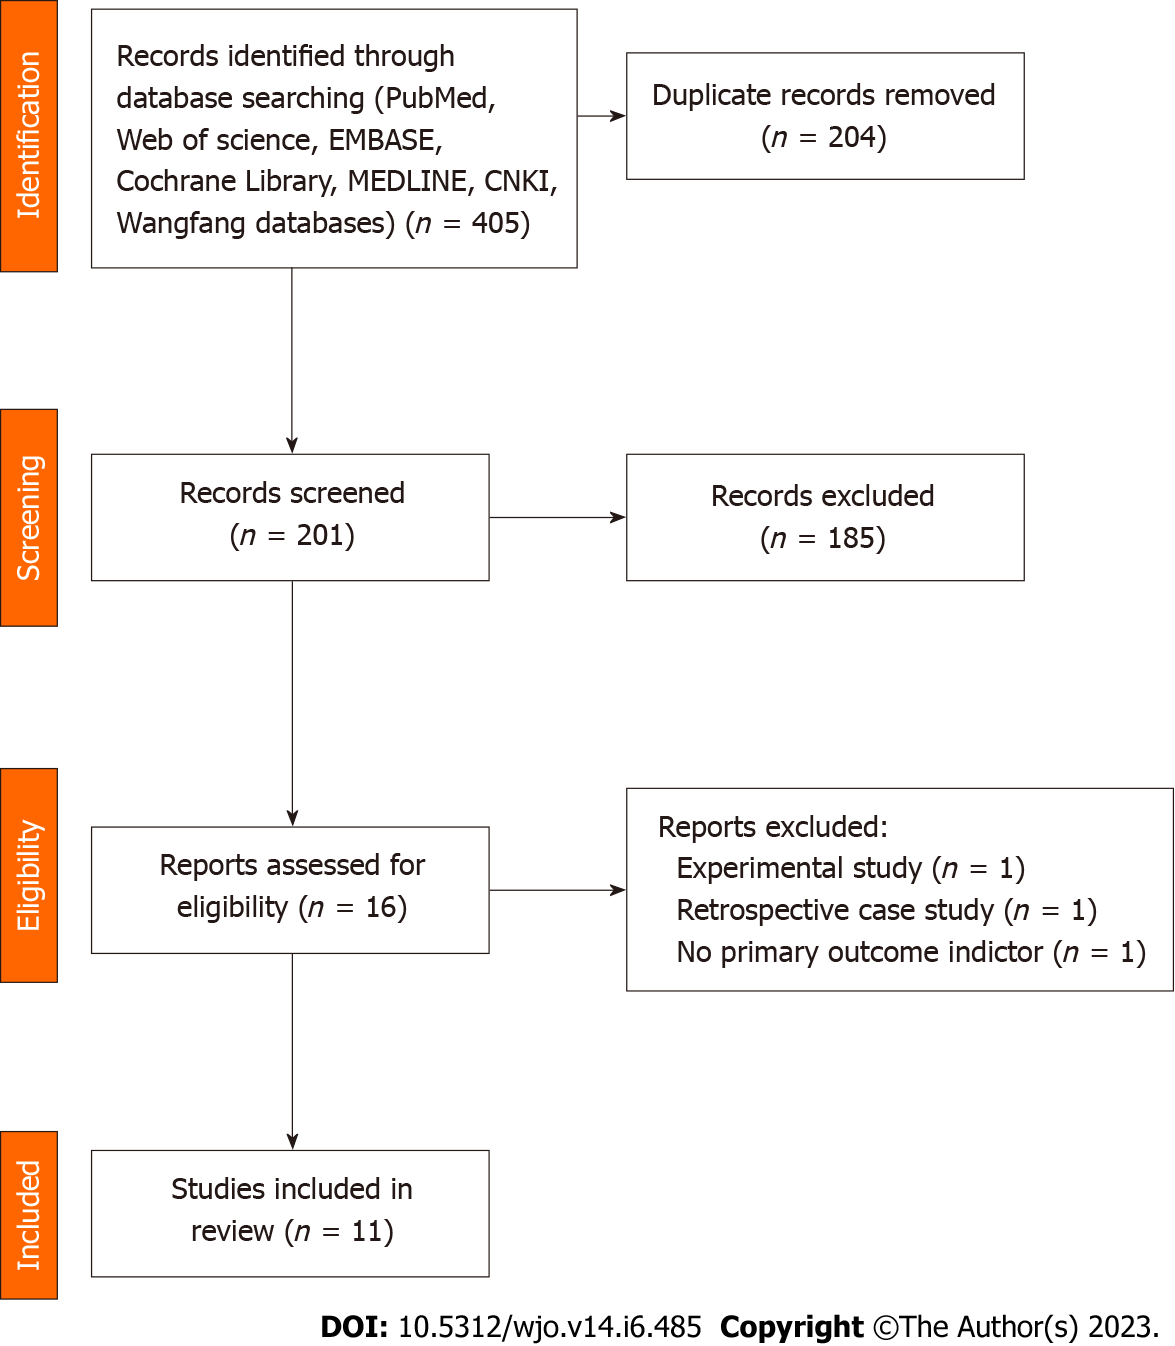
Figure 1 Flow diagram of study selection.
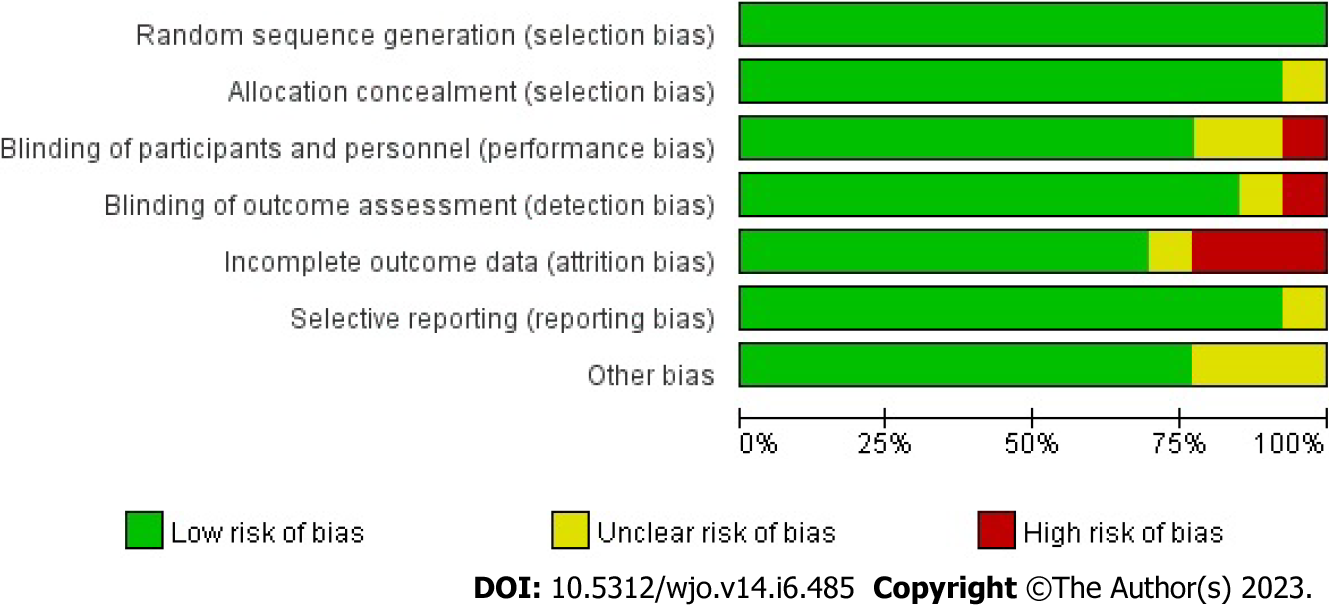
Figure 2 Proportional risk of bias graph: Judgement of the percentage of bias items arising from all included studies.
Figure 3 Risk of bias summary diagram: Assessment of specific items of bias arising from all included studies.
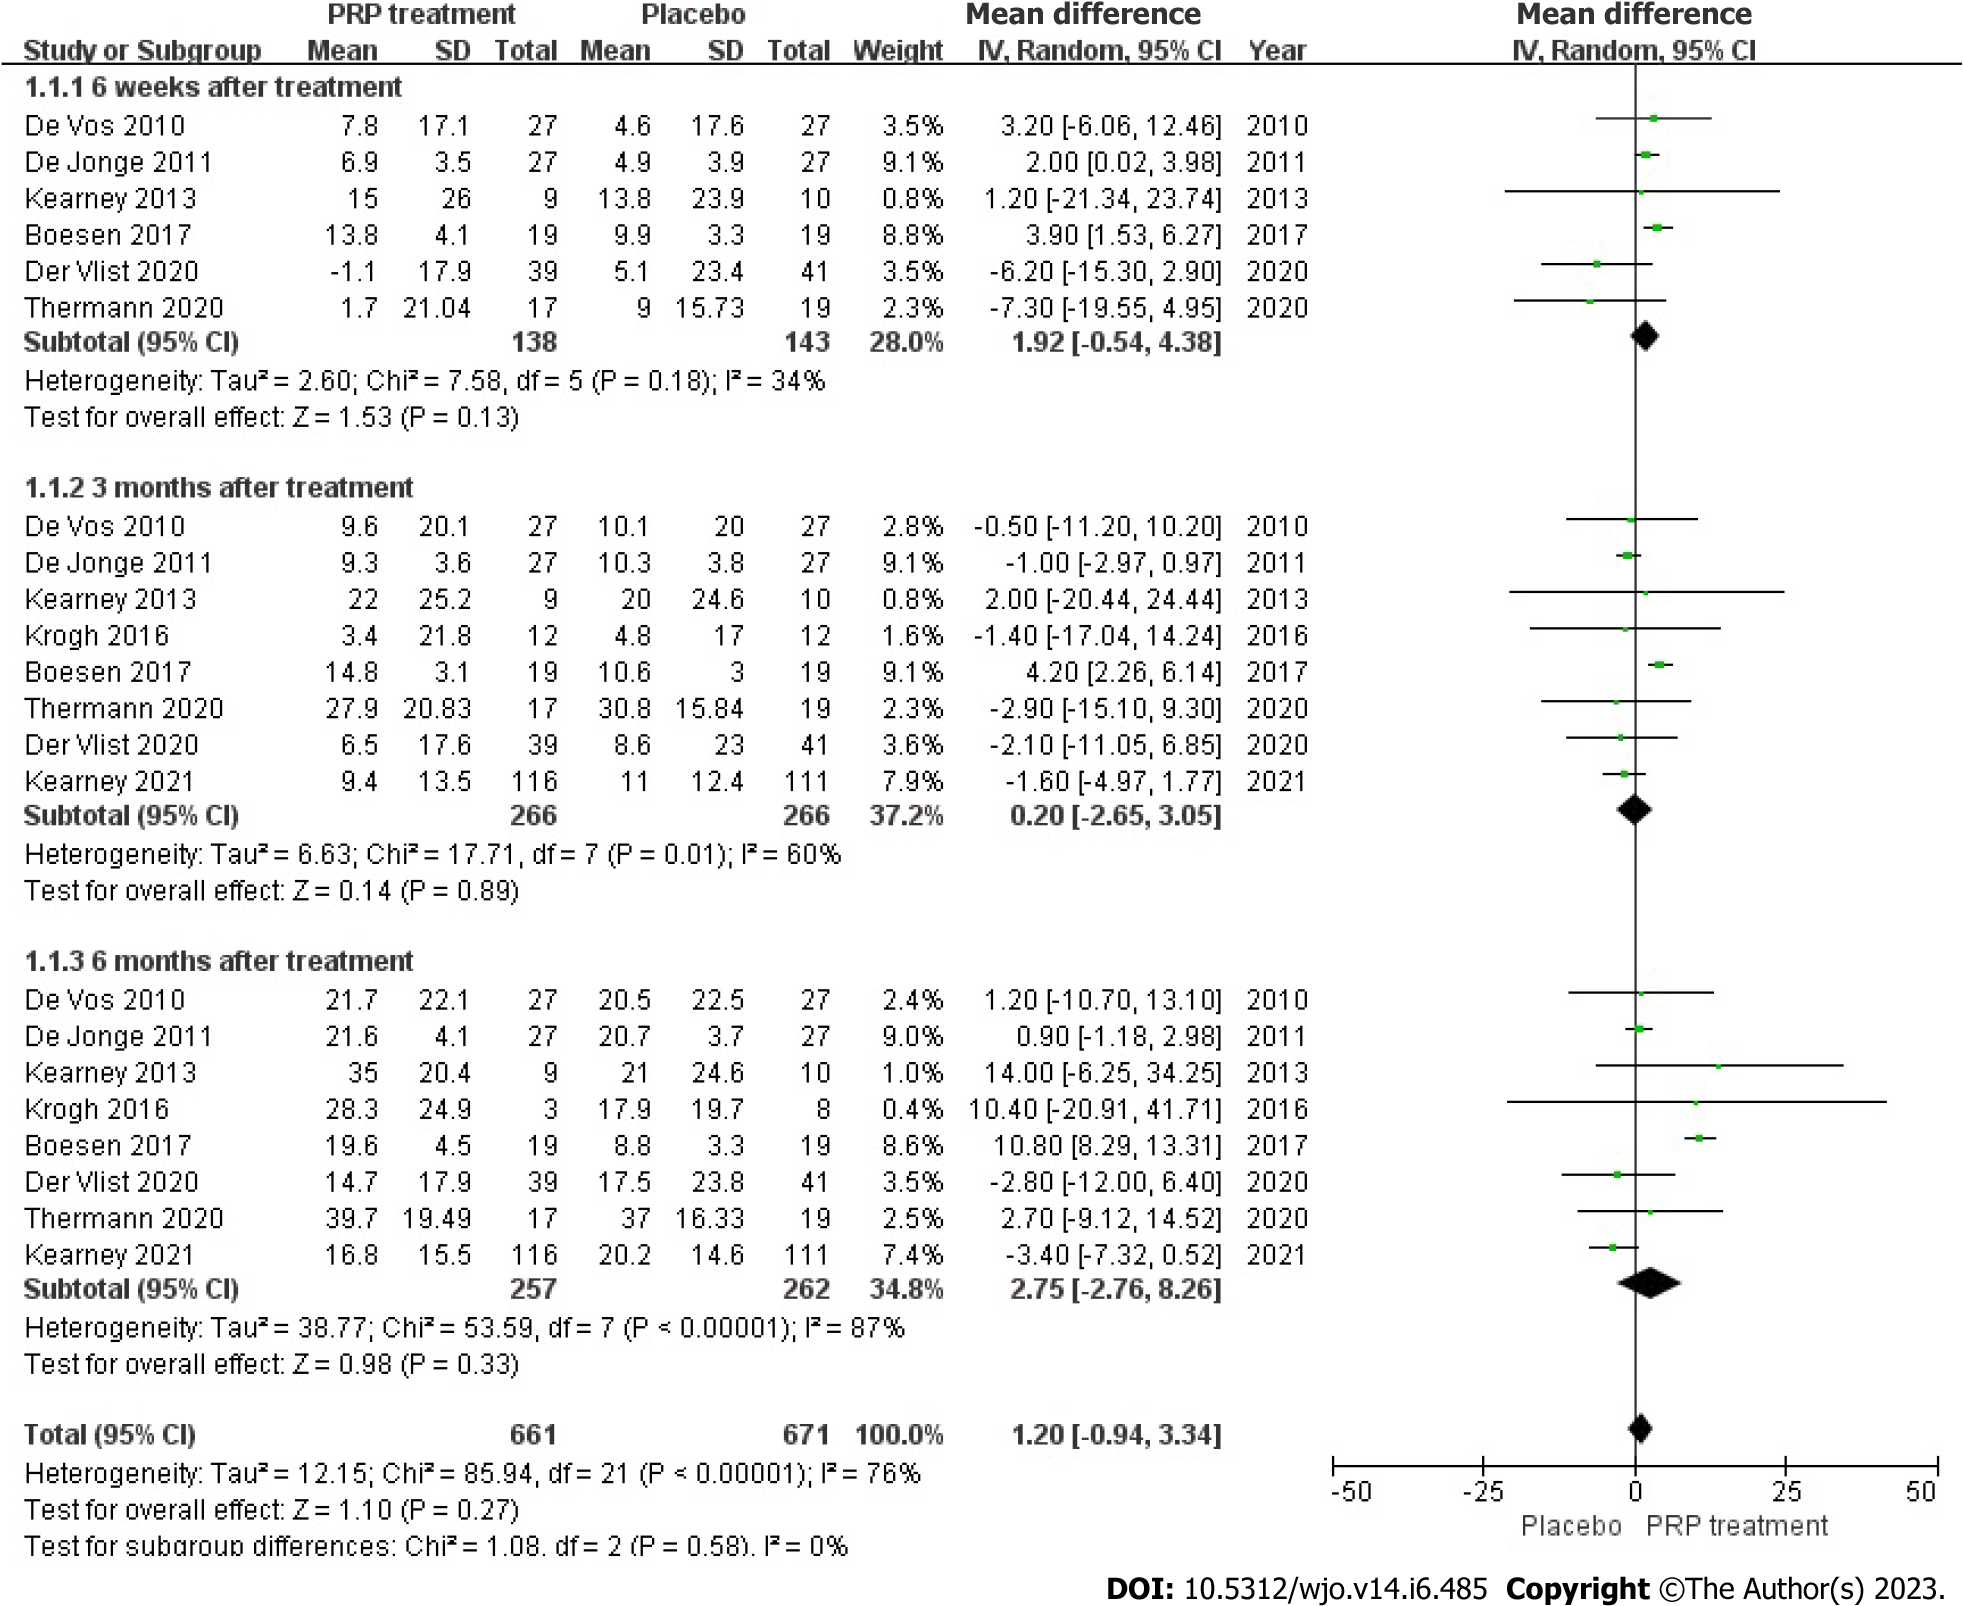
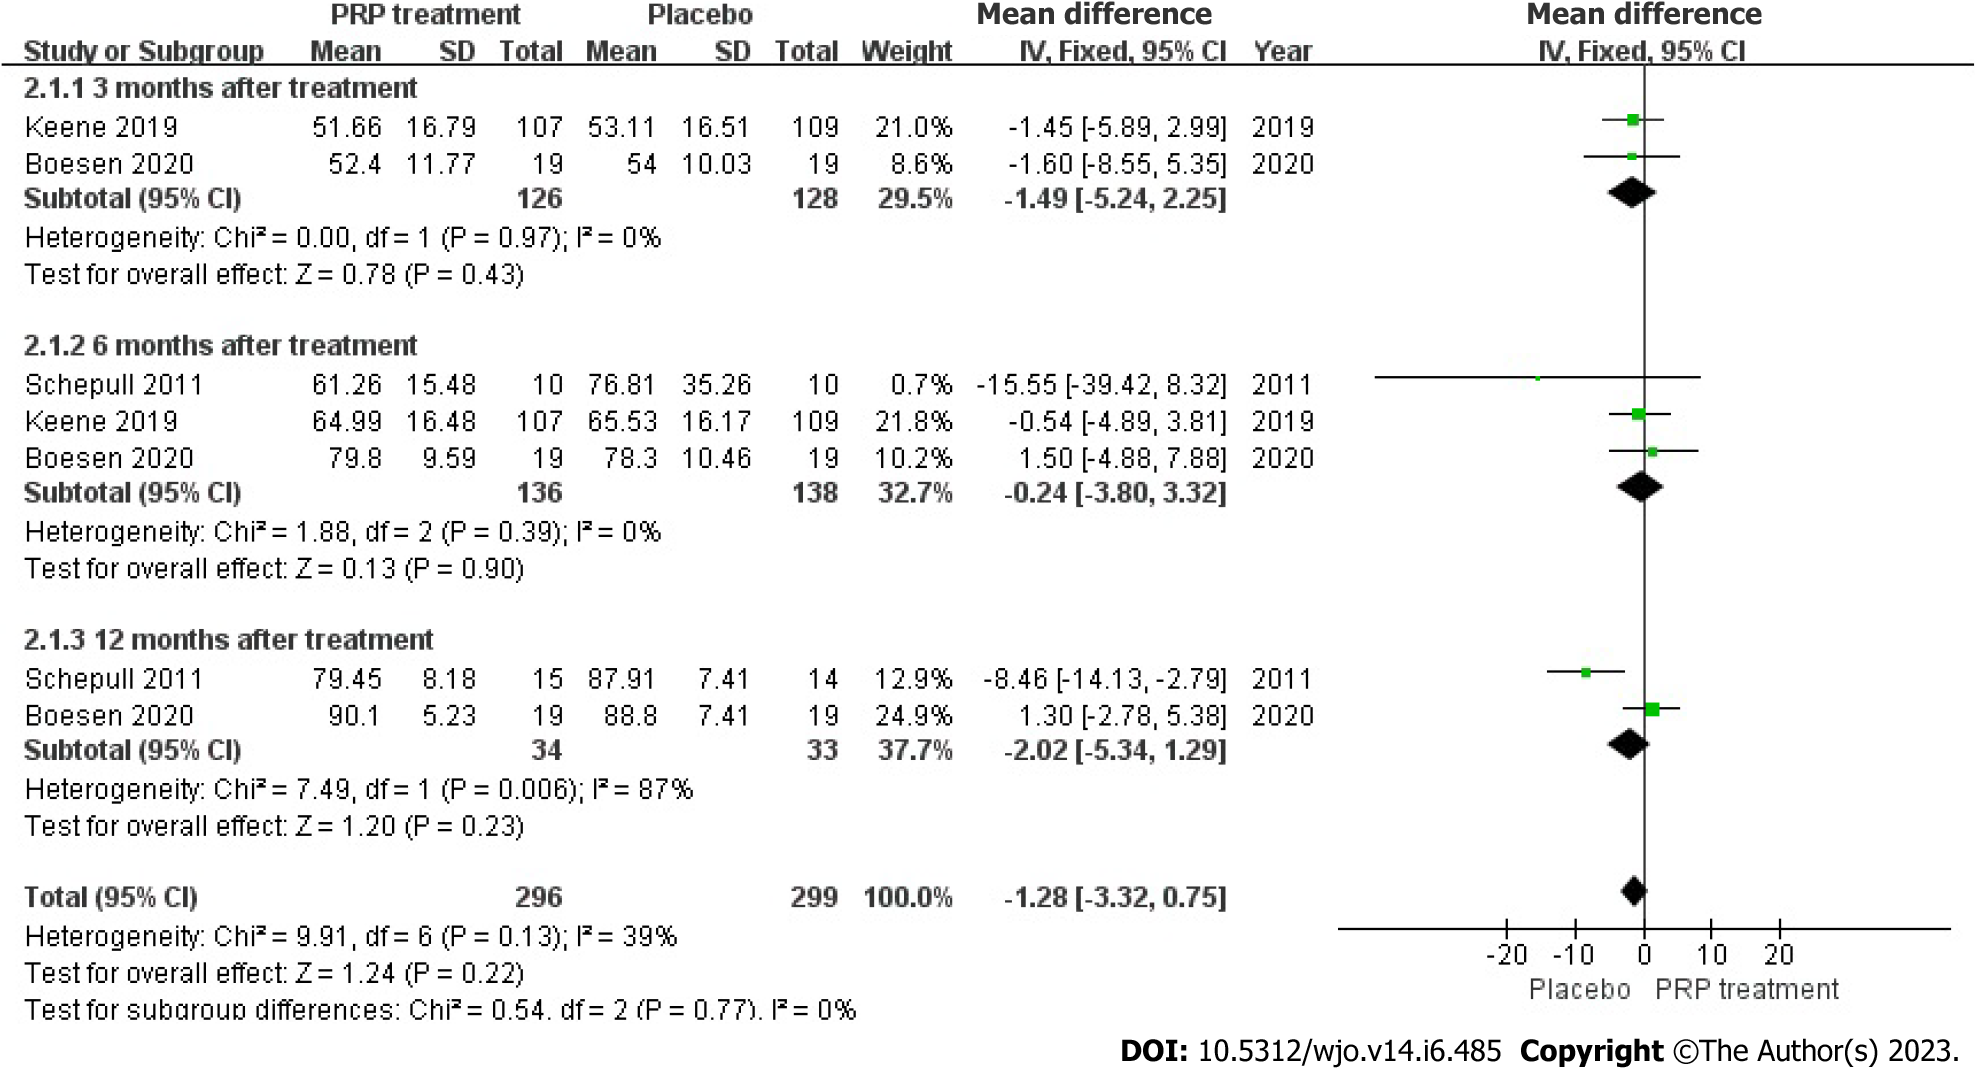
Figure 4 Forest plot of change values for Victorian Institute Ankle Function Scale scores.
PRP: Platelet-Rich Plasma.
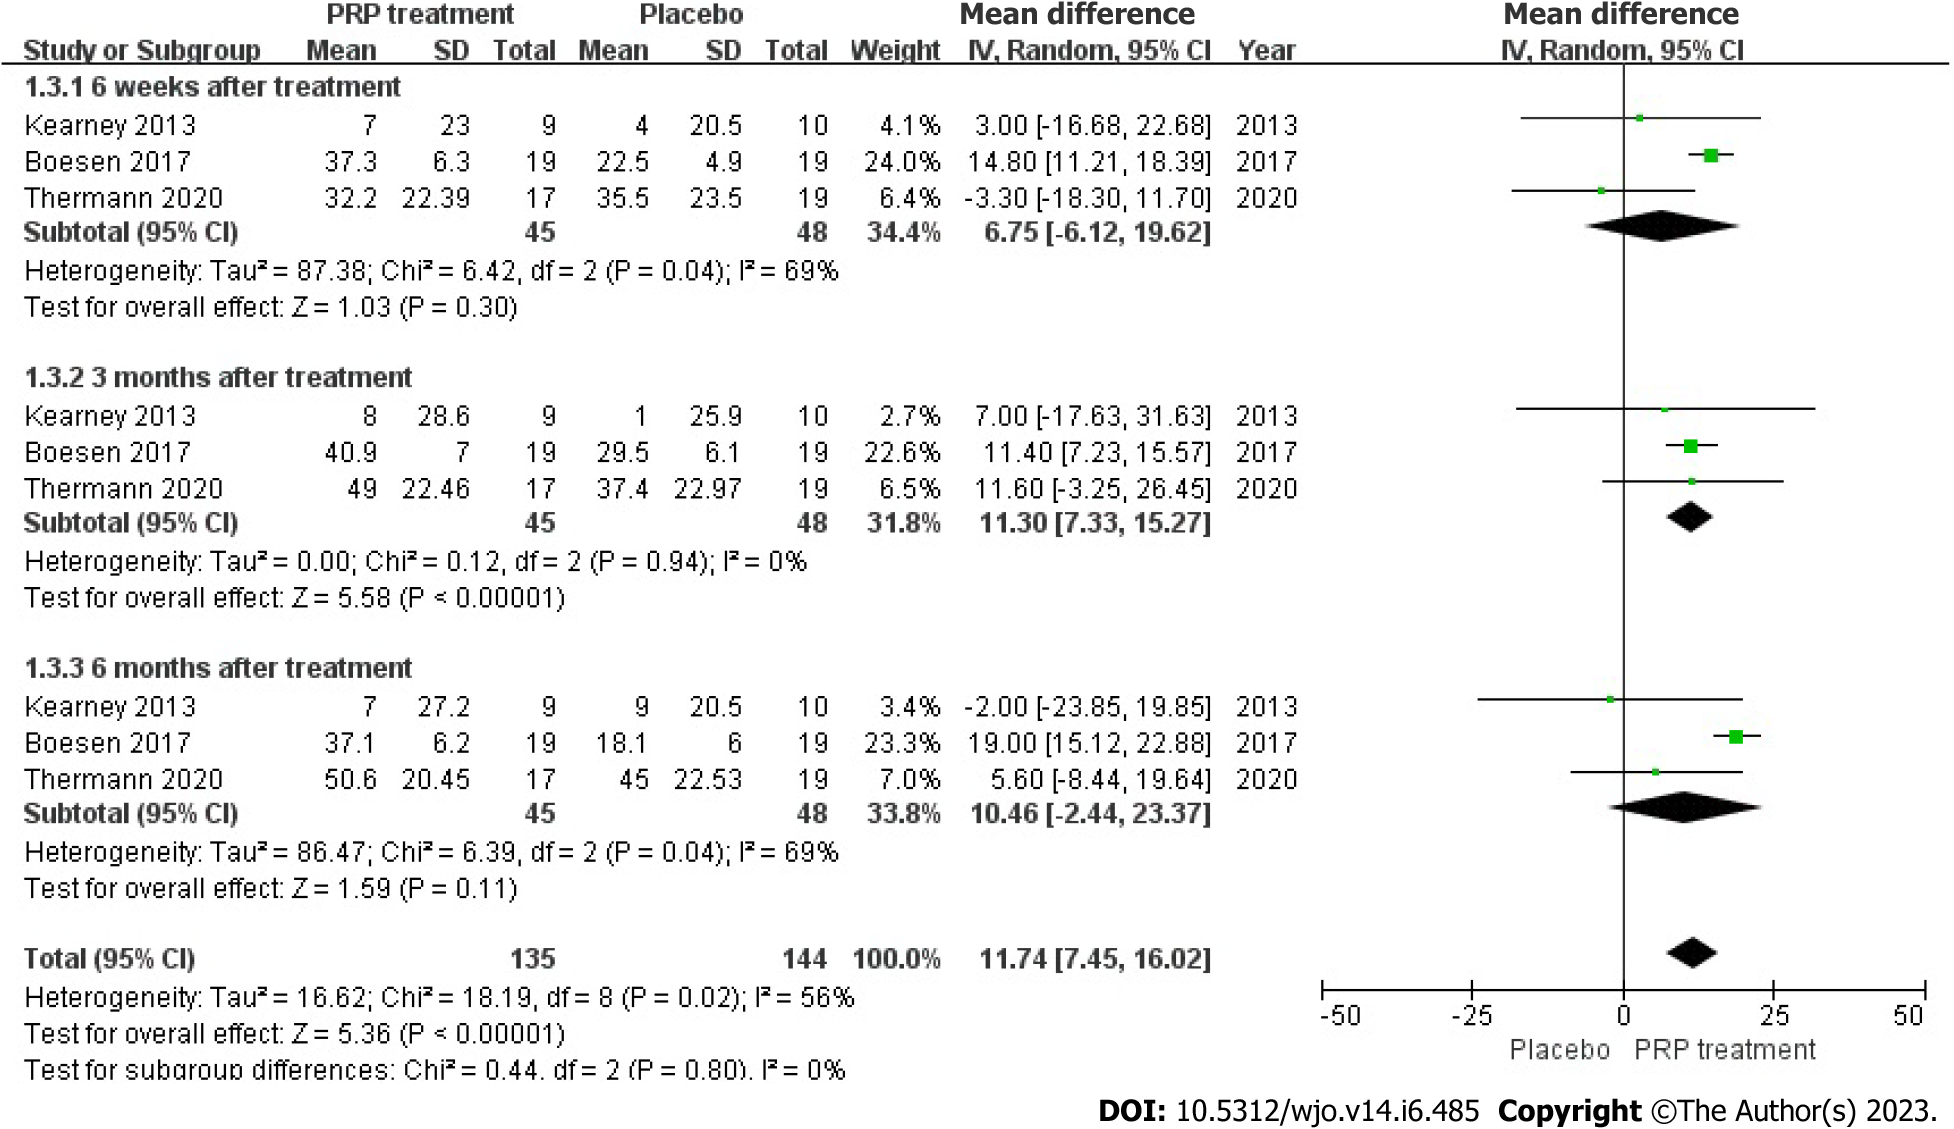
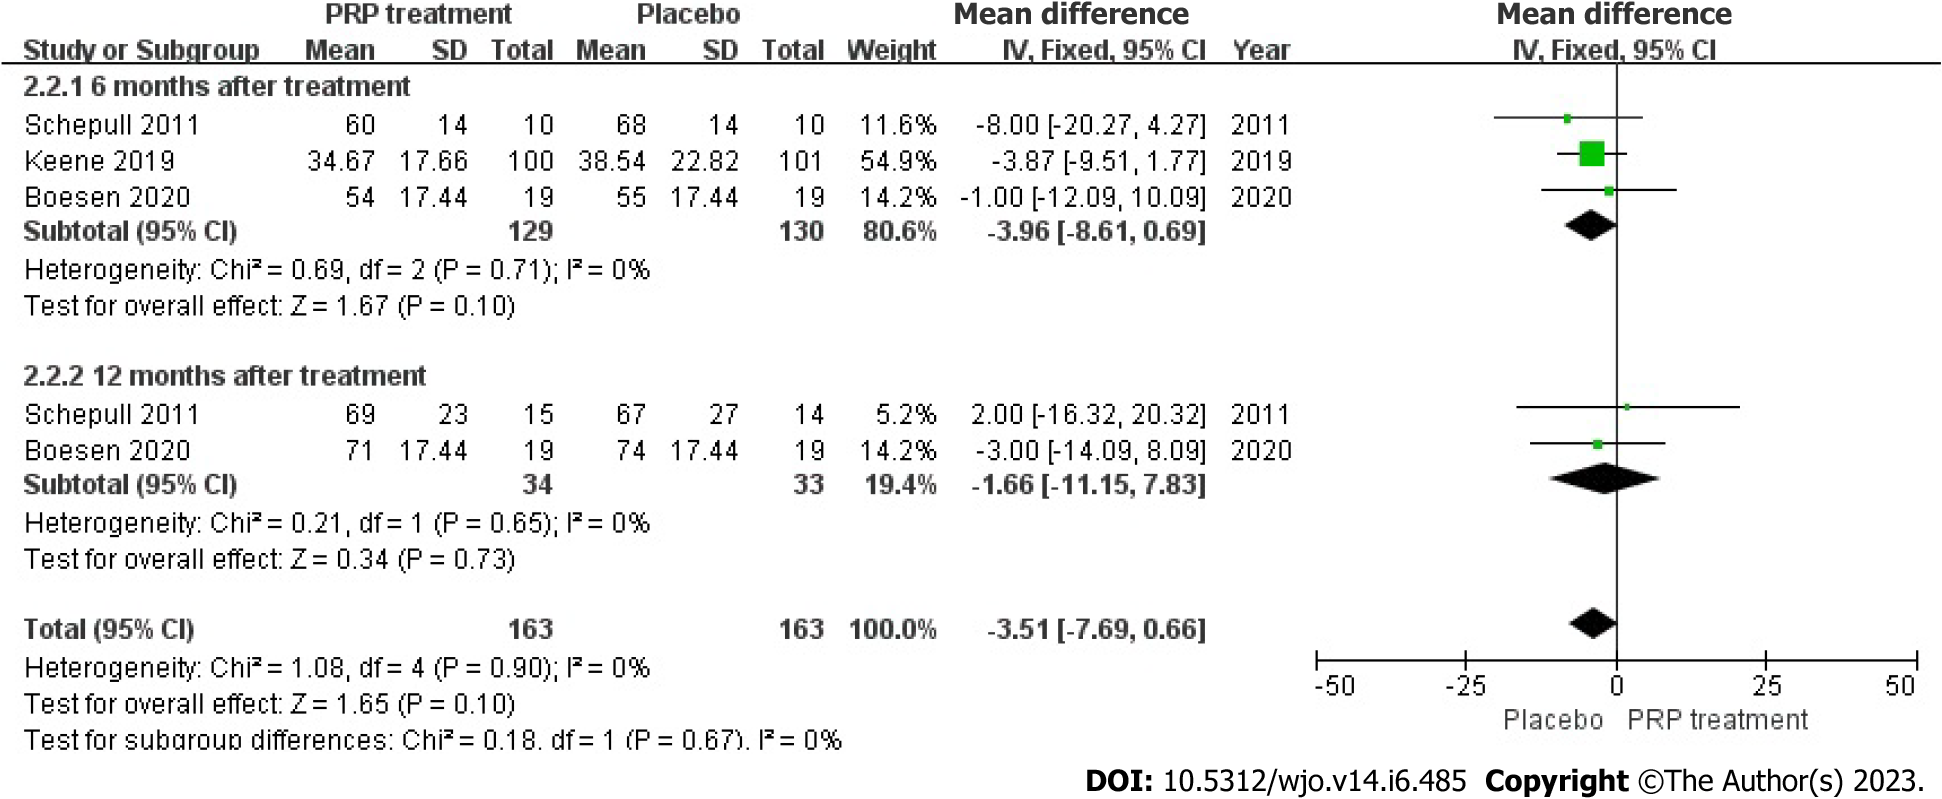
Figure 5 Forest plot of Achilles tendon thickness variation.
PRP: Platelet-Rich Plasma.
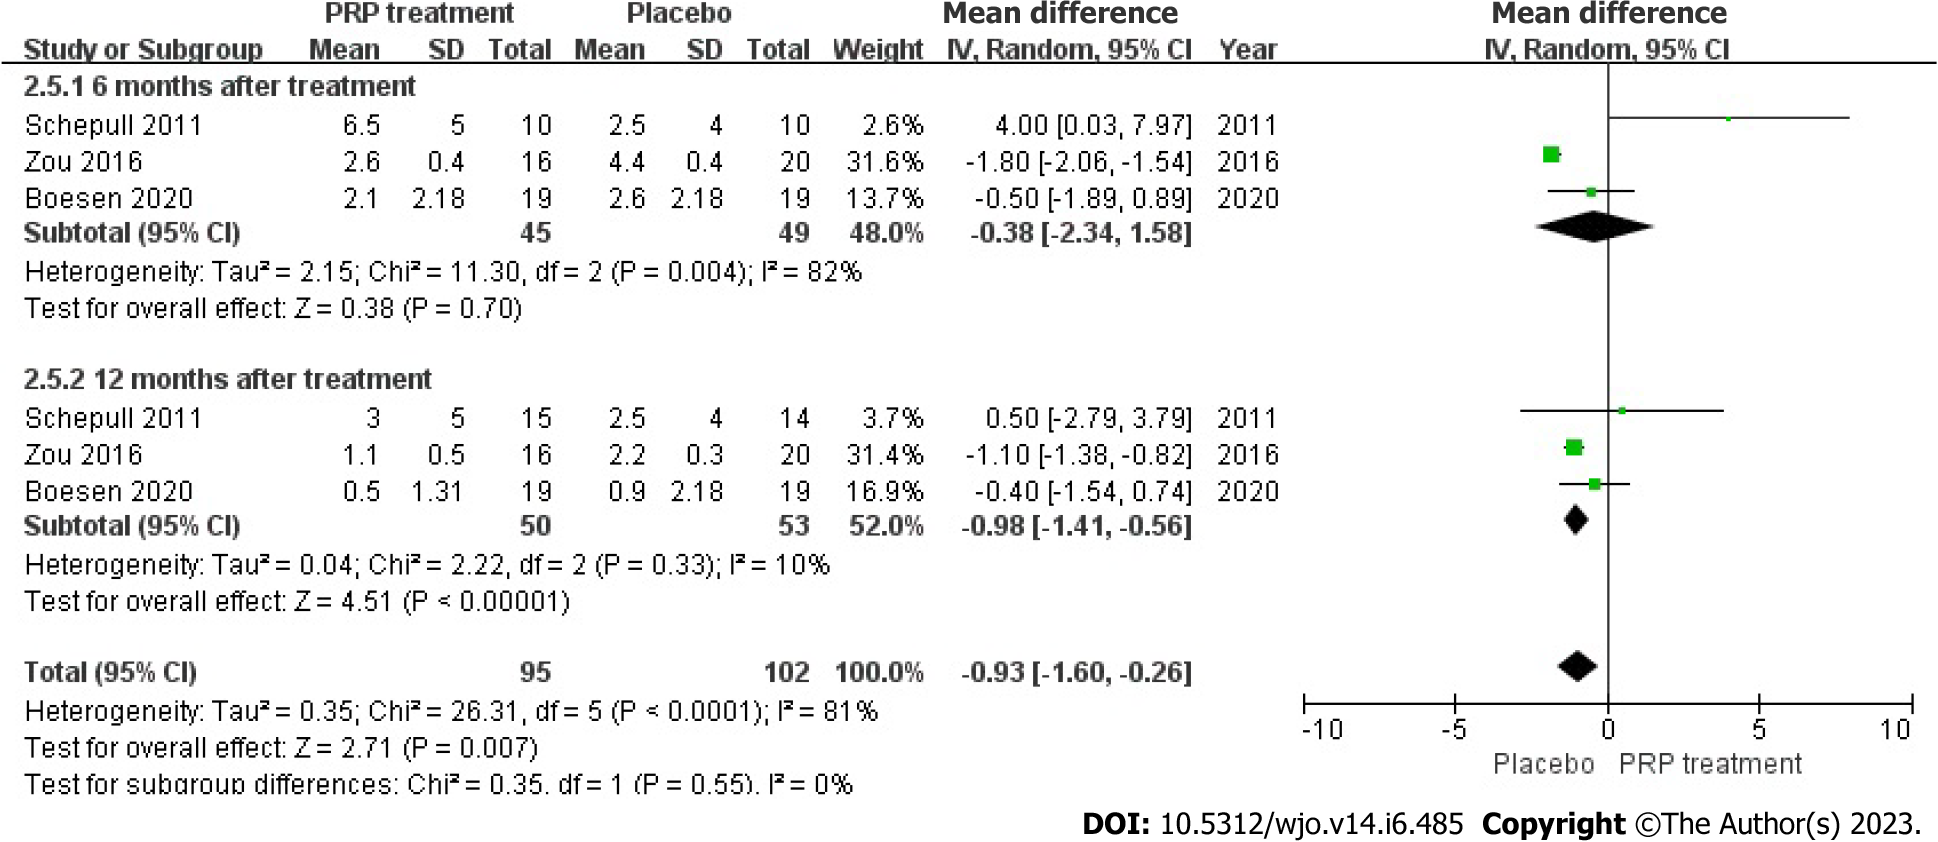
Figure 6 Forest plot of change in visual analogue scale scores.
PRP: Platelet-Rich Plasma.
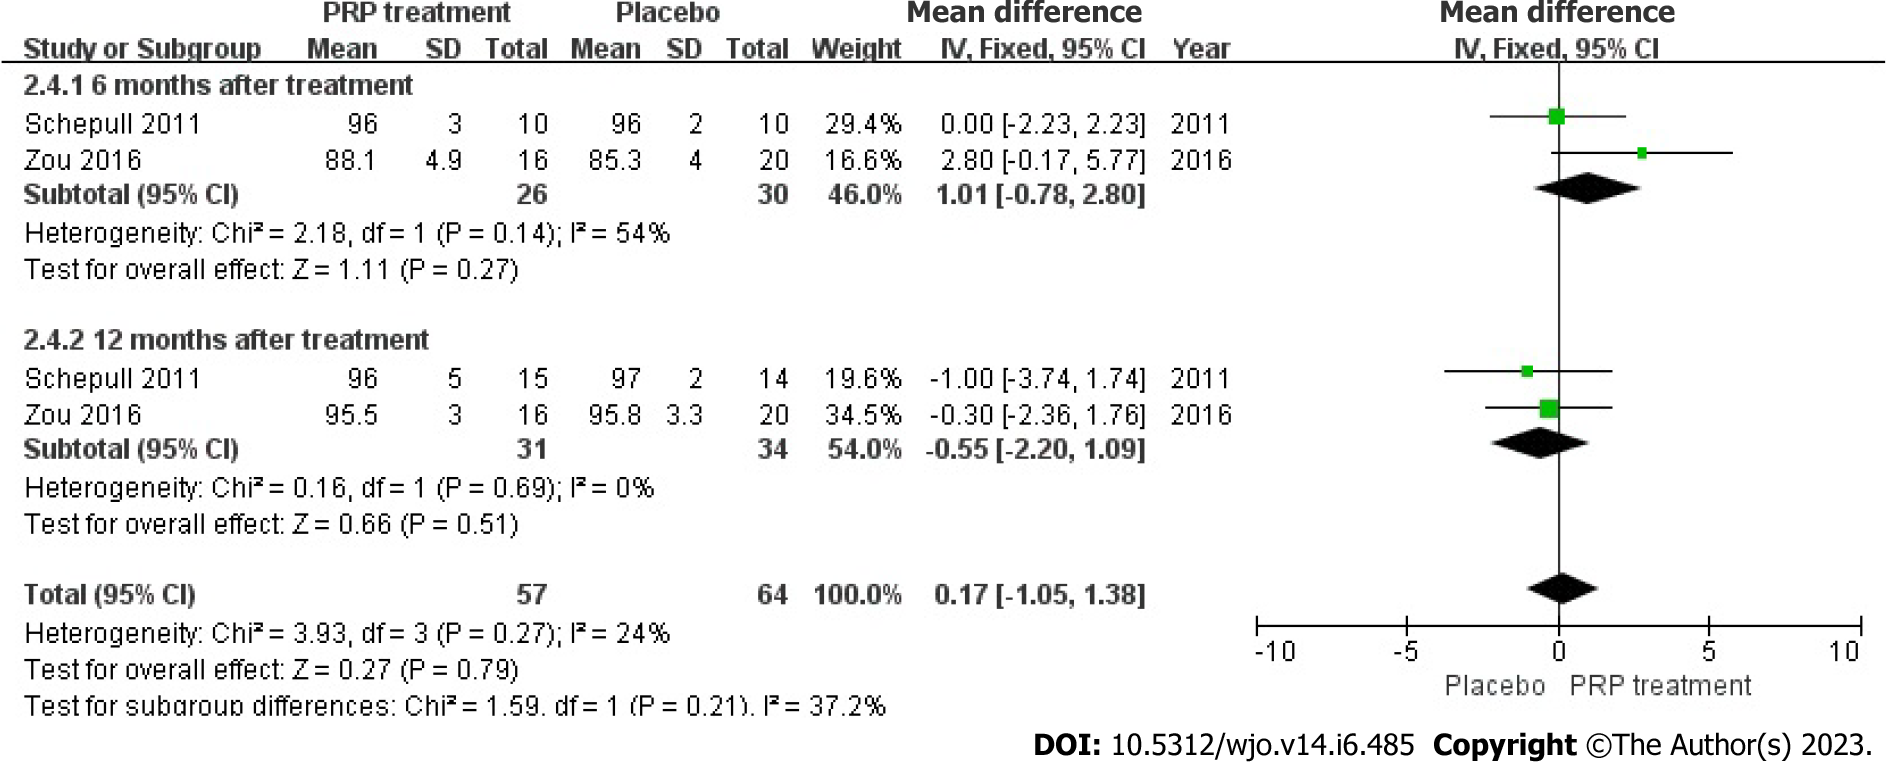
Figure 7 Forest plot of change in patient satisfaction.
PRP: Platelet-Rich Plasma.
Figure 8 Forest plot of patient return to exercise rate.
PRP: Platelet-Rich Plasma.
Figure 9 Forest plot of Victorian Institute Ankle Function Scale scores in patients with Achilles tendon rupture.
PRP: Platelet-Rich Plasma.
Figure 10 Forest plot of single heel lift height in patients with Achilles tendon rupture.
PRP: Platelet-Rich Plasma.
Figure 11 Forest plot of calf circumference in patients with Achilles tendon rupture.
PRP: Platelet-Rich Plasma.
Figure 12 Forest plot of ankle mobility in patients with Achilles tendon rupture.
PRP: Platelet-Rich Plasma.
Figure 13 Forest plot of return to sport rates in patients with Achilles tendon rupture.
PRP: Platelet-Rich Plasma.
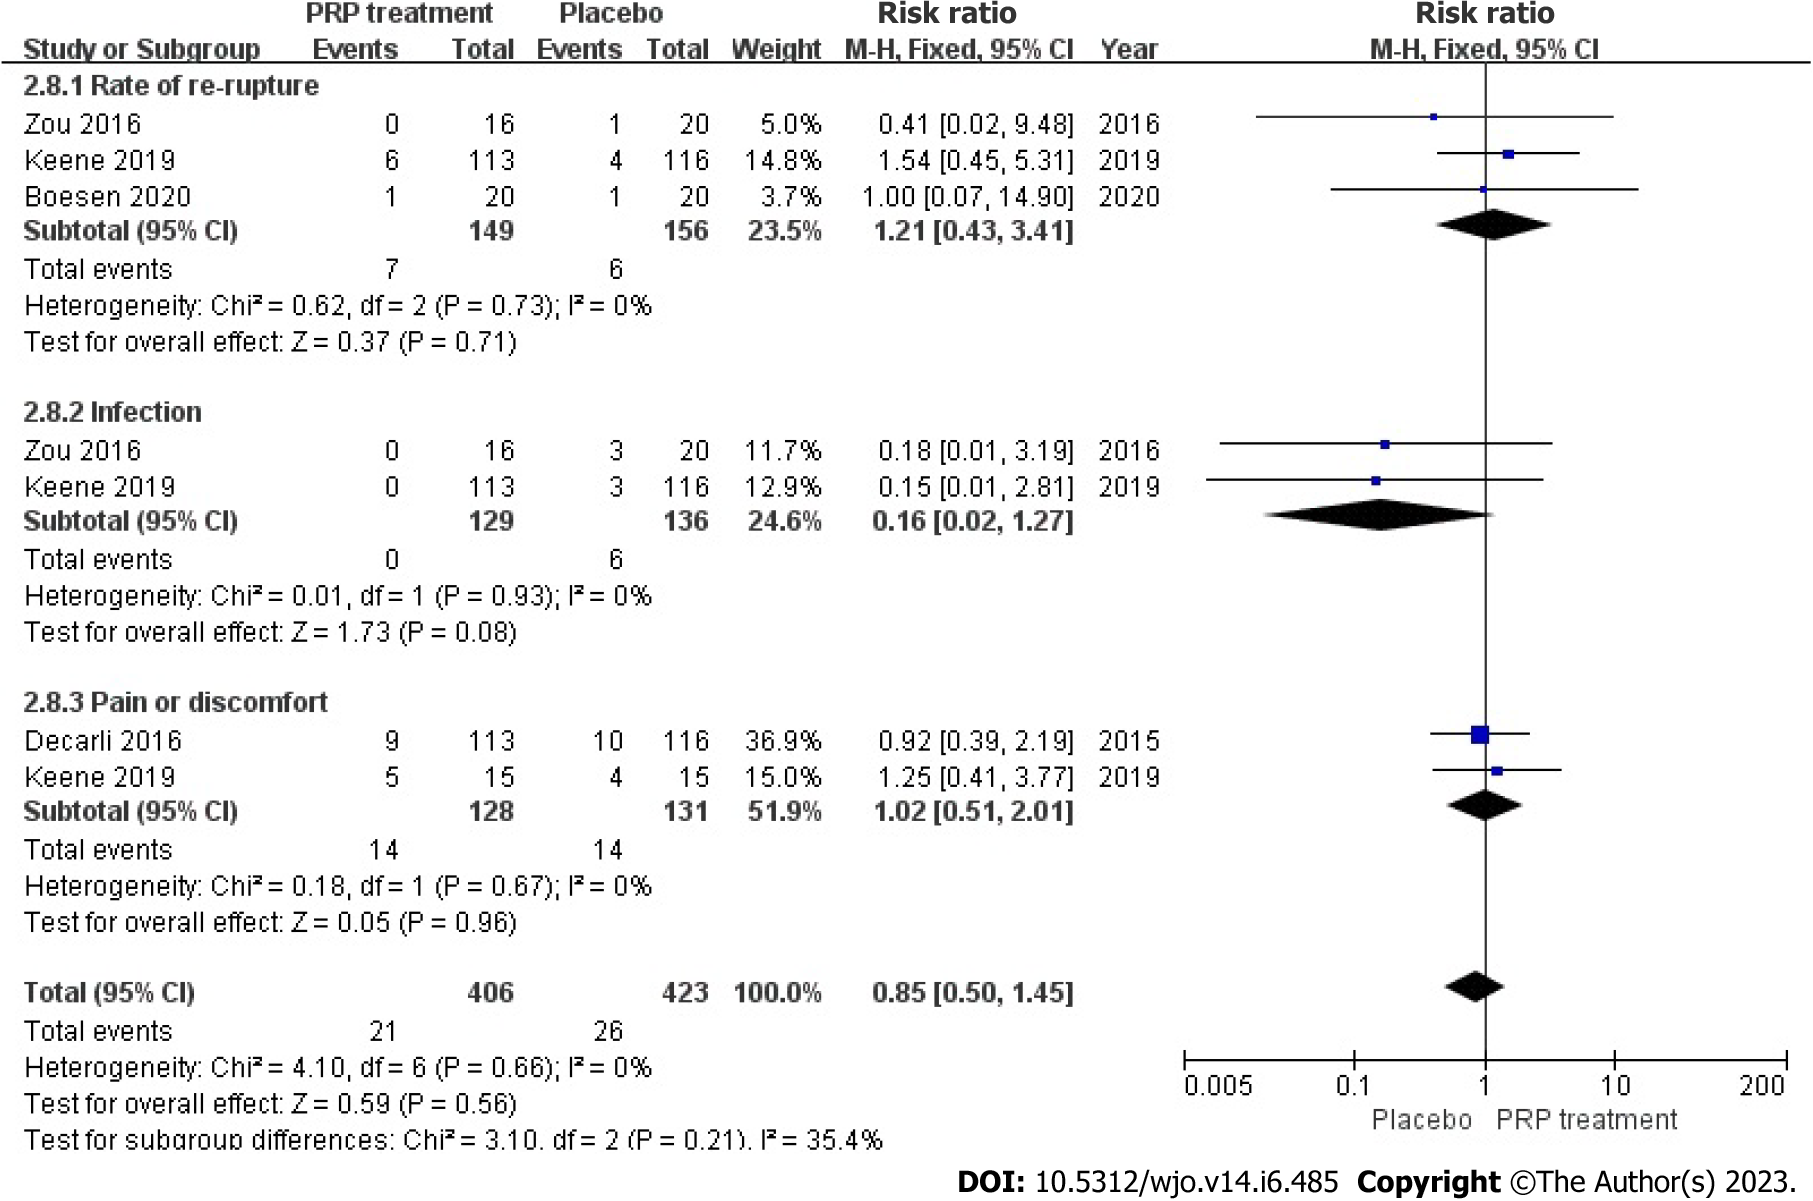
Figure 14 Forest plot of the incidence of adverse events in patients with Achilles tendon rupture.
PRP: Platelet-Rich Plasma.
- Citation: Huang D, Vithran DTA, Gong HL, Zeng M, Tang ZW, Rao ZZ, Wen J, Xiao S. Effectiveness of platelet-rich plasma in the treatment of Achilles tendon disease. World J Orthop 2023; 14(6): 485-501
- URL: https://www.wjgnet.com/2218-5836/full/v14/i6/485.htm
- DOI: https://dx.doi.org/10.5312/wjo.v14.i6.485


