Copyright
©The Author(s) 2023.
World J Orthop. Jun 18, 2023; 14(6): 387-398
Published online Jun 18, 2023. doi: 10.5312/wjo.v14.i6.387
Published online Jun 18, 2023. doi: 10.5312/wjo.v14.i6.387
Figure 1 Flowchart of the proposed method.
A: Input radiograph; B: Bones detected by the You Only Look Once; C: Detected region of interest, resized to size 512 × 512; D: Segmented bones by the U-Net; E: Landmarks detected on the patella and line fitted to them (cyan), and line fitted to tibial surface (green). YOLO: You Only Look Once; CD: Caton-Deschamps; ROI: Region of interest.
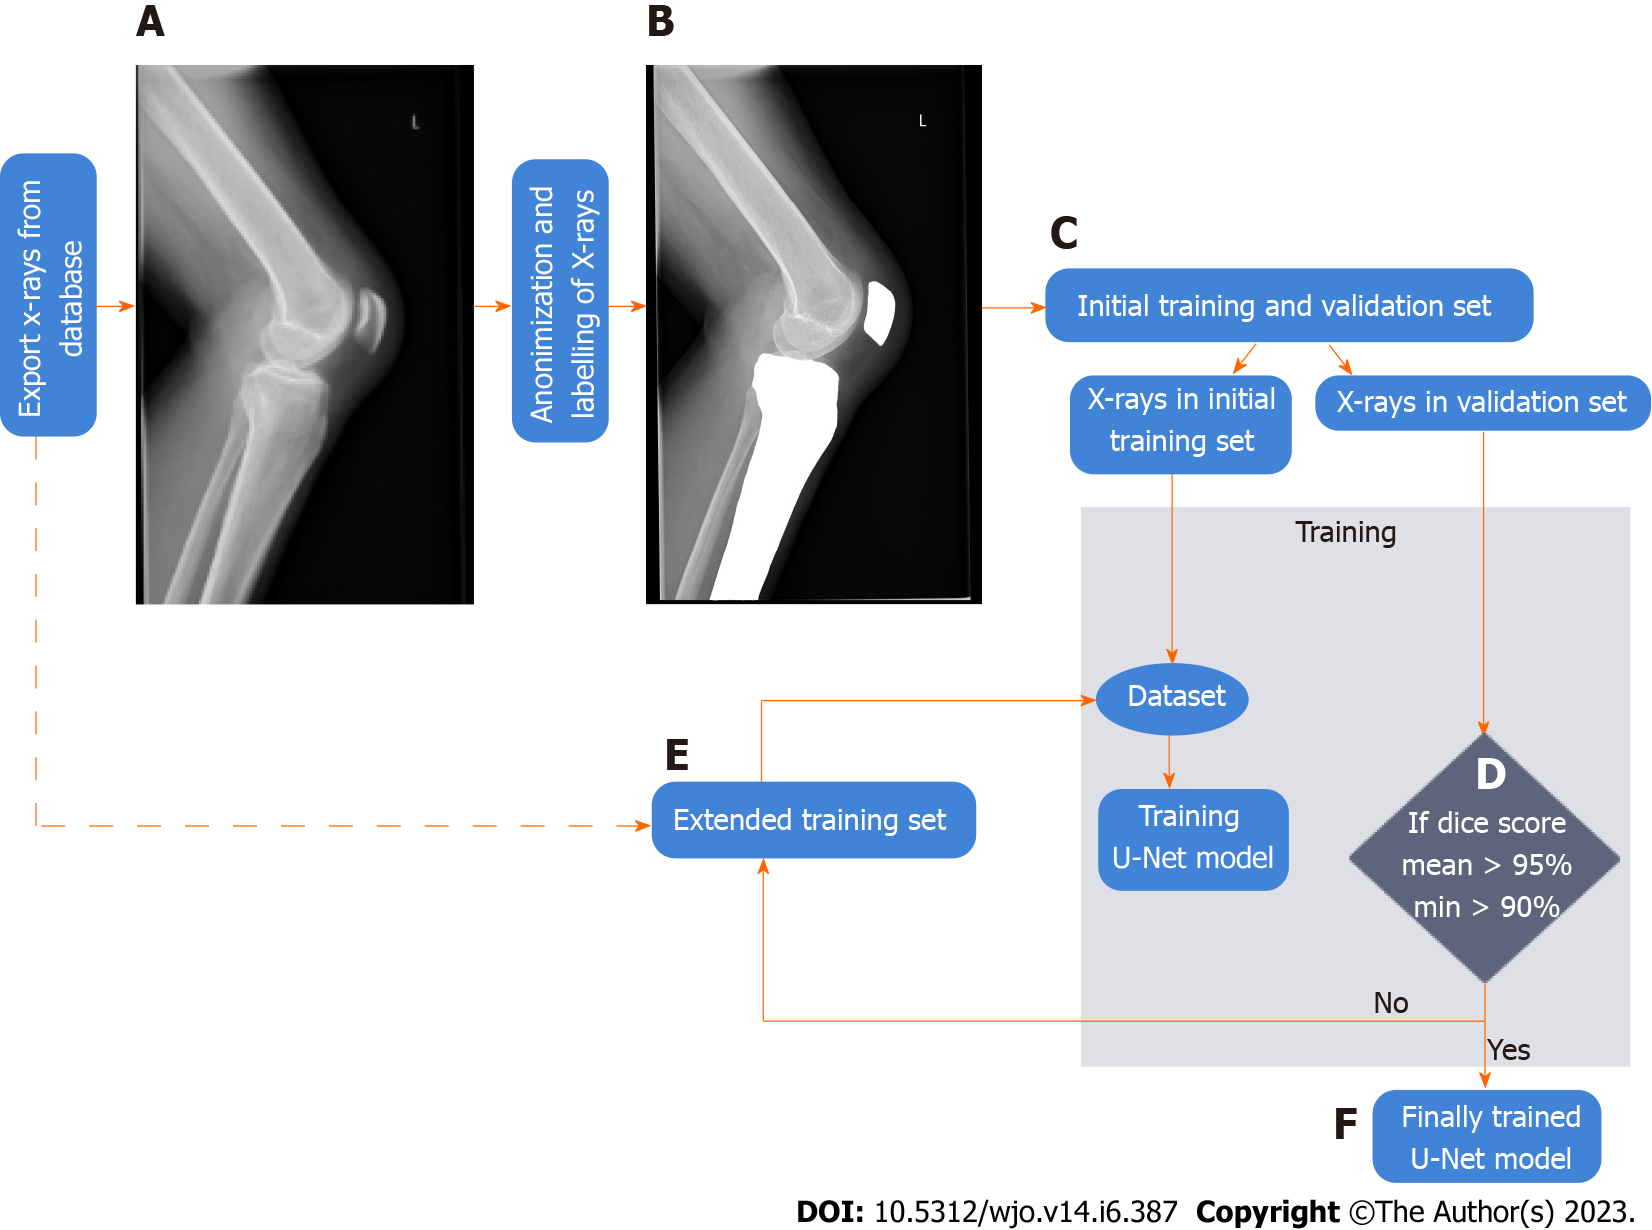
Figure 2 Flow diagram of the methodology of data collection and training of the U-Net for bone segmentation.
A: Radiograms from database; B: Labeled radiograms for training and validation; C: Split of radiograms into training and validation subsets; D: Conditional block for stop the training; E: Extended training set; F: Trained U-Net model.
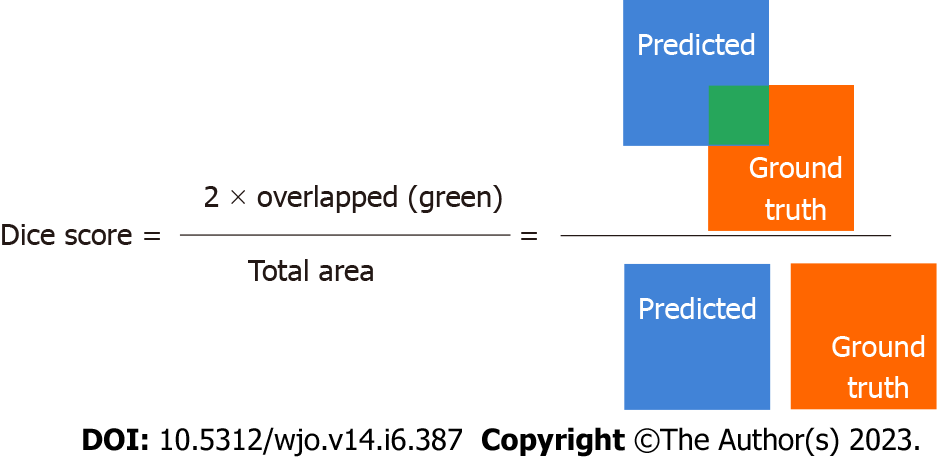
Figure 3 Dice score calculation used to asses bone segmentation performance.
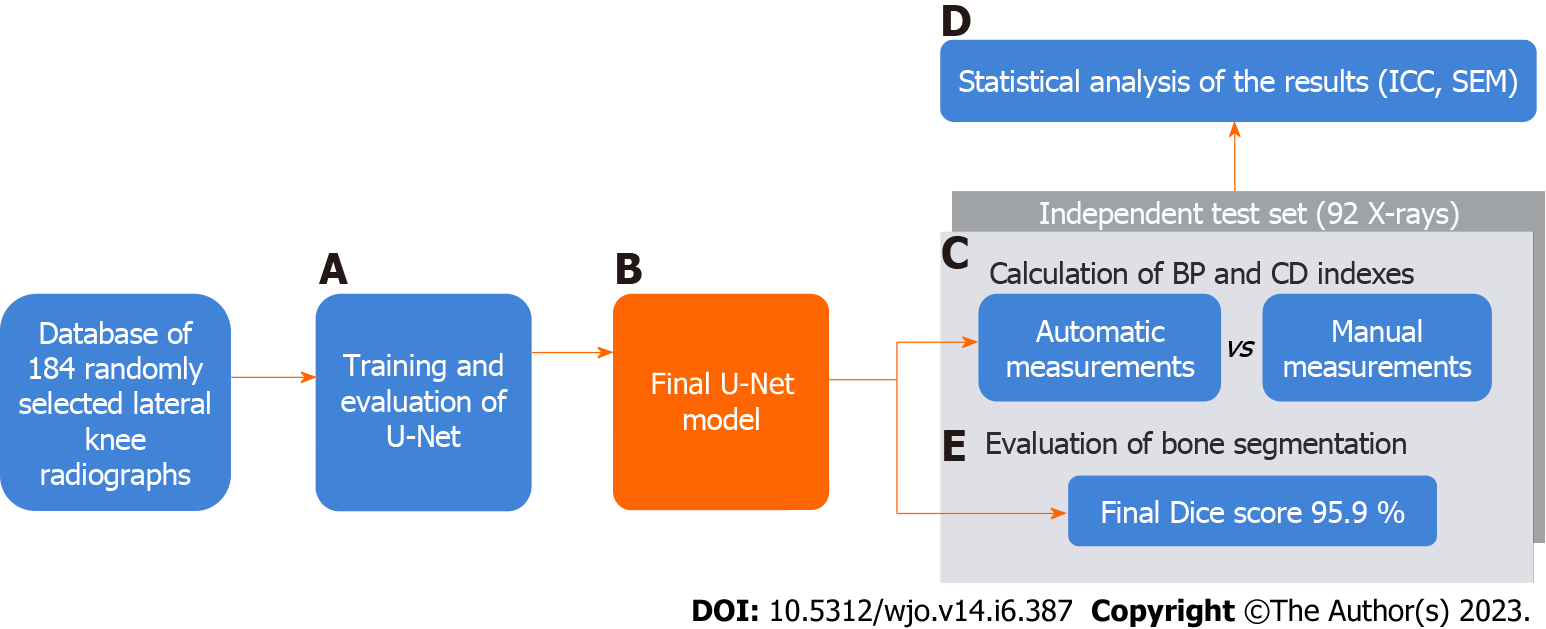
Figure 4 Flow diagram of patient selection and attaining the required segmentation score.
A: Training and evaluation of U-Net; B: Final U-Net model; C: Calculation of blackburne-peel and Caton-Deschamps indexes; D: Statistical analysis; E: Final Dice score. CD: Caton-Deschamps; BP: Blackburne-peel; ICC: Interclass correlation coefficient; SEM: Single measurement.
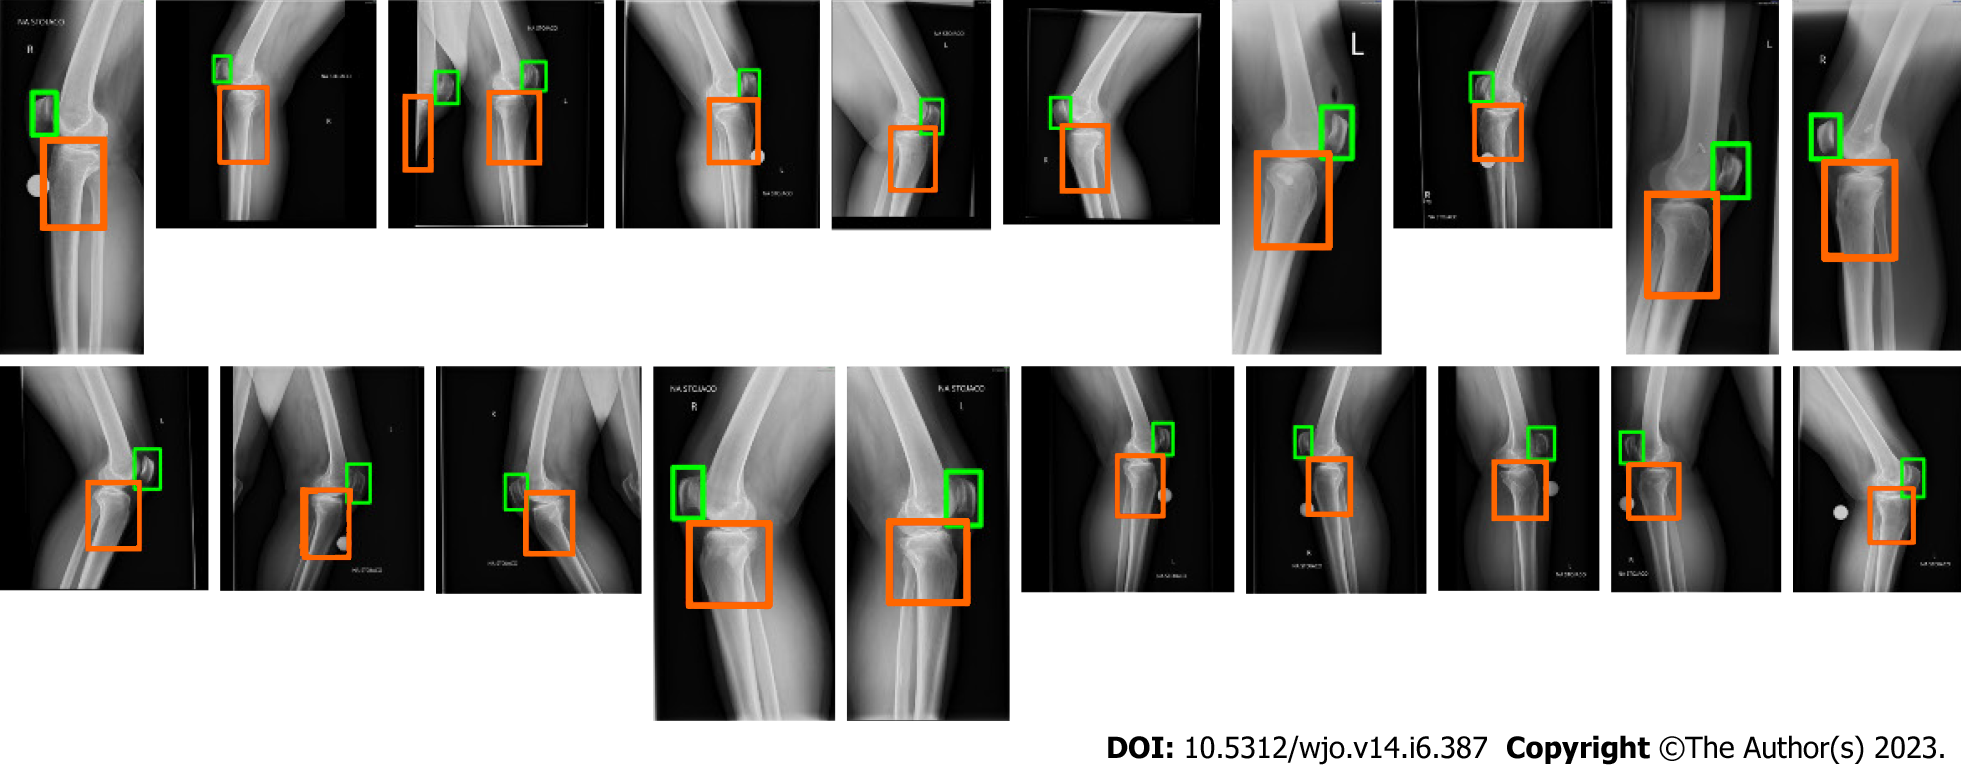
Figure 5 Detected bones (patella and proximal tibia) on high-resolution radiographs using You Only Look Once.
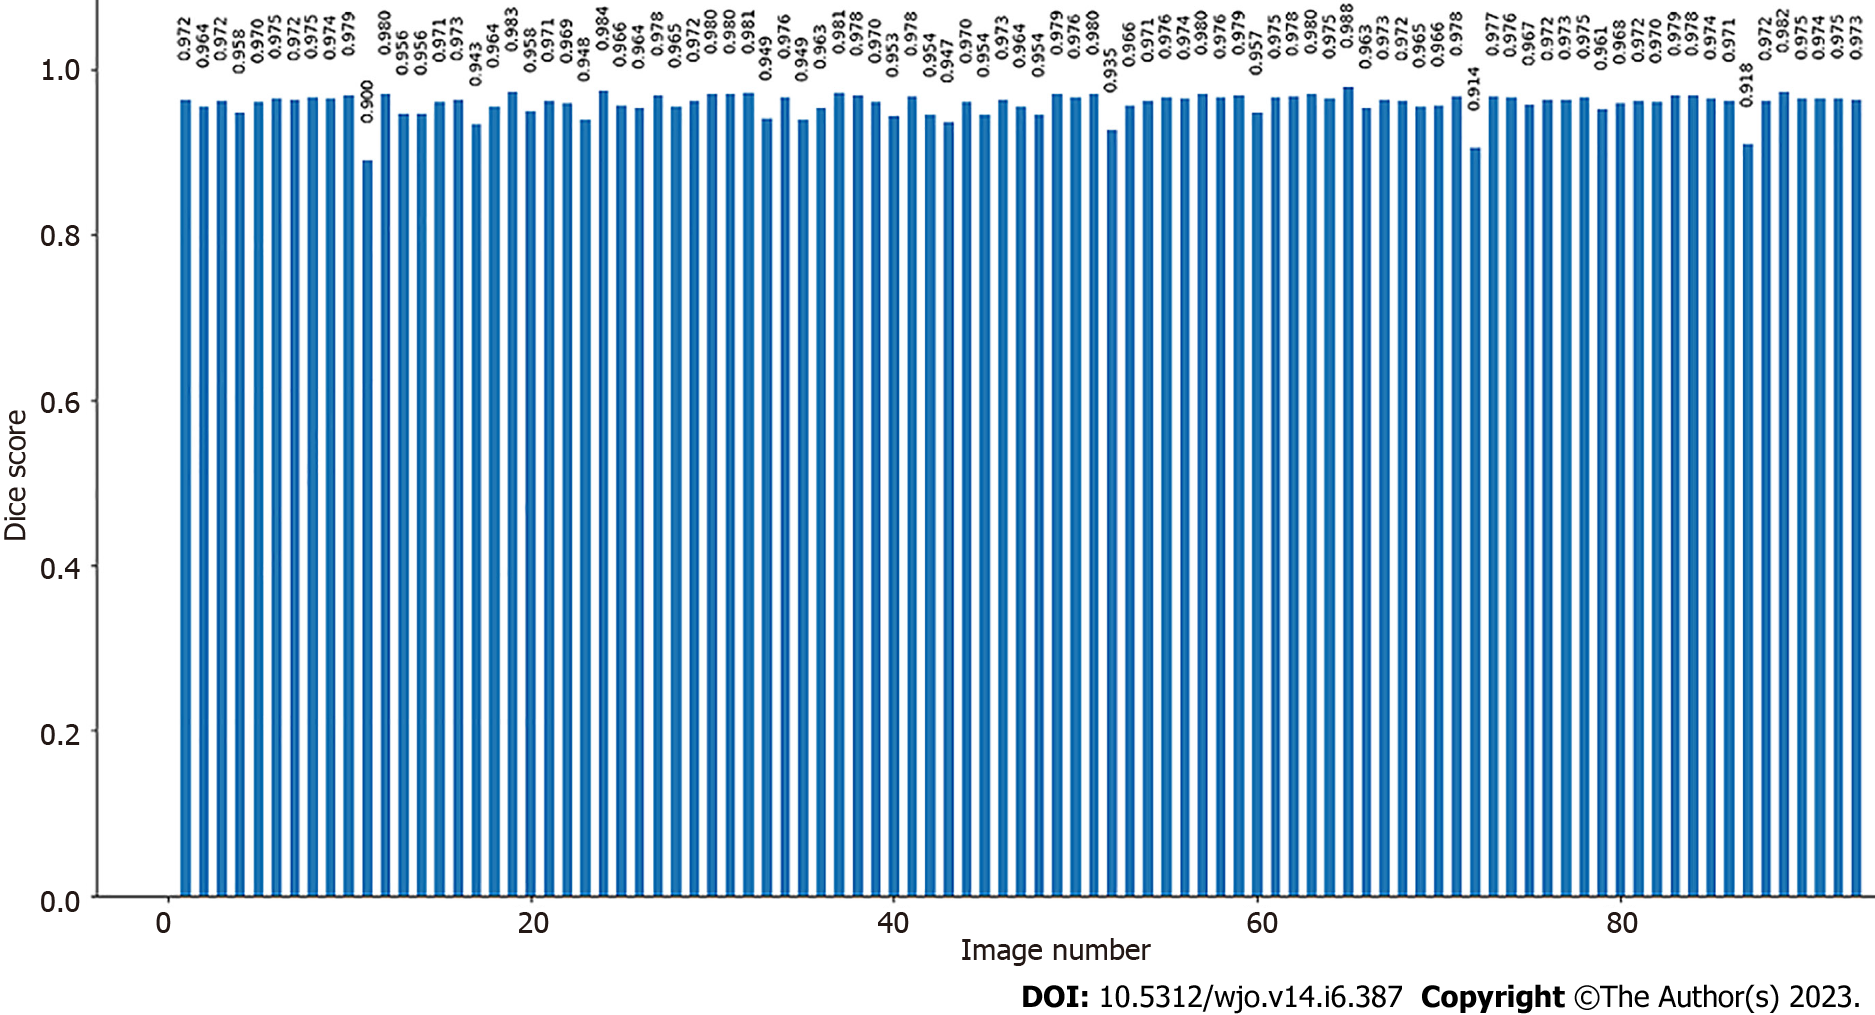
Figure 6 Distribution of dice score results for test images (92 subjects).
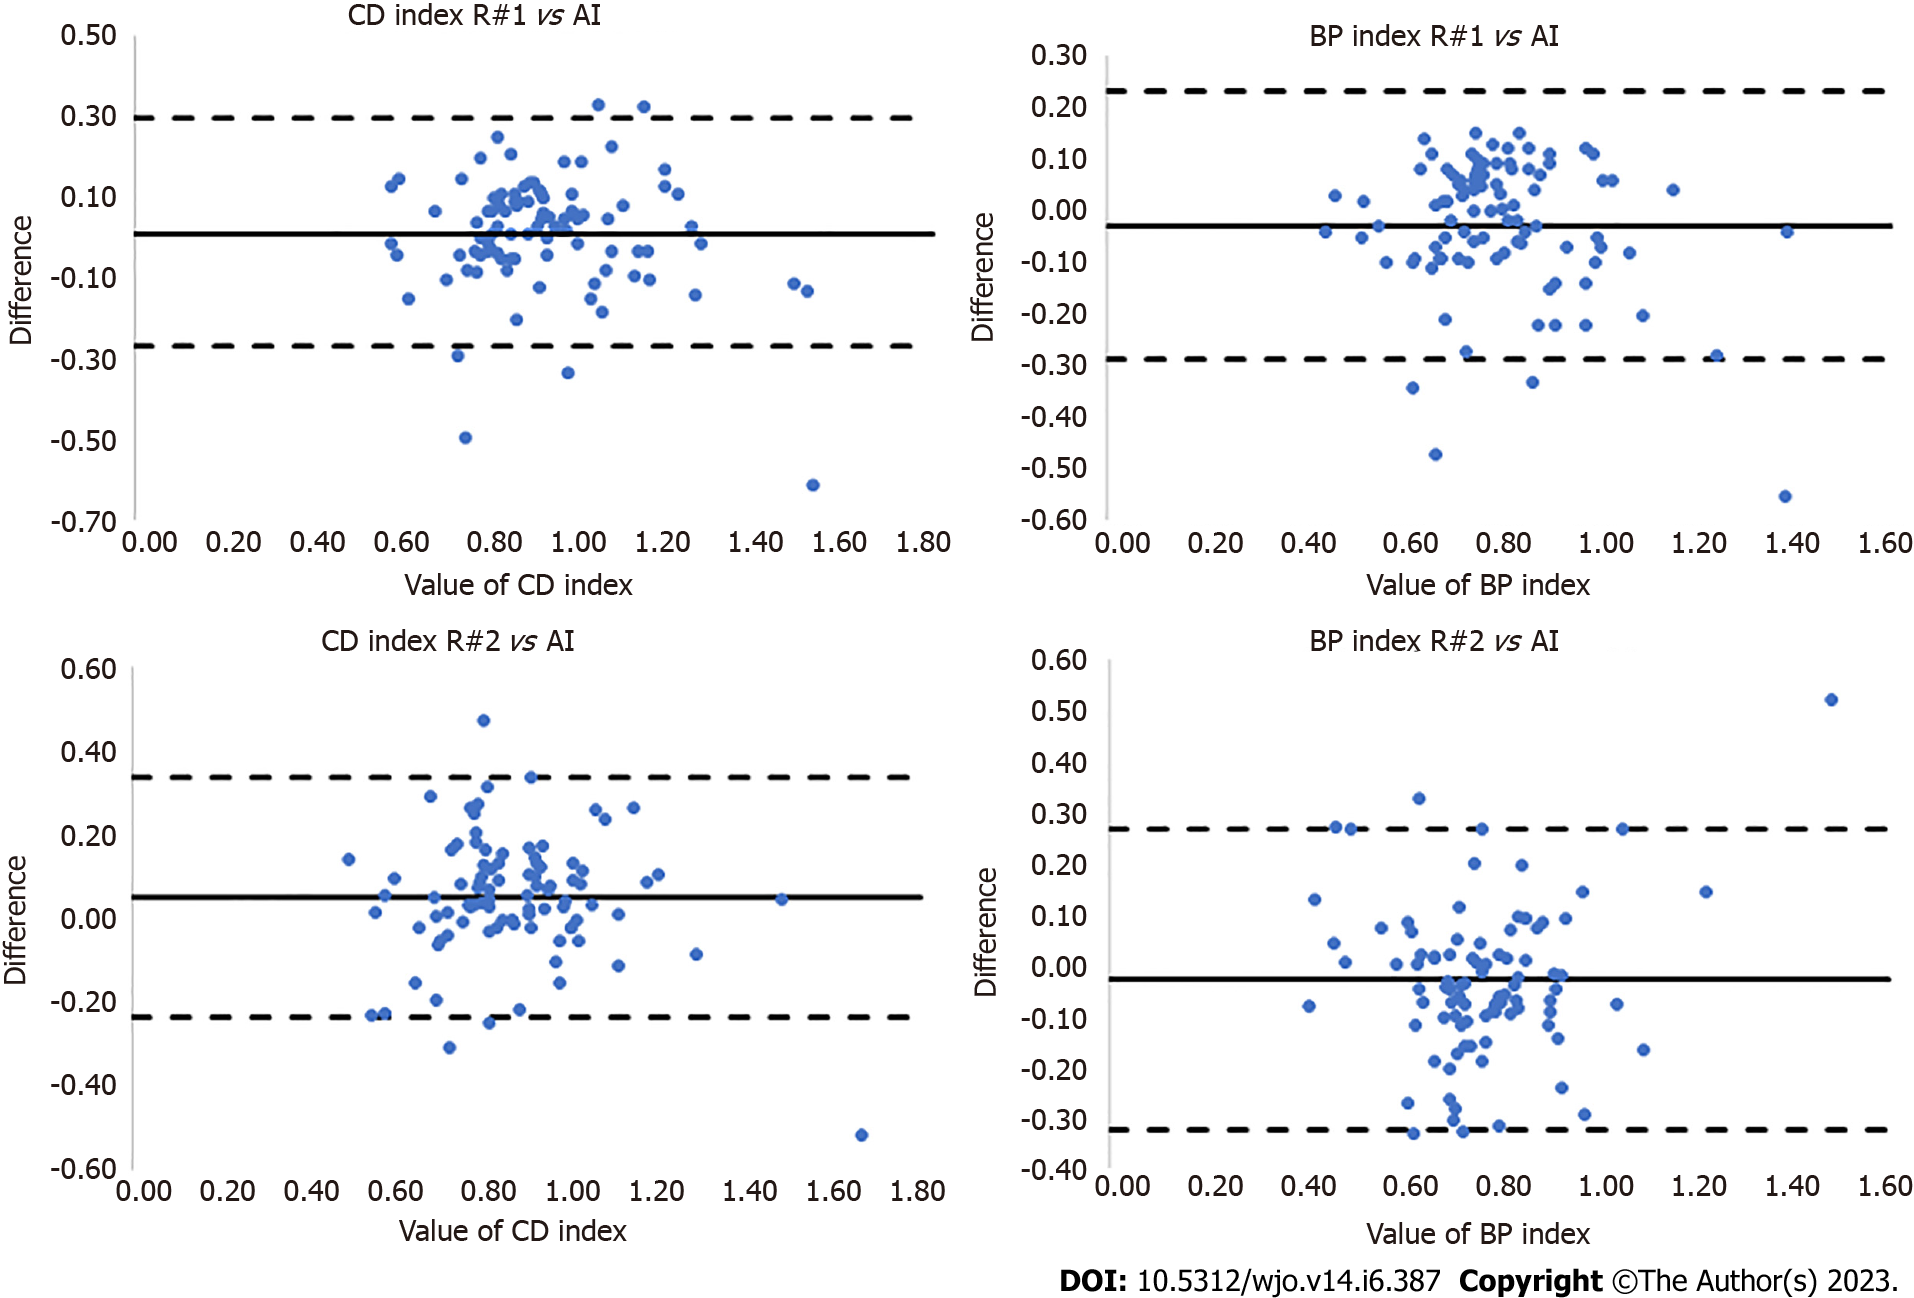
Figure 7 Bland-Altman plots illustrating the differences between R#1 vs artificial intelligence (AI) and R#2 vs AI for Caton-Deschamps and Blackburne-Peel indexes.
Continuous lines represent a mean (bias), dashed lines represent +2 and -2 SD values. BP: Blackburne-peel; CD: Caton-deschamps; AI: Artificial intelligence.
- Citation: Kwolek K, Grzelecki D, Kwolek K, Marczak D, Kowalczewski J, Tyrakowski M. Automated patellar height assessment on high-resolution radiographs with a novel deep learning-based approach. World J Orthop 2023; 14(6): 387-398
- URL: https://www.wjgnet.com/2218-5836/full/v14/i6/387.htm
- DOI: https://dx.doi.org/10.5312/wjo.v14.i6.387


