Copyright
©The Author(s) 2022.
World J Orthop. Sep 18, 2022; 13(9): 791-801
Published online Sep 18, 2022. doi: 10.5312/wjo.v13.i9.791
Published online Sep 18, 2022. doi: 10.5312/wjo.v13.i9.791
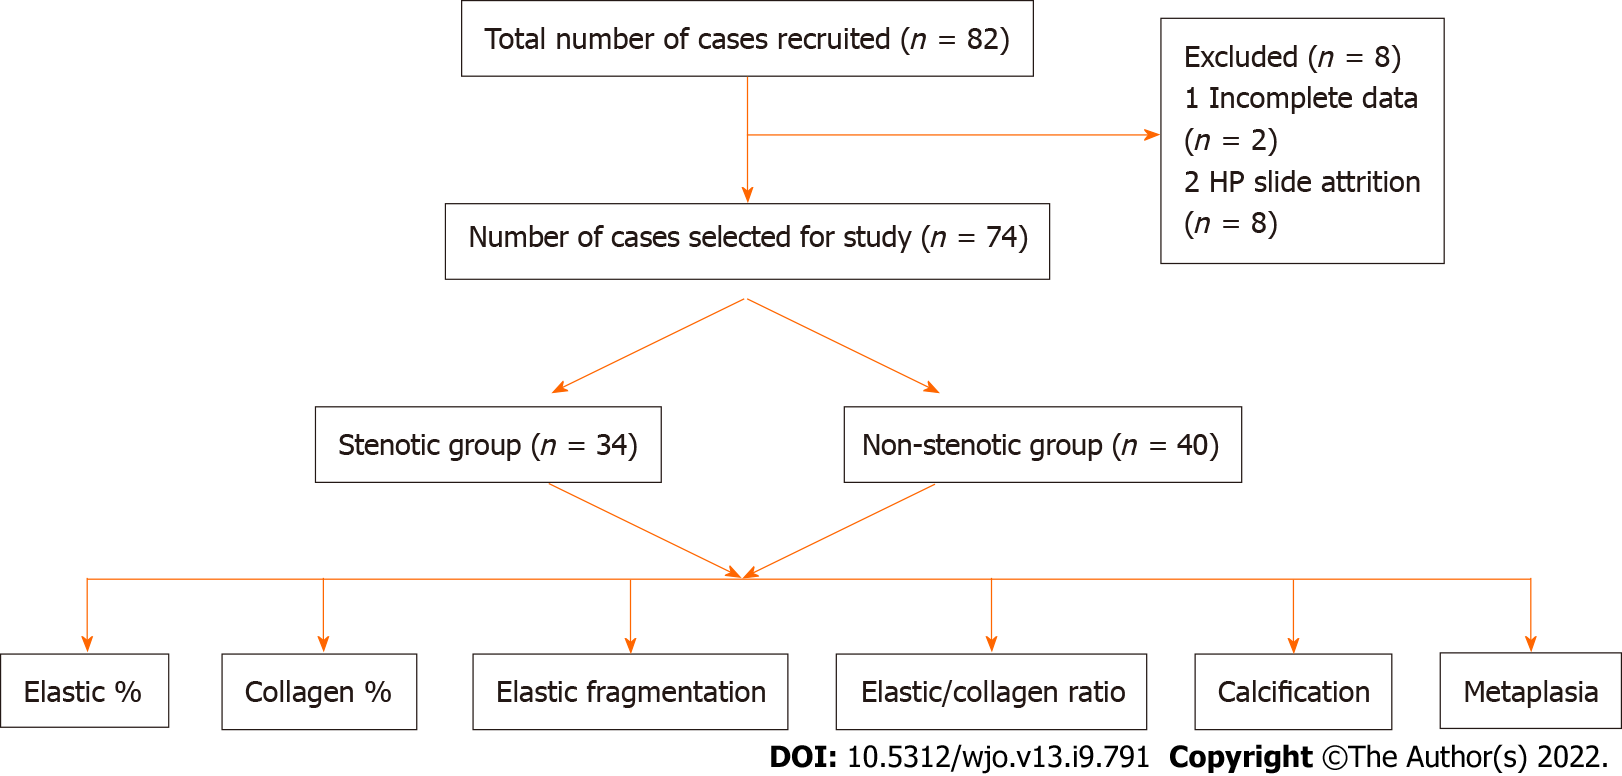
Figure 1
Flow diagram of patients.
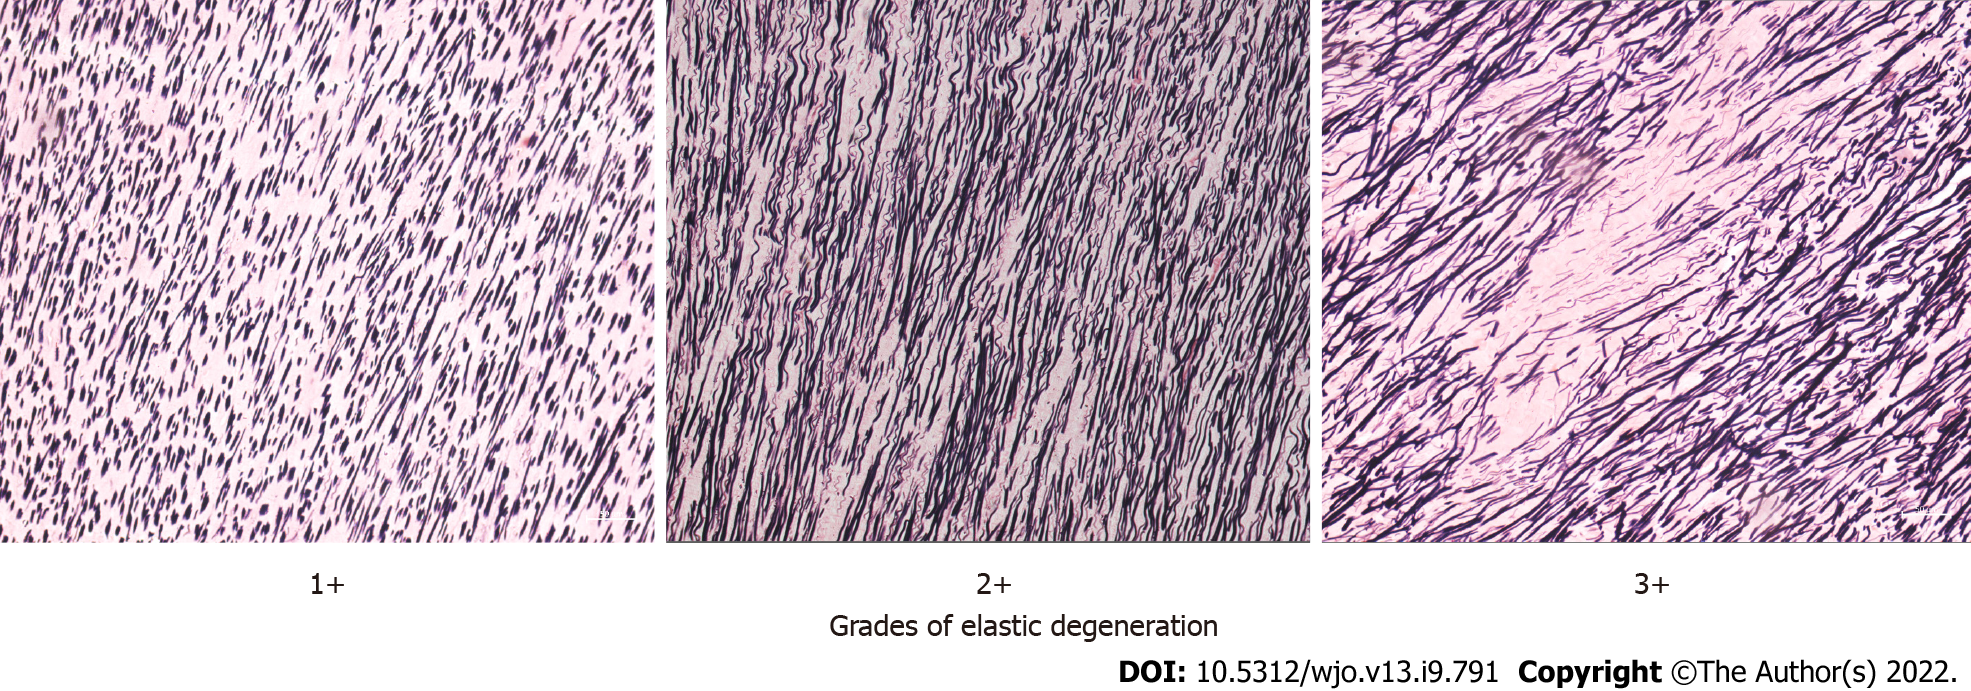
Figure 2
The three grades of elastic degeneration.
Figure 3 Von Geisson’s stain showing the difference between lumbar canal stenosis & Non-lumbar canal stenosis in the number of elastic fibers.
A: Lumbar canal stenosis; B: Non-lumbar canal stenosis.
Figure 4 Masson’s Trichrome stain showing the difference in the number of collagen fibers.
A: Lumbar canal stenosis; B: Non-lumbar canal stenosis.
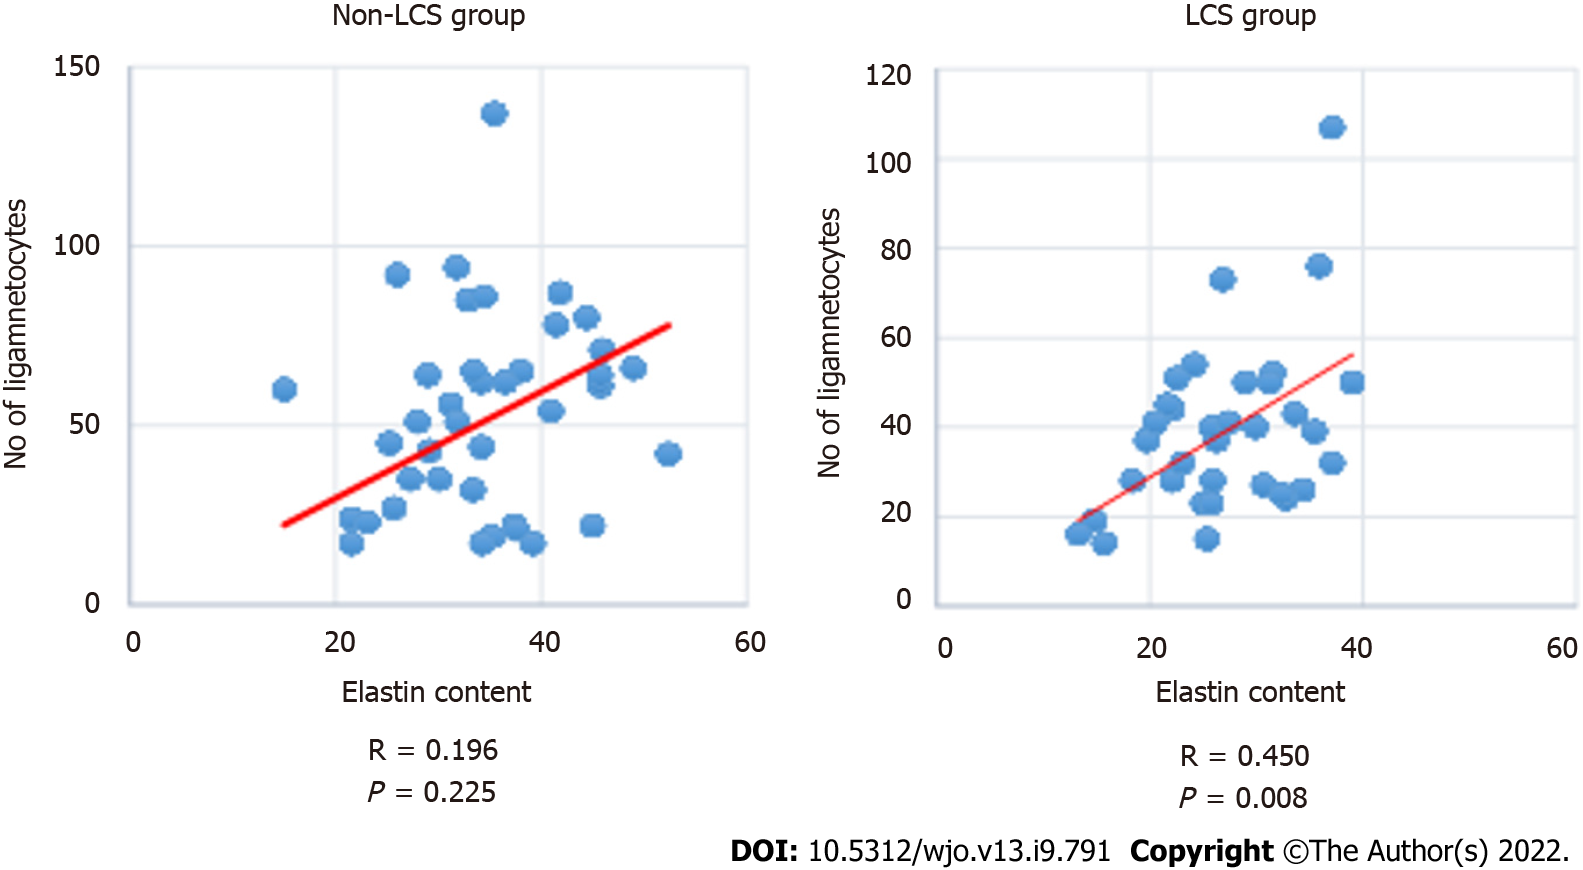
Figure 5 Scatter plot showing the correlation between the elastic fibers and ligamentocyte numbers in the groups.
LCS: Lumbar canal stenosis.
- Citation: Jain M, Sable M, Tirpude AP, Sahu RN, Samanta SK, Das G. Histological difference in ligament flavum between degenerative lumbar canal stenosis and non-stenotic group: A prospective, comparative study. World J Orthop 2022; 13(9): 791-801
- URL: https://www.wjgnet.com/2218-5836/full/v13/i9/791.htm
- DOI: https://dx.doi.org/10.5312/wjo.v13.i9.791


