Published online Aug 24, 2022. doi: 10.5306/wjco.v13.i8.675
Peer-review started: August 2, 2021
First decision: November 6, 2021
Revised: December 23, 2021
Accepted: July 26, 2022
Article in press: July 26, 2022
Published online: August 24, 2022
Processing time: 386 Days and 8.1 Hours
Breast cancer (BC) is the most common malignant tumor in women.
To investigate BC-associated hub genes to obtain a better understanding of BC tumorigenesis.
In total, 1203 BC samples were downloaded from The Cancer Genome Atlas database, which included 113 normal samples and 1090 tumor samples. The limma package of R software was used to analyze the differentially expressed genes (DEGs) in tumor tissues compared with normal tissues. The cluster Profiler package was used to perform Kyoto Encyclopedia of Genes and Genomes (KEGG) enrichment analysis of upregulated and downregulated genes. Univariate Cox regression was conducted to explore the DEGs with statistical significance. Protein-protein interaction (PPI) network analysis was employed to investigate the hub genes using the CytoHubba plug-in of Cytoscape software. Survival analyses of the hub genes were carried out using the Kaplan-Meier method. The expression level of these hub genes was validated in the Gene Expression Profiling Interactive Analysis database and Human Protein Atlas database.
A total of 1317 DEGs (fold change > 2; P < 0.01) were confirmed through bioinformatics analysis, which included 744 upregulated and 573 downregulated genes in BC samples. KEGG enrichment analysis indicated that the upregulated genes were mainly enriched in the cytokine-cytokine receptor interaction, cell cycle, and the p53 signaling pathway (P < 0.01); and the downregulated genes were mainly enriched in the cytokine-cytokine receptor interaction, peroxisome proliferator-activated receptor signaling pathway, and AMP-activated protein kinase signaling pathway (P < 0.01).
In view of the results of PPI analysis, which were verified by survival and expression analyses, we conclude that MAD2L1, PLK1, SAA1, CCNB1, SHCBP1, KIF4A, ANLN, and ERCC6L may act as biomarkers for the diagnosis and prognosis in BC patients.
Core Tip: This study identified 1317 DEGs related to the occurrence and development of breast cancer (BC), 165 DEGs related to prognosis, and 8 hub genes (MAD2L1, PLK1, SAA1, CCNB1, SHCBP1, KIF4A, ANLN, and ERCC6L). Each of these eight hub genes has different expression levels in BC and is significantly related to prognosis. The results of this study indicate that studying these DEGs may help provide a full understanding of the molecular mechanisms underlying BC pathogenesis and progression. Moreover, these hub genes may serve as potential prognostic markers and therapeutic targets, which provide a reference for more in-depth and extensive prospective clinical research.
- Citation: Liu N, Zhang GD, Bai P, Su L, Tian H, He M. Eight hub genes as potential biomarkers for breast cancer diagnosis and prognosis: A TCGA-based study. World J Clin Oncol 2022; 13(8): 675-687
- URL: https://www.wjgnet.com/2218-4333/full/v13/i8/675.htm
- DOI: https://dx.doi.org/10.5306/wjco.v13.i8.675
Breast cancer (BC) is the most common malignant tumor in women. In 2019, 268600 new BC patients and 41760 new BC deaths were reported, accounting for 30% of all new cancer cases and 15% of cancer-related deaths, respectively. The mortality of BC is second only to lung cancer[1]. In recent years, BC outcome has significantly improved and treatment strategies such as surgery, chemotherapy, radiotherapy, endocrine therapy, and targeted therapy have achieved fine clinical benefits[2], whereas patients with distant metastases are almost incurable[3]. In addition, even after resection of the primary tumor, 30% of early BC is prone to recurrence in distant organs[4]. In clinical practice, the treatment and prognosis of different molecular subtypes of BC are significantly different: estrogen receptor-positive (ER+) patients prefer endocrine therapy, human epidermal growth factor receptor 2-positive (HER2+) patients prefer targeted therapy, and poorly differentiated tumors are usually associated with a poor prognosis[5-7].
Recent studies have found that the occurrence and development of BC are related to many molecular markers. For example, the expression of cluster of differentiation 82 is significantly decreased in BC and is associated with disease progression and metastasis[8]. In addition, a study on triple-negative BC suggested that multiple long noncoding RNAs are associated with prognosis, including MAGI2-AS3, GGTA1P, NAP1L2, CRABP2, SYNPO2, MKI67, and COL4A6[9]. Advances in microarray and high-throughput sequencing technology provide strong support for the development of more reliable prognostic markers[10,11]. Genome wide expression profiling can reveal molecular changes in the process of tumorigenesis and development, and has proven to be an efficient method to identify key genes[12]. Therefore, it is particularly important to explore more sensitive and specific biomarkers to further understand the pathogenesis of BC and the choice of treatment strategies.
This public database-based study explored potential hub genes in the occurrence and development of BC through bioinformatics analysis of the gene expression profile and clinical characteristics of BC, in order to provide new biological targets and directions for the clinical diagnosis and treatment of BC.
The Cancer Genome Atlas (TCGA) database is a cancer research project established by the. National Cancer Institute and National Human Genome Research Institute. It aims to understand the mechanism of carcinogenesis and development of cancer cells and develop new diagnosis and treatment methods by collecting various types of cancer-related omics data. In this study, 1203 breast samples (fragments per kilobase million [FPKM] format) were downloaded from TCGA database (https://portal.gdc.cancer.gov/), including 1090 tumor samples and 113 normal samples. For a more accurate comparison of gene expression, FPKM data were converted to transcripts per million (TPM). At the same time, 1097 tumor samples containing clinical information were downloaded, and the data that did not match the expression samples were excluded. The remaining 1089 tumor samples were included in the univariate Cox regression analysis. Overall survival (OS) was taken as the endpoint event, and gene expression in TPM format was converted to log2 (x + 1).
Limma package of R software (version 3.6.3) was employed for differential gene analysis[13], using the adjusted P-value (adj P-value) to avoid false-positive results. The inclusion criteria of DEGs were: | log2 fold change (FC) | > 2 and adjusted P < 0.01. The ggplot2 package of R software was used to generate a volcano plot to visualize these differential genes.
DEGs were converted into gene ID through org.Hs.eg.db package of R software, and then Kyoto Encyclopedia of Genes and Genomes (KEGG) enrichment analysis was carried out by R software's clusterProfiler and enrichlot program package. ggplot2 program package was used to display the top 10 enrichment items, and adjusted P < 0.05 was considered statistically significant.
The survival package of R software was used to carry out univariate Cox regression analysis on 1089 BC samples with survival information. The median value of expression was set as the cut-off point between the high expression and low expression groups, and differential genes related to prognosis were obtained for subsequent analysis. P < 0.05 was considered statistically significant.
The STRING database (https://string-db.org/) is a search tool for searching interacting genes, which aims to construct protein-protein interaction (PPI) networks of different genes based on known and predicted PPIs, and analyze the proteins that interact with each other[14]. Based on the online tool STRING, PPI of prognosis-related DEGs was constructed, and the confidence score was ≥ 0.4. Then the PPI network was visualized by Cytoscape software (version 3.7.2). In addition, using the CytoHubba plug-in of Cytoscape software to calculate the gene degree through the “degree” method, the top 10 genes were taken as the hub genes for subsequent analysis and verification.
The Kaplan-Meier plotter (http://kmplot.com/analysis/) can use 18674 cancer samples to evaluate the impact of 54675 genes on survival[15]. These studies included recurrence-free survival and OS information of 5143 cases of BC, 1816 cases of ovarian cancer, 2437 cases of lung cancer, 1065 cases of gastric cancer, and 364 cases of liver cancer, which are mainly based on Gene Expression Omnibus, TCGA, and European Genome-phenome Archive databases. The role of the tool is to benefit patients in clinical decision making, health care policy, and resource allocation through meta-analysis of biomarker assessment[16]. In this study, we analyzed the OS rate of 10 hub genes in BC using the Kaplan-Meier plotter. According to the median expression of each hub gene in Kaplan-Meier plotter, the patients were divided into two groups to present the difference in survival probability between the high expression group and the low expression group. A total of 14 datasets were enrolled in our analysis according to the Kaplan-Meier web tool and detailed retrospective clinical information in http://kmplot.com/analysis/. P < 0.05 was considered statistically significant.
To further investigate the prognostic value of the hub genes selected above, we performed the log-rank test on these hub genes in molecular subtypes of BC based on TCGA cohort. Through the PAM50 algorithm, TCGA cohort was separated into five major subtypes: luminal A, luminal B, HER2 enriched, basal-like, and normal-like. This method was completed through utilizing the “genefu” R package according to detailed operation protocol.
The Gene Expression Profiling Interactive Analysis (GEPIA) database was employed to verify the mRNA expression levels of 10 hub genes in normal breast tissues and cancer tissues. GEPIA database contains data from 9736 tumor samples and 8587 normal samples, which were used to display the mRNA expression levels of each key gene in cancer and non-cancer tissues[17]. The protein expression levels of 10 hub genes in human normal tissues and BC tissues were analyzed using the human protein atlas database (HPA), which contains immunohistochemical expression data covering about 20 of the most common types of cancer[18].
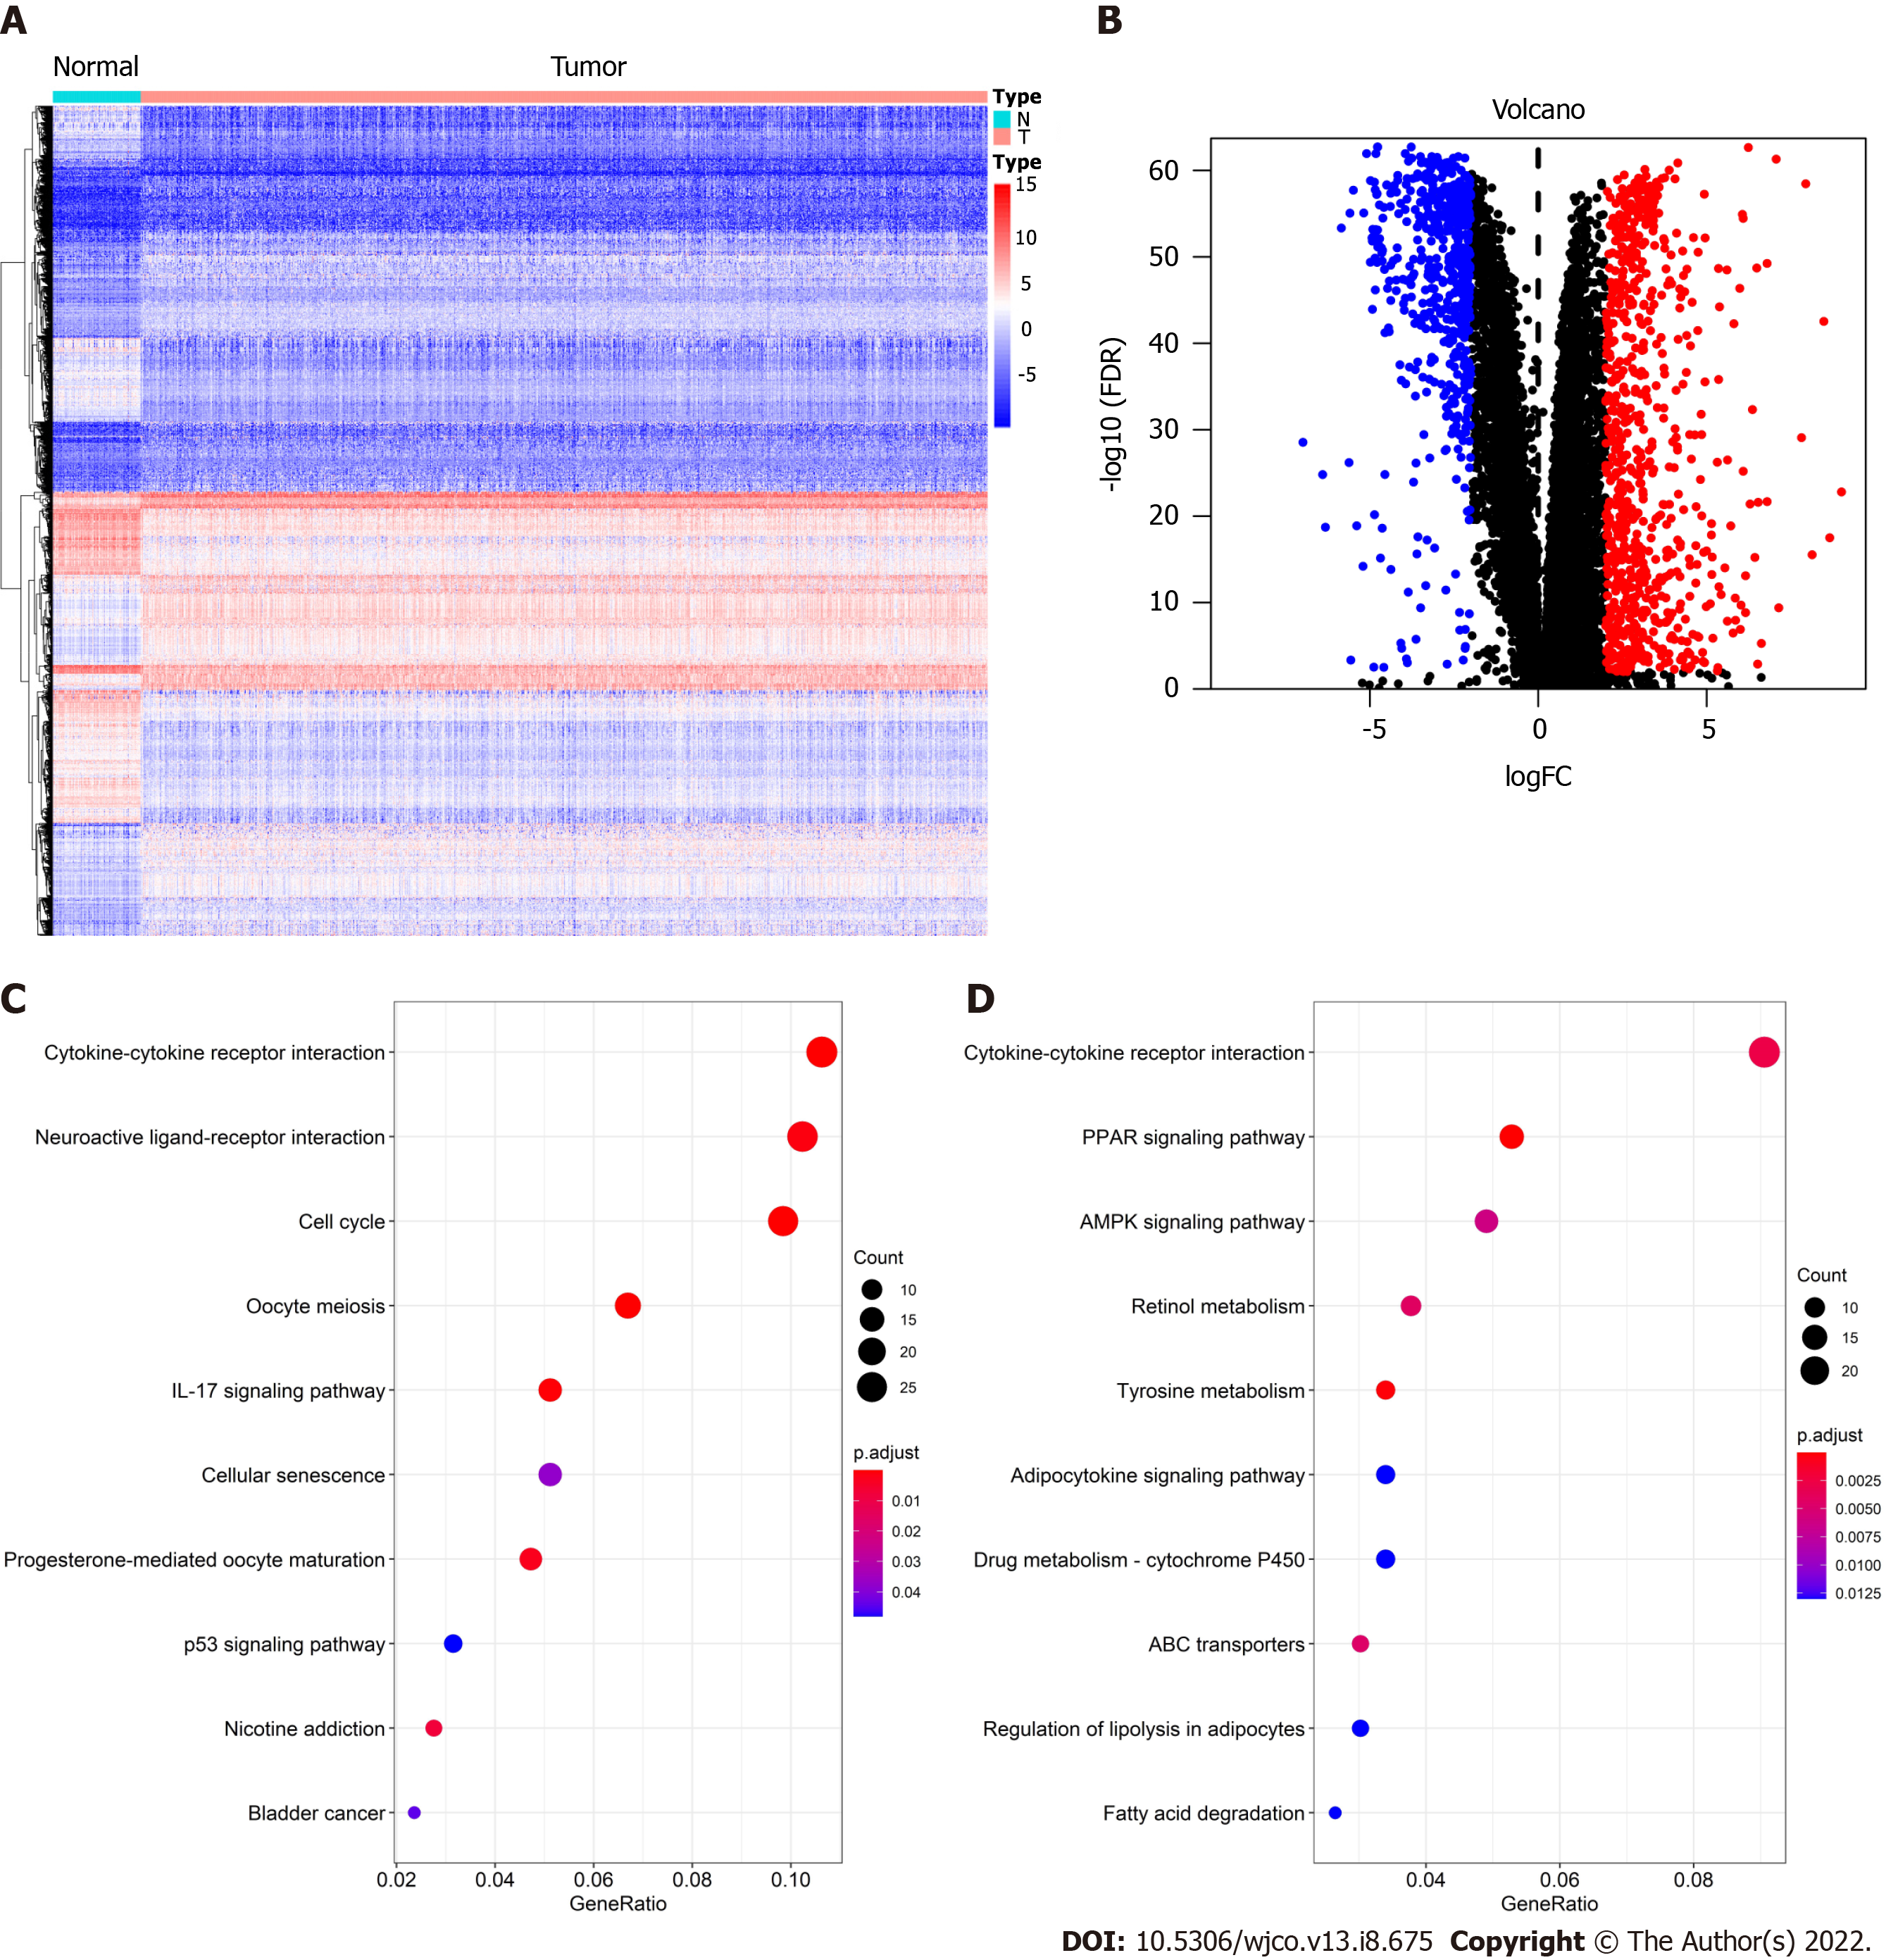
After DEG analysis of 113 normal breast samples and 1090 BC samples, we found that there were 1317 DEGs, of which 744 were upregulated and 573 were downregulated in BC. As shown in Figure 1A, red represents high expression and blue represents low expression. At the same time, the volcano plot was used to present the distribution of DEGs (Figure 1B), the red dots represent upregulated genes and the blue dots represent downregulated genes.
To further understand the biological function of these 1317 DEGs, the clusterProfiler and enrichplot packages of R software were used to perform KEGG enrichment analysis on these DEGs. The enrichment analysis results of upregulated genes and downregulated genes are shown in Figure 1C and D, respectively. The top 10 upregulated genes were the cytokine-cytokine receptor interaction, neuroactive ligand-receptor interaction, cell cycle, oocyte meiosis, interleukin 17 signaling pathway, cellular senescence, progesterone-mediated oocyte maturation, p53 signaling pathway, nicotine addiction, and bladder cancer. The 10 ten downregulated genes were the cytokine-cytokine receptor interaction, peroxisome proliferator-activated receptor (PPAR) signaling pathway, AMP-activated protein kinase (AMPK) signaling pathway, retinol metabolism, tyrosine metabolism, adipocytokine signaling pathway, drug metabolism - cytochrome p450, ATP-binding cassette transporters, regulation of lipolysis in adipocytes, and fatty acid degradation.
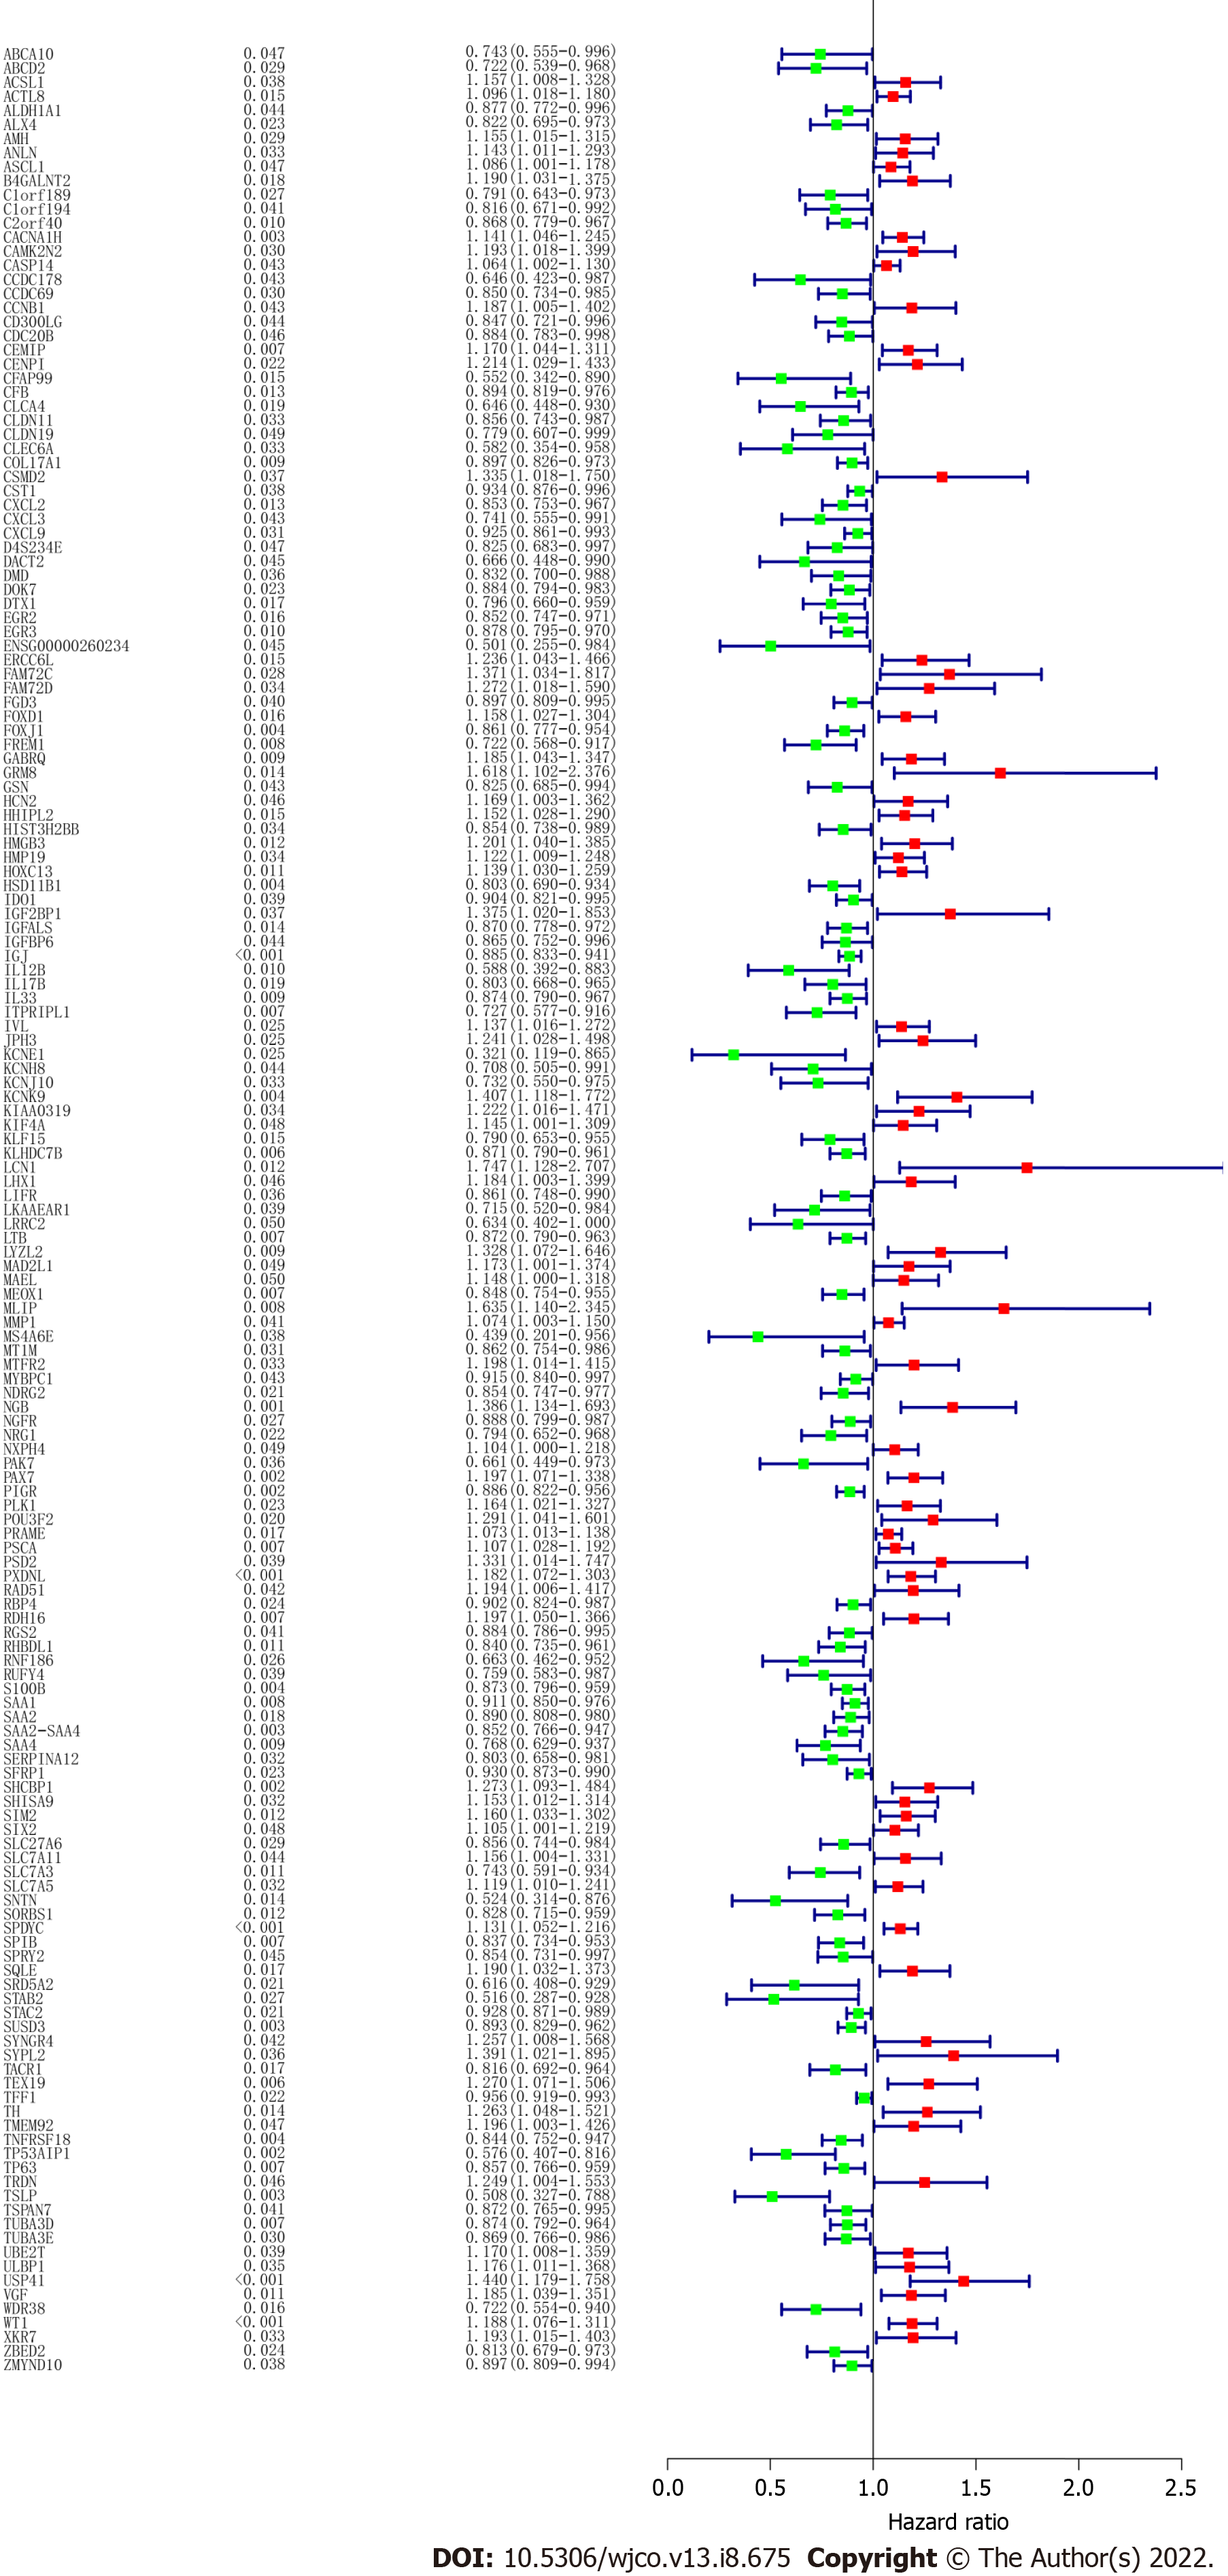
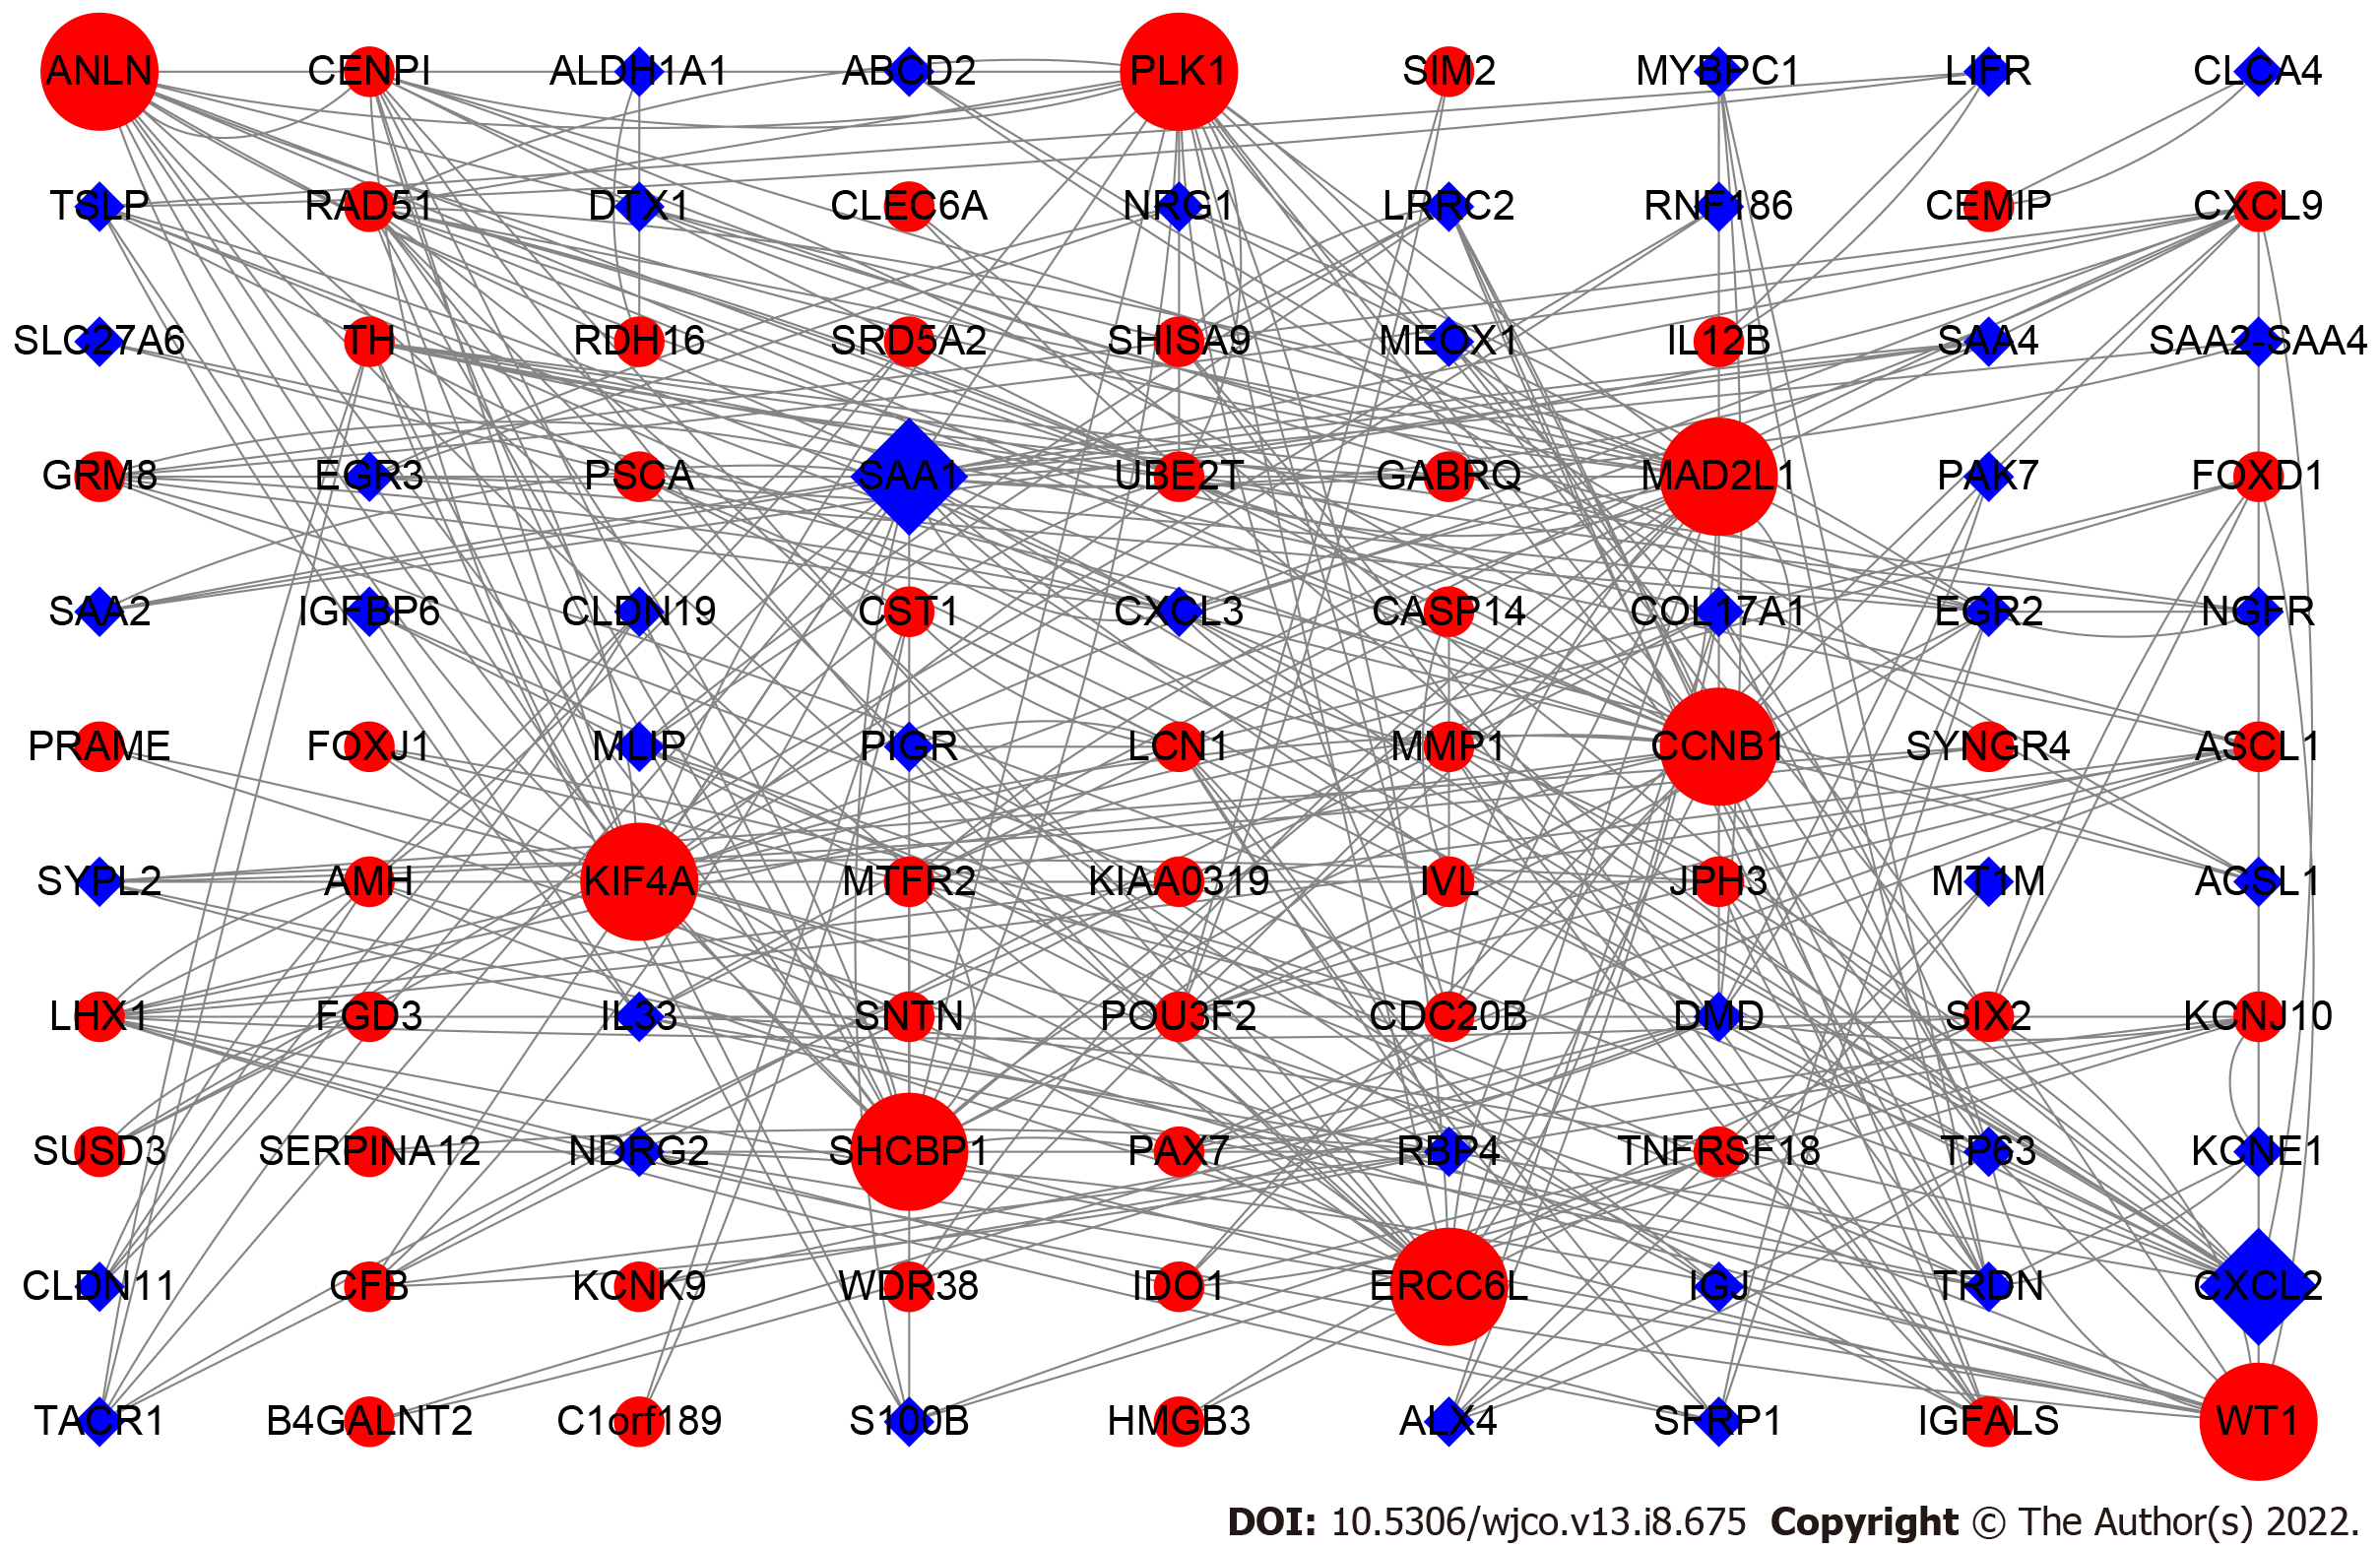
To screen the DEGs related to the prognosis of BC, we used the survival package of R software to perform univariate Cox regression analysis on 1317 DEGs, and found that the prognosis of 165 genes was statistically significant (Supplementary Table 1). As shown in Figure 2, further analysis of the PPI of these 165 genes revealed that there were a total of 164 nodes and 156 interactions (edges), and the confidence score adopted default value ≥ 0.4. The CytoHubba algorithm of Cytoscape software was used to calculate the degree score of each node. The top 10 genes were MAD2L1, PLK1, SAA1, CCNB1, SHCBP1, KIF4A, ANLN, ERCC6L, CXCL2, and WT1 (Figure 3). The upregulated genes were represented by red and round nodes, and the downregulated genes were represented by blue and diamond nodes. The node size represented the level, and most of the hub genes were upregulated DEGs. Gene annotation and grade scores are shown in Table 1.
| Genes | Gene name | Grade |
| MAD2L1 | MAD2 mitotic arrest deficient-like 1 | 24 |
| PLK1 | Polo-like kinase 1 | 22 |
| SAA1 | Serum amyloid A1 | 22 |
| CCNB1 | Cyclin B1 | 20 |
| SHCBP1 | SHC SH2-domain binding protein 1 | 18 |
| KIF4A | Kinesin family member 4A | 18 |
| ANLN | Actin binding protein | 16 |
| ERCC6L | Excision repair cross-complementation group 6-like | 16 |
| CXCL2 | Chemokine (C-X-C motif) ligand 2 | 16 |
| WT1 | Wilms tumor 1 | 14 |
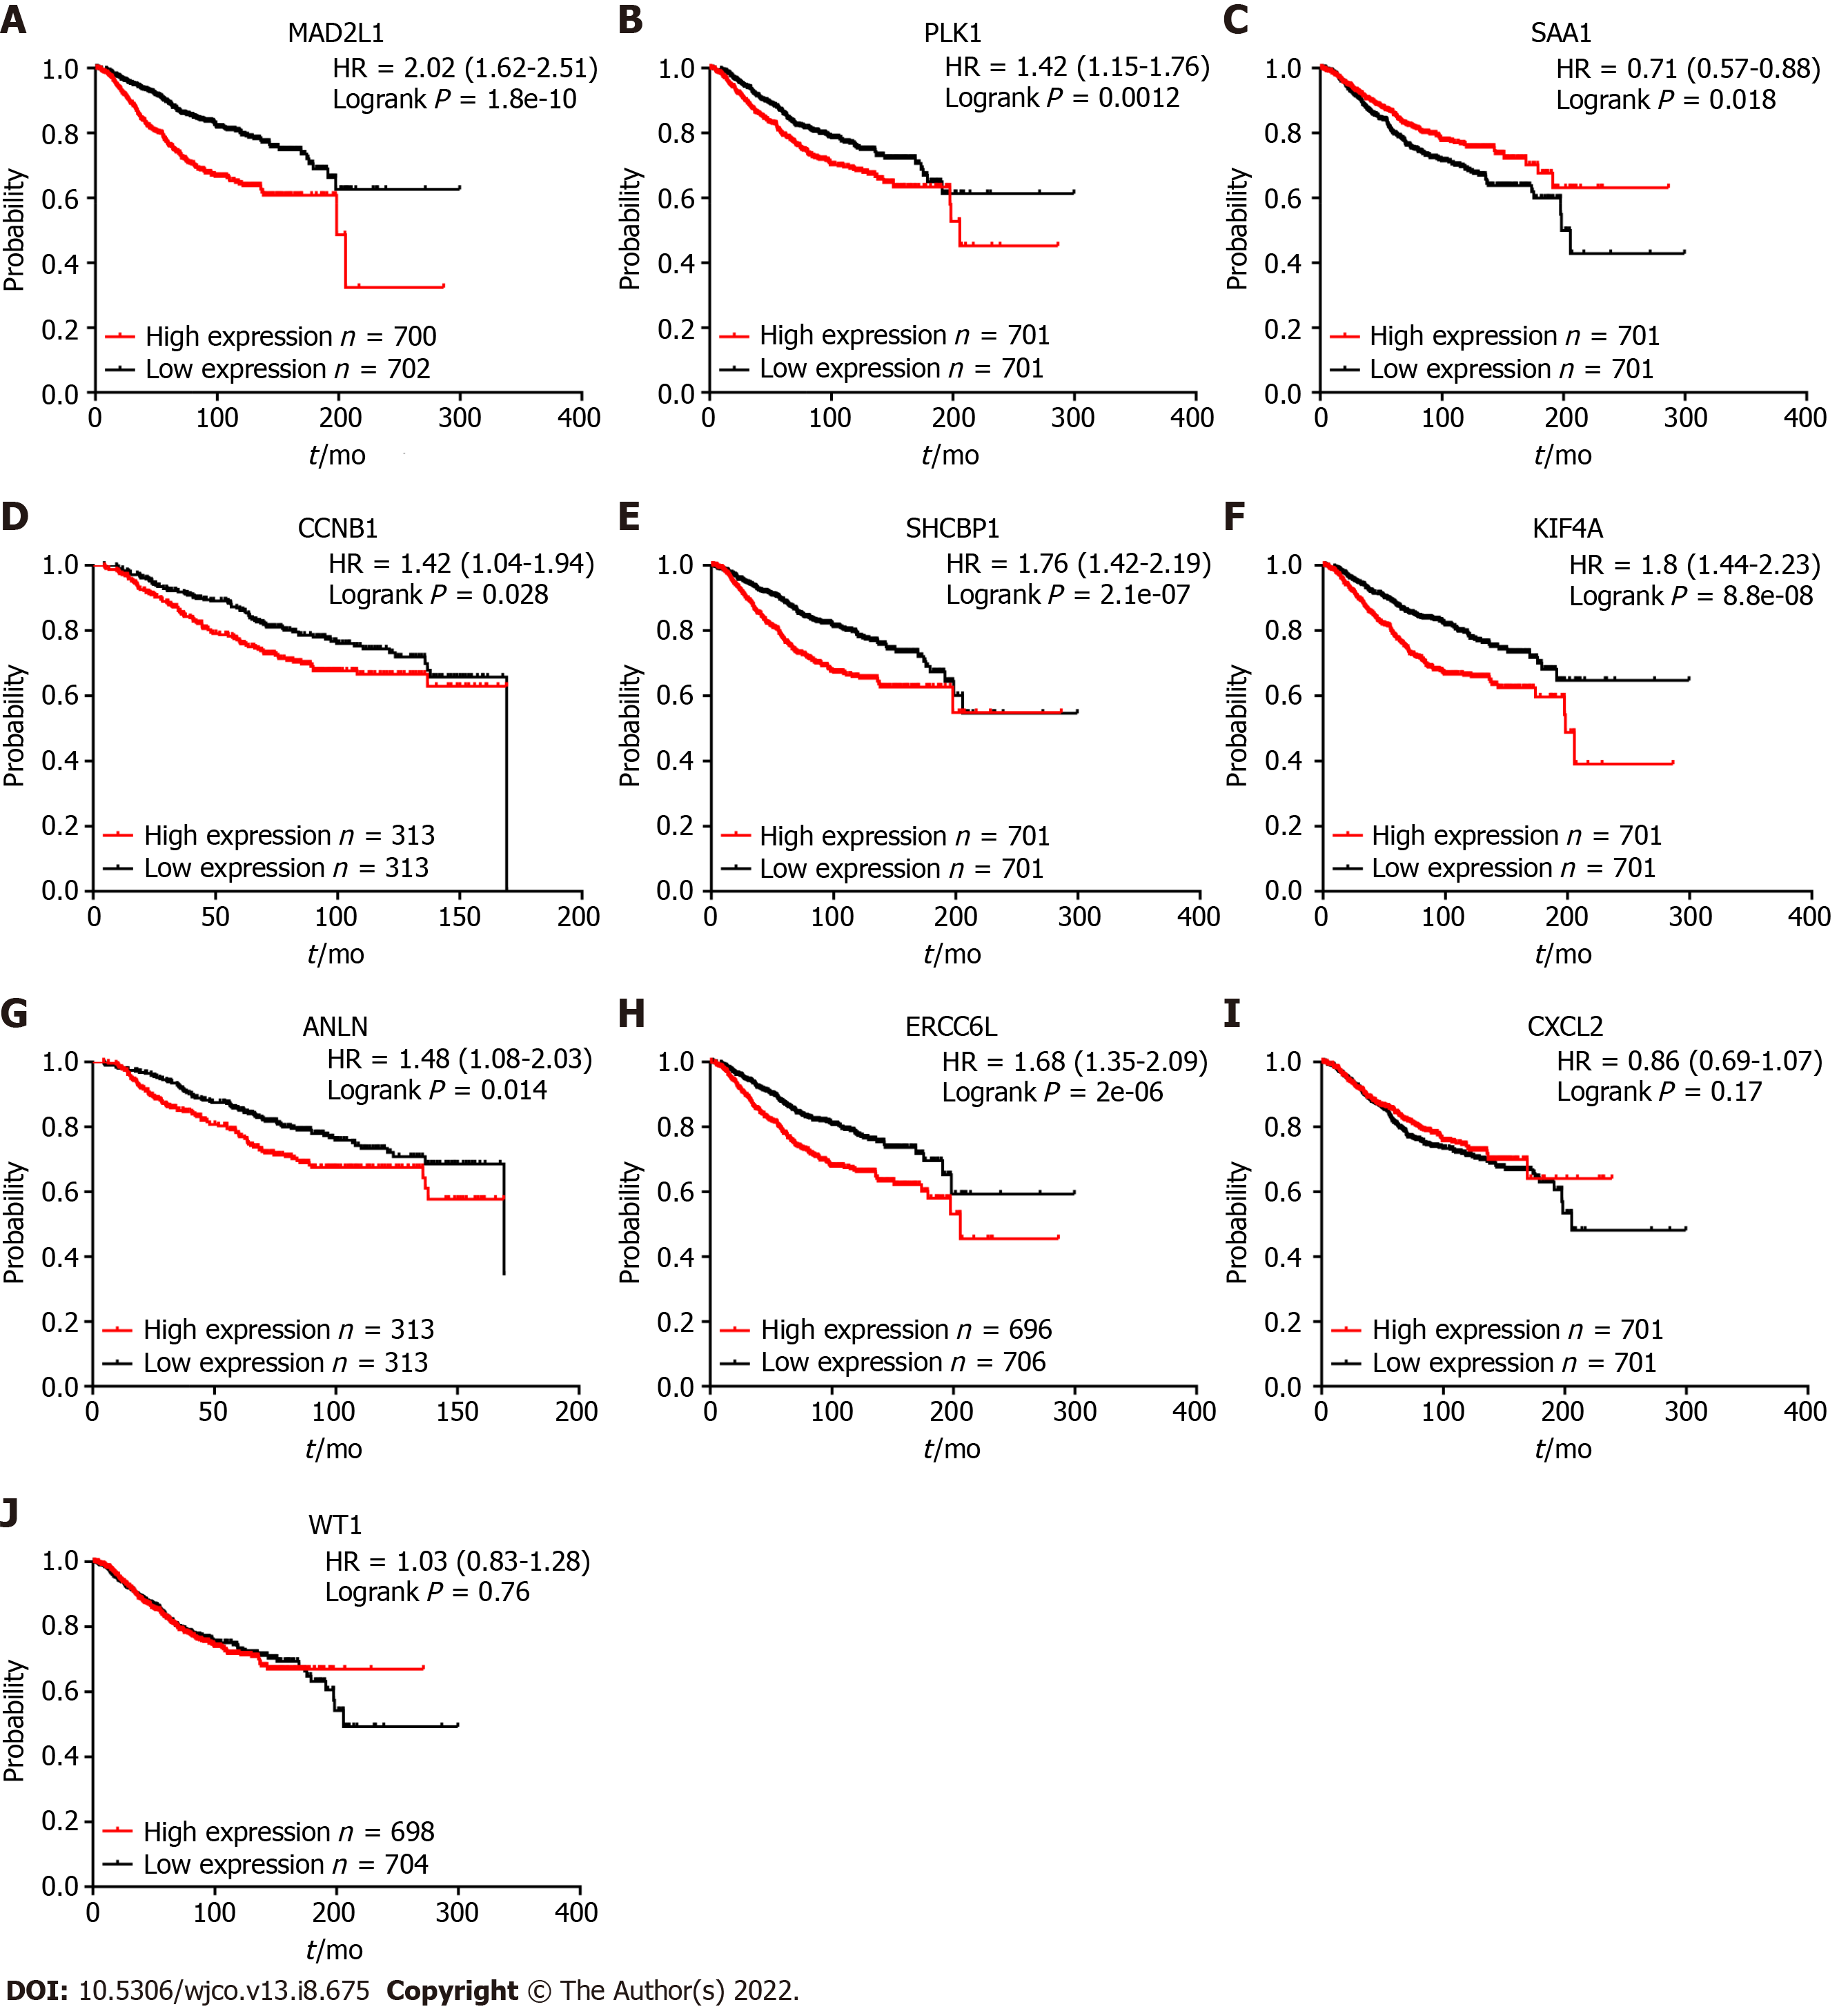
Kaplan-Meier plotter was used to explore the prognostic value of 10 hub genes in BC. The results showed that, except for CXCL2 [hazard ratio (HR) 0.86 (0.69-1.07); P = 0.170] and WT1 [HR 1.03 (0.83-1.28); P = 0.760], the highly expressed MAD2L1 [HR 2.02 (1.62-2.51); P = 1.8e-10], PLK1 [HR 1.42 (1.15-1.76); P = 0.0012], CCNB1 [HR 1.42 (1.04-1.94); P = 0.028], SHCBP1 [HR 1.76 (1.42-2.19); P = 2.1 e-07], KIF4A [HR 1.8 (1.44-2.23); P = 8.8e-08], ANLN [HR 1.48 (1.08-2.03); P = 0.014], and ERCC6L [HR 1.68 (1.35-2.09); P = 2e-06] were related to the poor OS rate of BC patients. By contrast, the high expression of SAA1 [HR 0.71 (0.57-0.88); P = 0.018] was associated with a better OS rate for BC patients (Figure 4).
We also conducted the survival analysis of these 10 hub genes in TCGA molecular subtypes. As a result, TCGA cohort was successfully divided into five subtypes based PAM50 identifier: 563 of luminal A, 215 of luminal B, 82 of HER2-enriched, 189 of basal-like, and 39 of normal-like. Then survival analysis of these 10 genes was performed in each subtype group. The results indicated that CXCL2 (HR = 0.45; P < 0.05) and SAA1 (HR = 0.53; P < 0.05) were protective factors in the luminal A subtype (Figure 5). ANLN (HR = 2.12; P < 0.05), ERCC6L (HR = 3.04; P < 0.05), KIF4A (HR = 2.50; P < 0.05), PLK1 (HR = 2.40; P < 0.05), and SHCBP1 (HR = 2.42; P < 0.05) were hazard factors in luminal B subtype, whereas the CXCL2 (HR = 0.45; P < 0.05) showed protective effects. Finally, KIF4A (HR = 4.31; P < 0.05) acted as a risk factor in HER2-enriched patients and CXCL2 played a satisfactory role among basal-like patients (HR = 0.46; P < 0.05).
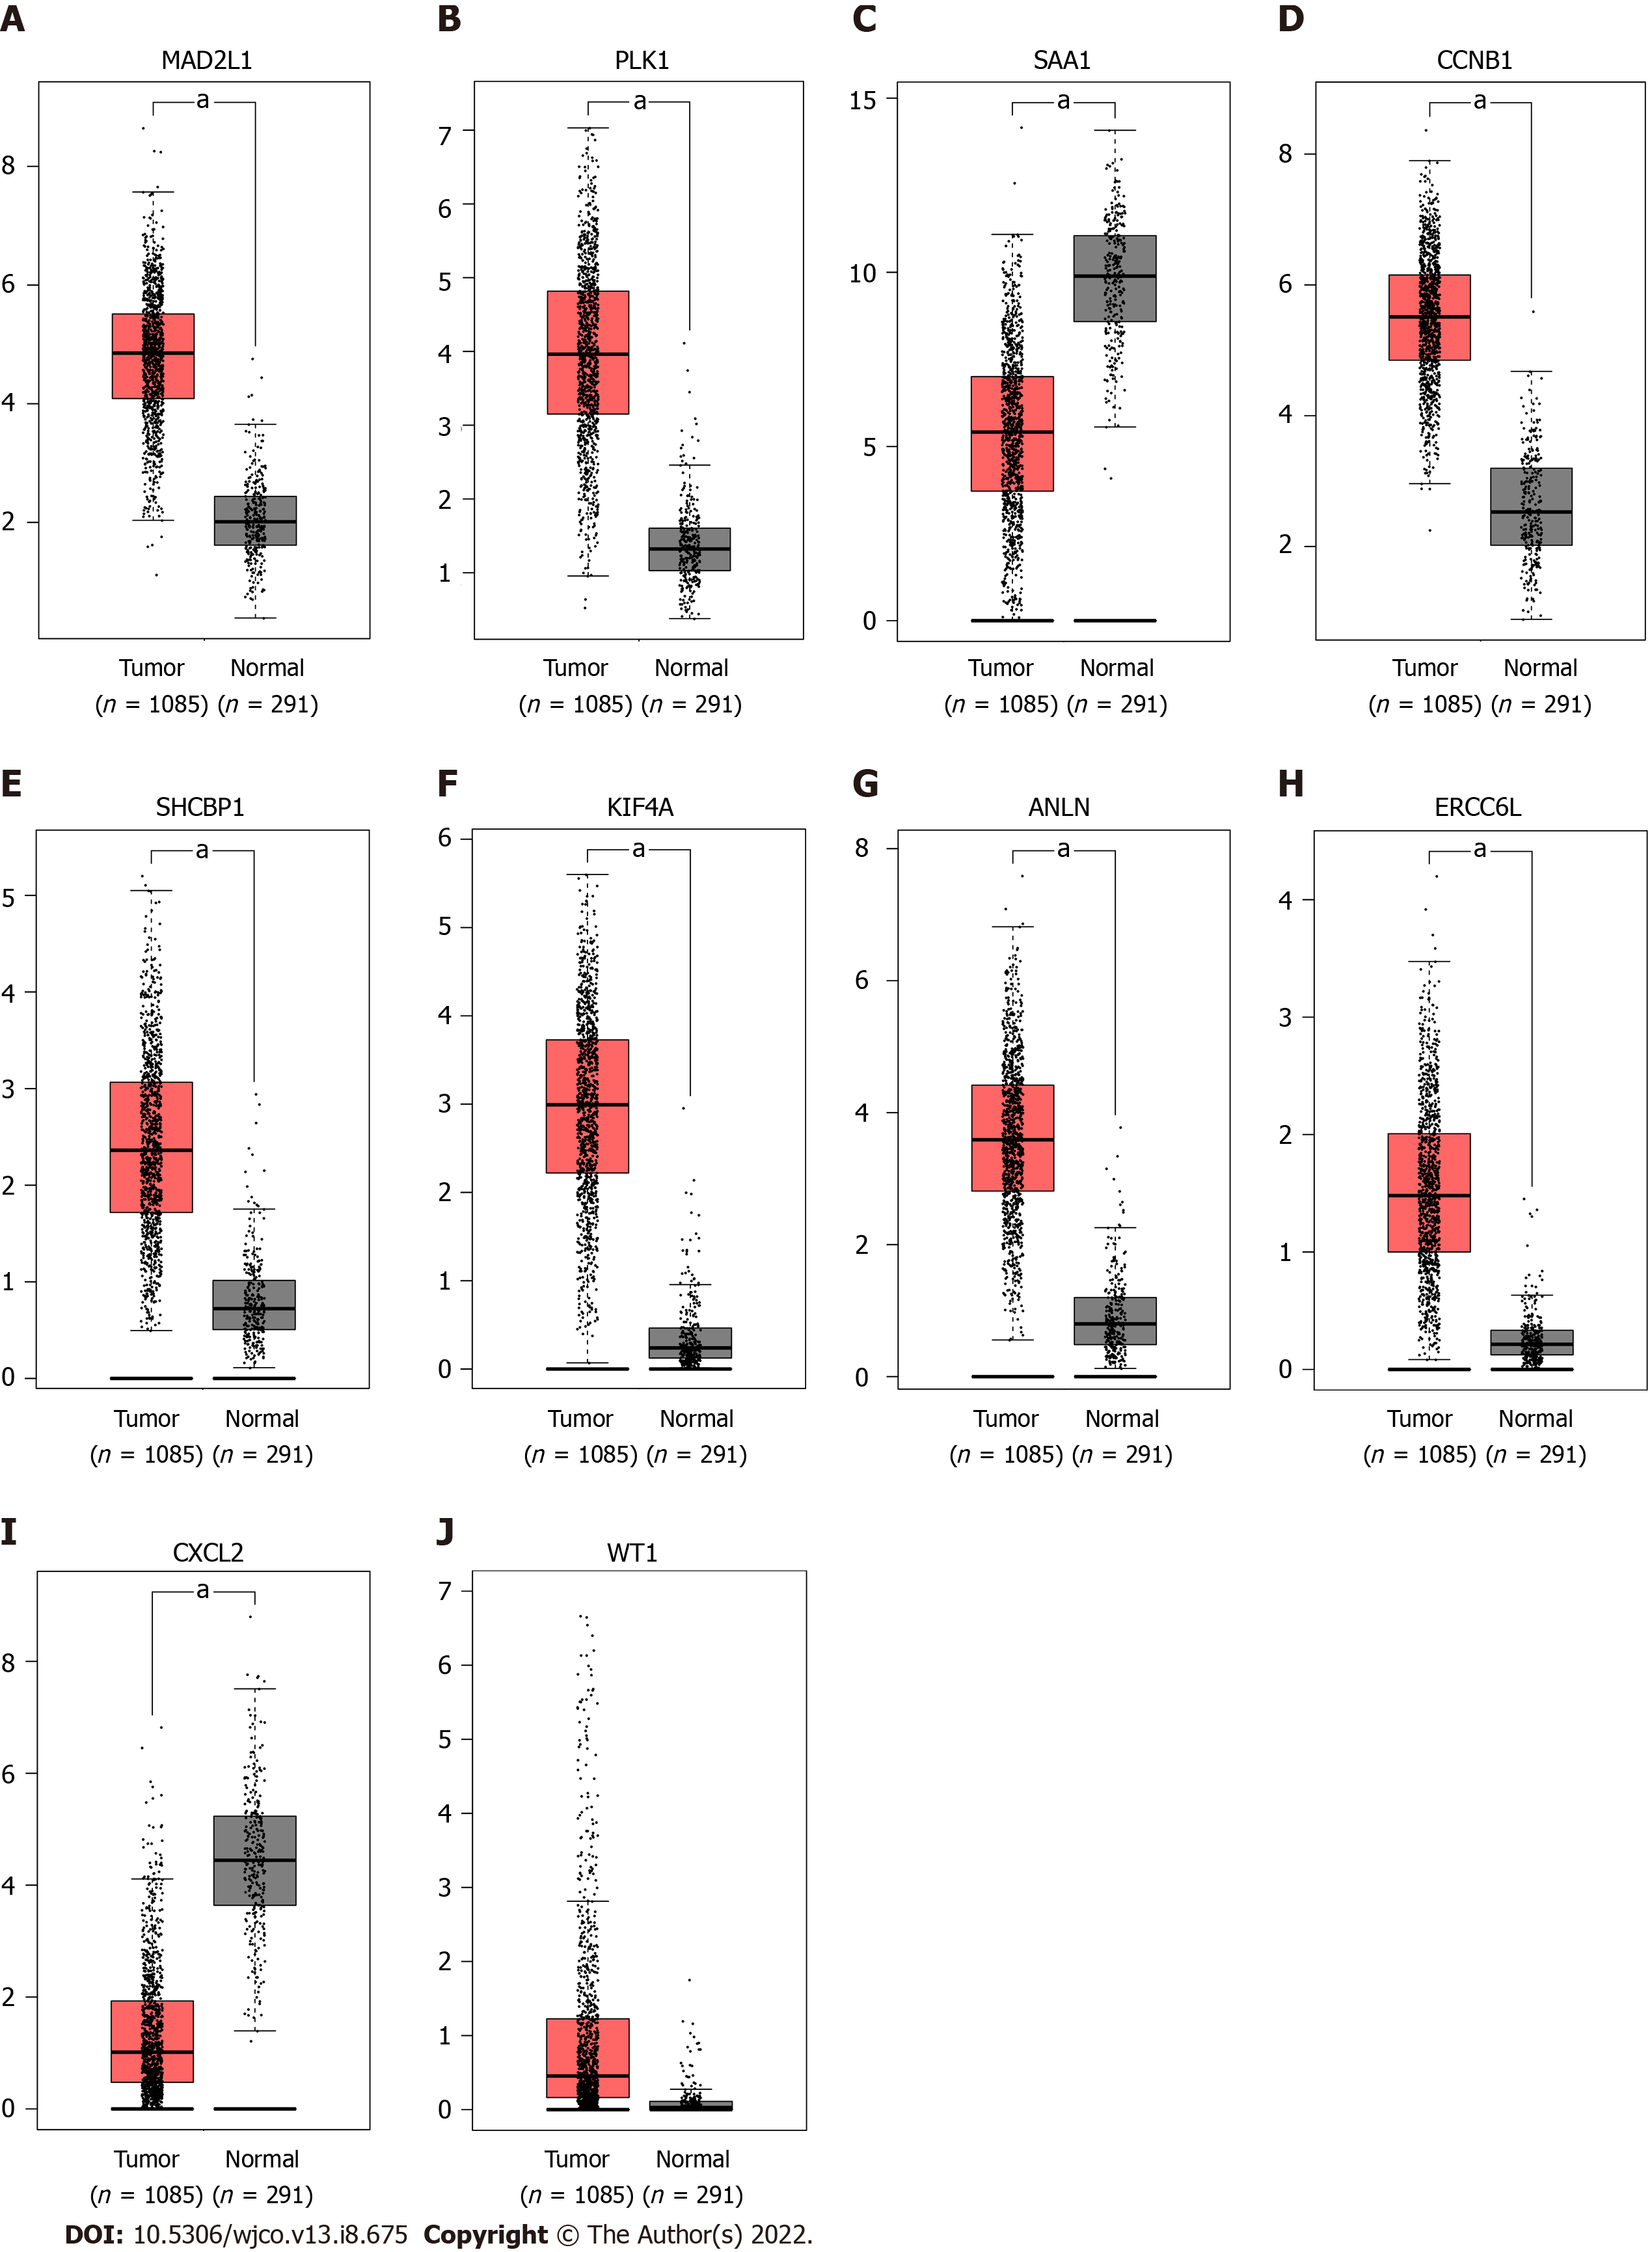
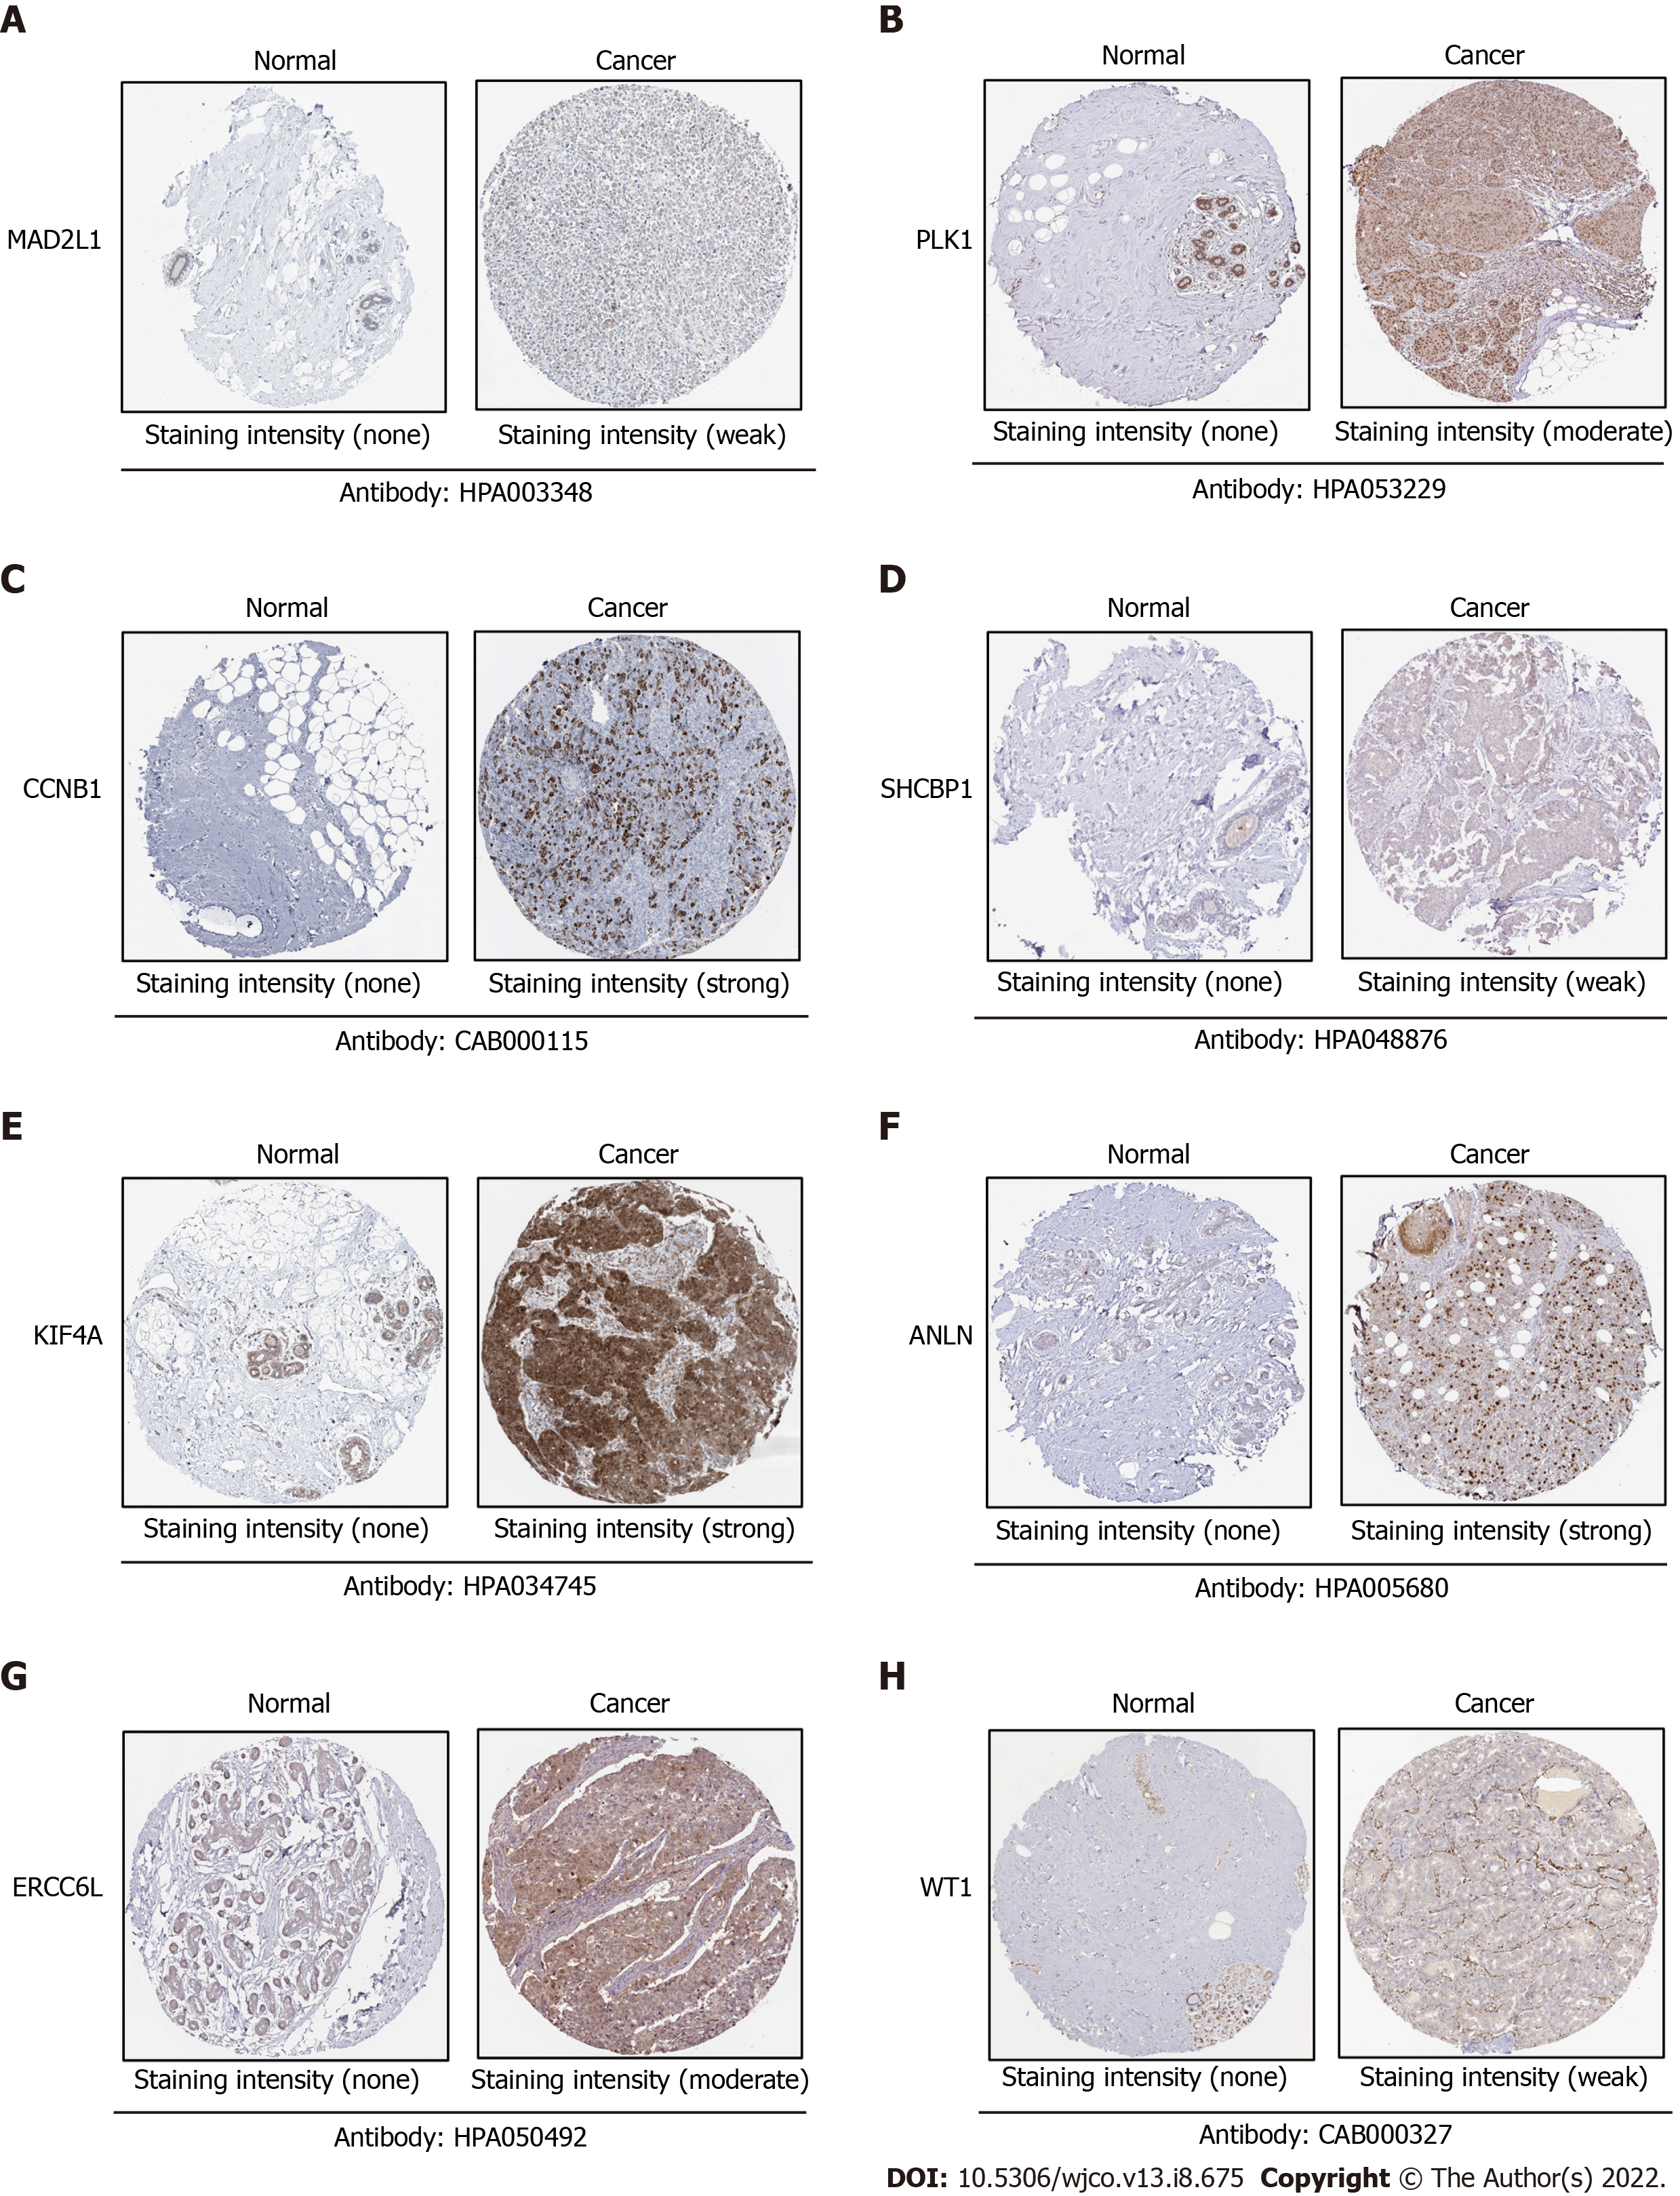
To verify the expression differences of key genes in BC, GEPIA was employed to analyze the mRNA expression levels of MAD2L1, PLK1, SAA1, CCNB1, SHCBP1, KIF4A, ANLN, ERCC6L, CXCL2, and WT1 between BC and non-cancerous tissues (Figure 5). Compared with non-cancerous tissues, MAD2L1 (Figure 5A), PLK1 (Figure 5B), CCNB1 (Figure 5D), SHCBP1 (Figure 5E), KIF4A (Figure 5F), ANLN (Figure 5G), and ERCC6L (Figure 5H) in BC tissues were significantly upregulated (P < 0.01); SAA1 (Figure 5C) and CXCL2 (Figure 5I) were significantly downregulated in BC (P < 0.01); and WT1 (Figure 5J) tended to increase in BC tissues. After verifying the mRNA expression level of hub genes, we used the HPA database to verify the protein expression level of these hub genes in BC. It is worth noting that MAD2L1 (Figure 6A), PLK1 (Figure 6B), CCNB1 (Figure 6C), SHCBP1 (Figure 6D), ANLN (Figure 6F), ERCC6L (Figure 6G), and WT1 (Figure 6H) were not expressed in normal breast tissues, but expressed in different levels in BC tissues. KIF4A (Figure 6E) was moderately expressed in normal breast tissues and highly expressed in BC tissues. In short, the expression of hub genes was consistent with the results of differential analyses at both the mRNA and protein levels.
In this study, we used bioinformatics analysis to screen and verify potential biomarkers associated with BC. After comparing the gene expression matrix of breast tissue retrieved from TCGA database, 744 upregulated DEGs and 573 downregulated DEGs were successfully identified. Combined with the survival data, 165 prognostic-related DEGs were analyzed. According to PPI network analysis, the top 10 node genes were ranked: MAD2L1, PLK1, SAA1, CCNB1, SHCBP1, KIF4A, ANLN, ERCC6L, CXCL2, and WT1. After subsequent survival analysis and expression analysis verification, the expression and prognosis of MAD2L1, PLK1, SAA1, CCNB1, SHCBP1, KIF4A, ANLN, and ERCC6L in BC were finally confirmed. These eight hub genes may play a vital role in the occurrence and development of BC.
Among the 1317 identified DEGs, significant gene expression dysregulation was observed in the cell cycle, PPAR signaling pathway, and AMPK signaling pathway. Cell cycle is a highly conserved process in human evolution and is essential for the normal growth of cells. Abnormal cell cycle is a hallmark of human cancer[19]. Recent studies have also identified several genes related to the cell cycle, including CCNB1, ANLN, MAD2L1, and PLK1. For example, CCNB1 may be a biomarker for the prognosis of ER+ BC patients and monitoring the efficacy of hormone therapy[20]. Recent studies have found that the occurrence and proliferation of gastric cancer cells induced by ISL1 is mediated by the expression and regulation of CCNB1, CCNB2, and C-MYC[21]. In addition, the high expression of ANLN in BC cell nuclei is significantly related to tumor tissue size, histopathological grade, high proliferation rate, and a worse prognosis[22]. MAD2L1 is a mitotic spindle checkpoint gene. In patients with primary BC, compared with patients with ER+, PR+ and low-grade tumors, patients with ER-, PR- and high-grade tumors have higher expression of MAD2L1, and high expression of MAD2L1 is associated with a poor OS[23]. PLK1 is a key oncogene that can regulate the transition of cells in the G2-M phase, thus promoting the growth and metastasis of tamoxifen resistant BC[24]. These studies are consistent with our current conclusion that CCNB1, ANLN, MAD2L1, and PLK1, as key genes, are overexpressed in BC tissues, and their overexpression is correlated with poor prognosis. Meanwhile, the PPAR signaling pathway may be an important predictor of BC response to neoadjuvant chemotherapy[25], and activation of the AMPK signaling pathway can inhibit the activity of the Wnt/β-catenin signaling pathway, thereby inhibiting the growth of BC cells[26]. These studies showed that the identified DEGs play a critical role in the occurrence and development of BC, and the hub genes among them may serve as prognostic markers and are worth further investigation.
With the exception of CCNB1, ANLN, MAD2L1, and PLK1, the gene combination model of CD74, MMP9, RPA3, and SHCBP1 in the tumor microenvironment (TME) can effectively predict the prognosis and disease risk of BC patients[27], while their potential mechanism remains unknown. In addition, the circKIF4A-miR-375-KIF4A axis can regulate the development of triple-negative BC through competing endogenous RNA, and circKIF4A can act as a prognostic biomarker and therapeutic target for triple-negative BC[28].
SAA1 is a serum amyloid protein family member that is highly expressed in non-small cell lung cancer, and is associated with a poor prognosis and tyrosine kinase inhibitors[29]. SAA1 has low expression in hepatocellular carcinoma, and the high expression of SAA1 is associated with a better prognosis[30]. To date, SAA1 has not been reported in BC, and the specific role and function of this gene in BC require further experimental exploration and clinical specimen verification. ERCC6L is a newly discovered DNA helicase. In the human BC cell line MDA-MB-231, exogenous interference with the expression of ERCC6L can inhibit the growth of BC cells[31]. However, its role and specific mechanism in clinical specimens are still unknown. The expression of ERCC6L is upregulated in clear cell renal cell carcinoma, and the highly expressed ERCC6L can promote the proliferation of clear cell renal cell carcinoma cells by regulating the mitogen-activated protein kinase signaling pathway[32]. In this study, we found that SAA1 and ERCC6L may be used as prognostic markers for BC, whereas there are few reports on these two genes, and further research is necessary.
In this study, we found that the differential expression of the eight hub genes are related to the occurrence and development of BC, and are significantly related to the OS rate, which indicate that these hub genes may be utilized as potential prognostic biomarkers and therapeutic targets for BC. This study had some limitations. First, due to the complexity of the dataset in the public database, it is difficult to consider some important confounding factors such as different ages, races, regions, and tumor stages when analyzing DEGs. Second, according to the results, seven key genes were upregulated in BC and one key gene was downregulated, but the mechanism of their differential expression is still unclear, and more studies are needed to confirm their biological basis. Finally, this study focused on the expression level and OS rate of the eight hub genes, and whether these key genes can be used as biomarkers and can improve the diagnostic accuracy and specificity of BC requires further research.
In conclusion, based on comprehensive bioinformatics analysis, this study identified 1317 DEGs related to the occurrence and development of BC, 165 DEGs related to prognosis, and 8 hub genes (MAD2L1, PLK1, SAA1, CCNB1, SHCBP1, KIF4A, ANLN and ERCC6L). Each of these eight hub genes has different expression levels in BC and is significantly related to prognosis. The results of this study indicate that studying these DEGs would help us have a deeper understanding of the molecular mechanisms of the pathogenesis and progression of BC. Moreover, these hub genes may serve as potential prognostic markers and therapeutic targets for BC, which provides a reference for more in-depth and extensive prospective clinical research.
Breast cancer (BC) is the most common malignant tumor in women. In 2019, 268600 new BC patients and 41760 new BC deaths were reported, accounting for 30% of all new cancer cases and 15% of cancer-related deaths. Therefore, it is particularly important to explore more sensitive and specific biomarkers for further understanding the pathogenesis of BC and the choice of treatment strategies.
Exploring more valuable therapeutic targets would be helpful in treating with high efficacy.
This study aimed to identify novel biomarkers for BC.
The limma package of R software and clusterProfiler package were used to analyze the differentially expressed genes (DEGs) in tumor tissues compared with the normal tissues, respectively. The protein-protein interaction network (PPI) analysis was used to investigate the hub-genes through cytohubba algorithm by the Cytoscape software. Survival analysis of the hub-genes were carried out through the Kaplan-Meier database. The expression level of these hub-genes was validated in the GEPIA database and the Human Protein Atlas database.
Upregulated genes mainly enriched in the cytokine-cytokine receptor interaction, cell cycle, and p53 signaling pathway (P < 0.01). The downregulated genes were mainly enriched in the cytokine-cytokine receptor interaction, peroxisome proliferator-activated receptor signaling pathway, and AMP-activated protein kinase signaling pathway (P < 0.01).
MAD2L1, PLK1, SAA1, CCNB1, SHCBP1, KIF4A, ANLN, and ERCC6L may act as biomarkers for diagnosis and prognosis in BC patients.
Proper validations must be made in future studies.
Provenance and peer review: Unsolicited article; externally peer reviewed.
Peer-review model: Single blind
Specialty type: Oncology
Country/Territory of origin: China
Peer-review report’s scientific quality classification
Grade A (Excellent): 0
Grade B (Very good): B, B
Grade C (Good): 0
Grade D (Fair): 0
Grade E (Poor): 0
P-Reviewer: Kao TJ, Taiwan; Nakayama J, Japan S-Editor: Gong ZM L-Editor: Filipodia P-Editor: Gong ZM
| 1. | Siegel RL, Miller KD, Jemal A. Cancer statistics, 2019. CA Cancer J Clin. 2019;69:7-34. [RCA] [PubMed] [DOI] [Full Text] [Cited by in Crossref: 13300] [Cited by in RCA: 15476] [Article Influence: 2579.3] [Reference Citation Analysis (2)] |
| 2. | Shi H, Zhang L, Qu Y, Hou L, Wang L, Zheng M. Prognostic genes of breast cancer revealed by gene co-expression network analysis. Oncol Lett. 2017;14:4535-4542. [RCA] [PubMed] [DOI] [Full Text] [Full Text (PDF)] [Cited by in Crossref: 15] [Cited by in RCA: 16] [Article Influence: 2.0] [Reference Citation Analysis (0)] |
| 3. | Redig AJ, McAllister SS. Breast cancer as a systemic disease: a view of metastasis. J Intern Med. 2013;274:113-126. [RCA] [PubMed] [DOI] [Full Text] [Cited by in Crossref: 411] [Cited by in RCA: 509] [Article Influence: 42.4] [Reference Citation Analysis (0)] |
| 4. | McAllister SS, Gifford AM, Greiner AL, Kelleher SP, Saelzler MP, Ince TA, Reinhardt F, Harris LN, Hylander BL, Repasky EA, Weinberg RA. Systemic endocrine instigation of indolent tumor growth requires osteopontin. Cell. 2008;133:994-1005. [RCA] [PubMed] [DOI] [Full Text] [Cited by in Crossref: 323] [Cited by in RCA: 331] [Article Influence: 19.5] [Reference Citation Analysis (0)] |
| 5. | Zhang Y, Lv F, Yang Y, Qian X, Lang R, Fan Y, Liu F, Li Y, Li S, Shen B, Pringle GA, Zhang X, Fu L, Guo X. Clinicopathological Features and Prognosis of Metaplastic Breast Carcinoma: Experience of a Major Chinese Cancer Center. PLoS One. 2015;10:e0131409. [RCA] [PubMed] [DOI] [Full Text] [Full Text (PDF)] [Cited by in Crossref: 38] [Cited by in RCA: 51] [Article Influence: 5.1] [Reference Citation Analysis (0)] |
| 6. | Clarke C, Madden SF, Doolan P, Aherne ST, Joyce H, O'Driscoll L, Gallagher WM, Hennessy BT, Moriarty M, Crown J, Kennedy S, Clynes M. Correlating transcriptional networks to breast cancer survival: a large-scale coexpression analysis. Carcinogenesis. 2013;34:2300-2308. [RCA] [PubMed] [DOI] [Full Text] [Cited by in Crossref: 227] [Cited by in RCA: 285] [Article Influence: 23.8] [Reference Citation Analysis (0)] |
| 7. | Krishnamurti U, Silverman JF. HER2 in breast cancer: a review and update. Adv Anat Pathol. 2014;21:100-107. [RCA] [PubMed] [DOI] [Full Text] [Cited by in Crossref: 147] [Cited by in RCA: 224] [Article Influence: 20.4] [Reference Citation Analysis (0)] |
| 8. | Wang X, Zhong W, Bu J, Li Y, Li R, Nie R, Xiao C, Ma K, Huang X. Exosomal protein CD82 as a diagnostic biomarker for precision medicine for breast cancer. Mol Carcinog. 2019;58:674-685. [RCA] [PubMed] [DOI] [Full Text] [Cited by in Crossref: 51] [Cited by in RCA: 76] [Article Influence: 12.7] [Reference Citation Analysis (0)] |
| 9. | Tian T, Gong Z, Wang M, Hao R, Lin S, Liu K, Guan F, Xu P, Deng Y, Song D, Li N, Wu Y, Dai Z. Identification of long non-coding RNA signatures in triple-negative breast cancer. Cancer Cell Int. 2018;18:103. [RCA] [PubMed] [DOI] [Full Text] [Full Text (PDF)] [Cited by in Crossref: 36] [Cited by in RCA: 39] [Article Influence: 5.6] [Reference Citation Analysis (0)] |
| 10. | Kulasingam V, Diamandis EP. Strategies for discovering novel cancer biomarkers through utilization of emerging technologies. Nat Clin Pract Oncol. 2008;5:588-599. [RCA] [PubMed] [DOI] [Full Text] [Cited by in Crossref: 498] [Cited by in RCA: 558] [Article Influence: 32.8] [Reference Citation Analysis (0)] |
| 11. | Chen B, Tang H, Chen X, Zhang G, Wang Y, Xie X, Liao N. Transcriptomic analyses identify key differentially expressed genes and clinical outcomes between triple-negative and non-triple-negative breast cancer. Cancer Manag Res. 2019;11:179-190. [RCA] [PubMed] [DOI] [Full Text] [Full Text (PDF)] [Cited by in Crossref: 28] [Cited by in RCA: 36] [Article Influence: 5.1] [Reference Citation Analysis (0)] |
| 12. | Li G, Liu Y, Liu C, Su Z, Ren S, Wang Y, Deng T, Huang D, Tian Y, Qiu Y. Genome-wide analyses of long noncoding RNA expression profiles correlated with radioresistance in nasopharyngeal carcinoma via next-generation deep sequencing. BMC Cancer. 2016;16:719. [RCA] [PubMed] [DOI] [Full Text] [Full Text (PDF)] [Cited by in Crossref: 37] [Cited by in RCA: 44] [Article Influence: 4.9] [Reference Citation Analysis (0)] |
| 13. | Diboun I, Wernisch L, Orengo CA, Koltzenburg M. Microarray analysis after RNA amplification can detect pronounced differences in gene expression using limma. BMC Genomics. 2006;7:252. [RCA] [PubMed] [DOI] [Full Text] [Full Text (PDF)] [Cited by in Crossref: 416] [Cited by in RCA: 457] [Article Influence: 24.1] [Reference Citation Analysis (0)] |
| 14. | Szklarczyk D, Franceschini A, Wyder S, Forslund K, Heller D, Huerta-Cepas J, Simonovic M, Roth A, Santos A, Tsafou KP, Kuhn M, Bork P, Jensen LJ, von Mering C. STRING v10: protein-protein interaction networks, integrated over the tree of life. Nucleic Acids Res. 2015;43:D447-D452. [RCA] [PubMed] [DOI] [Full Text] [Full Text (PDF)] [Cited by in Crossref: 6477] [Cited by in RCA: 7628] [Article Influence: 693.5] [Reference Citation Analysis (0)] |
| 15. | Lánczky A, Nagy Á, Bottai G, Munkácsy G, Szabó A, Santarpia L, Győrffy B. miRpower: a web-tool to validate survival-associated miRNAs utilizing expression data from 2178 breast cancer patients. Breast Cancer Res Treat. 2016;160:439-446. [RCA] [PubMed] [DOI] [Full Text] [Cited by in Crossref: 491] [Cited by in RCA: 590] [Article Influence: 65.6] [Reference Citation Analysis (0)] |
| 16. | Lacny S, Wilson T, Clement F, Roberts DJ, Faris P, Ghali WA, Marshall DA. Kaplan-Meier survival analysis overestimates cumulative incidence of health-related events in competing risk settings: a meta-analysis. J Clin Epidemiol. 2018;93:25-35. [RCA] [PubMed] [DOI] [Full Text] [Cited by in Crossref: 40] [Cited by in RCA: 63] [Article Influence: 9.0] [Reference Citation Analysis (0)] |
| 17. | Tang Z, Li C, Kang B, Gao G, Zhang Z. GEPIA: a web server for cancer and normal gene expression profiling and interactive analyses. Nucleic Acids Res. 2017;45:W98-W102. [RCA] [PubMed] [DOI] [Full Text] [Full Text (PDF)] [Cited by in Crossref: 5550] [Cited by in RCA: 7090] [Article Influence: 886.3] [Reference Citation Analysis (0)] |
| 18. | Asplund A, Edqvist PH, Schwenk JM, Pontén F. Antibodies for profiling the human proteome-The Human Protein Atlas as a resource for cancer research. Proteomics. 2012;12:2067-2077. [RCA] [PubMed] [DOI] [Full Text] [Cited by in Crossref: 126] [Cited by in RCA: 209] [Article Influence: 16.1] [Reference Citation Analysis (0)] |
| 19. | Dominguez-Brauer C, Thu KL, Mason JM, Blaser H, Bray MR, Mak TW. Targeting Mitosis in Cancer: Emerging Strategies. Mol Cell. 2015;60:524-536. [RCA] [PubMed] [DOI] [Full Text] [Cited by in Crossref: 287] [Cited by in RCA: 356] [Article Influence: 39.6] [Reference Citation Analysis (0)] |
| 20. | Ding K, Li W, Zou Z, Zou X, Wang C. CCNB1 is a prognostic biomarker for ER+ breast cancer. Med Hypotheses. 2014;83:359-364. [RCA] [PubMed] [DOI] [Full Text] [Cited by in Crossref: 69] [Cited by in RCA: 91] [Article Influence: 8.3] [Reference Citation Analysis (0)] |
| 21. | Shi Q, Wang W, Jia Z, Chen P, Ma K, Zhou C. ISL1, a novel regulator of CCNB1, CCNB2 and c-MYC genes, promotes gastric cancer cell proliferation and tumor growth. Oncotarget. 2016;7:36489-36500. [RCA] [PubMed] [DOI] [Full Text] [Full Text (PDF)] [Cited by in Crossref: 40] [Cited by in RCA: 61] [Article Influence: 7.6] [Reference Citation Analysis (0)] |
| 22. | Magnusson K, Gremel G, Rydén L, Pontén V, Uhlén M, Dimberg A, Jirström K, Pontén F. ANLN is a prognostic biomarker independent of Ki-67 and essential for cell cycle progression in primary breast cancer. BMC Cancer. 2016;16:904. [RCA] [PubMed] [DOI] [Full Text] [Full Text (PDF)] [Cited by in Crossref: 47] [Cited by in RCA: 74] [Article Influence: 8.2] [Reference Citation Analysis (0)] |
| 23. | Wang Z, Katsaros D, Shen Y, Fu Y, Canuto EM, Benedetto C, Lu L, Chu WM, Risch HA, Yu H. Biological and Clinical Significance of MAD2L1 and BUB1, Genes Frequently Appearing in Expression Signatures for Breast Cancer Prognosis. PLoS One. 2015;10:e0136246. [RCA] [PubMed] [DOI] [Full Text] [Full Text (PDF)] [Cited by in Crossref: 51] [Cited by in RCA: 71] [Article Influence: 7.1] [Reference Citation Analysis (0)] |
| 24. | Jeong SB, Im JH, Yoon JH, Bui QT, Lim SC, Song JM, Shim Y, Yun J, Hong J, Kang KW. Essential Role of Polo-like Kinase 1 (Plk1) Oncogene in Tumor Growth and Metastasis of Tamoxifen-Resistant Breast Cancer. Mol Cancer Ther. 2018;17:825-837. [RCA] [PubMed] [DOI] [Full Text] [Cited by in Crossref: 46] [Cited by in RCA: 49] [Article Influence: 7.0] [Reference Citation Analysis (0)] |
| 25. | Chen YZ, Xue JY, Chen CM, Yang BL, Xu QH, Wu F, Liu F, Ye X, Meng X, Liu GY, Shen ZZ, Shao ZM, Wu J. PPAR signaling pathway may be an important predictor of breast cancer response to neoadjuvant chemotherapy. Cancer Chemother Pharmacol. 2012;70:637-644. [RCA] [PubMed] [DOI] [Full Text] [Cited by in Crossref: 39] [Cited by in RCA: 54] [Article Influence: 4.2] [Reference Citation Analysis (0)] |
| 26. | Zou YF, Xie CW, Yang SX, Xiong JP. AMPK activators suppress breast cancer cell growth by inhibiting DVL3-facilitated Wnt/β-catenin signaling pathway activity. Mol Med Rep. 2017;15:899-907. [RCA] [PubMed] [DOI] [Full Text] [Cited by in Crossref: 28] [Cited by in RCA: 39] [Article Influence: 4.3] [Reference Citation Analysis (0)] |
| 27. | Wang J, Yang Z, Zhang C, Ouyang J, Zhang G, Wu C. A four-gene signature in the tumor microenvironment that significantly associates with the prognosis of patients with breast cancer. Gene. 2020;761:145049. [RCA] [PubMed] [DOI] [Full Text] [Cited by in Crossref: 6] [Cited by in RCA: 11] [Article Influence: 2.2] [Reference Citation Analysis (0)] |
| 28. | Tang H, Huang X, Wang J, Yang L, Kong Y, Gao G, Zhang L, Chen ZS, Xie X. circKIF4A acts as a prognostic factor and mediator to regulate the progression of triple-negative breast cancer. Mol Cancer. 2019;18:23. [RCA] [PubMed] [DOI] [Full Text] [Full Text (PDF)] [Cited by in Crossref: 107] [Cited by in RCA: 159] [Article Influence: 26.5] [Reference Citation Analysis (0)] |
| 29. | Milan E, Lazzari C, Anand S, Floriani I, Torri V, Sorlini C, Gregorc V, Bachi A. SAA1 is over-expressed in plasma of non small cell lung cancer patients with poor outcome after treatment with epidermal growth factor receptor tyrosine-kinase inhibitors. J Proteomics. 2012;76 Spec No.:91-101. [RCA] [PubMed] [DOI] [Full Text] [Cited by in Crossref: 47] [Cited by in RCA: 61] [Article Influence: 4.7] [Reference Citation Analysis (0)] |
| 30. | Zhang W, Kong HF, Gao XD, Dong Z, Lu Y, Huang JG, Li H, Yang YP. Immune infiltration-associated serum amyloid A1 predicts favorable prognosis for hepatocellular carcinoma. World J Gastroenterol. 2020;26:5287-5301. [RCA] [PubMed] [DOI] [Full Text] [Full Text (PDF)] [Cited by in CrossRef: 10] [Cited by in RCA: 10] [Article Influence: 2.0] [Reference Citation Analysis (0)] |
| 31. | Liu J, Sun J, Zhang Q, Zeng Z. shRNA knockdown of DNA helicase ERCC6L expression inhibits human breast cancer growth. Mol Med Rep. 2018;18:3490-3496. [RCA] [PubMed] [DOI] [Full Text] [Cited by in Crossref: 2] [Cited by in RCA: 6] [Article Influence: 0.9] [Reference Citation Analysis (0)] |
| 32. | Zhang G, Yu Z, Fu S, Lv C, Dong Q, Fu C, Kong C, Zeng Y. ERCC6L that is up-regulated in high grade of renal cell carcinoma enhances cell viability in vitro and promotes tumor growth in vivo potentially through modulating MAPK signalling pathway. Cancer Gene Ther. 2019;26:323-333. [RCA] [PubMed] [DOI] [Full Text] [Cited by in Crossref: 10] [Cited by in RCA: 17] [Article Influence: 2.4] [Reference Citation Analysis (0)] |


