Published online Jan 24, 2021. doi: 10.5306/wjco.v12.i1.13
Peer-review started: July 29, 2020
First decision: October 18, 2020
Revised: November 5, 2020
Accepted: November 28, 2020
Article in press: November 28, 2020
Published online: January 24, 2021
Processing time: 171 Days and 16.9 Hours
Although circulating tumor cells (CTCs) have been the focus of consideration for a decade, a categorized cell-based diagnostic strategy is unavailable. The personalized management and complementary/analytical-strategy of data require an alphabetic guide. Therefore, we aimed to determine the behavior of CTCs in tumor and blood in order to provide the hypothetical-based agenda in the brain neoplasms. Exploring the protein expression (PE) using a single cell-based method would clarify the heterogeneity and diversity in tumor and blood, which are key events in the evolution in brain tumors. In fact, heterogeneity, diversity, and evolution are required for cancer initiation and progression.
To explore CTCs in brain tumors and blood cells and to assay intensity of PE through personalized insight.
The focal population included 14 patients with meningioma, and four patients with metastatic brain tumors (T). PE was assayed by immunofluorescence in tumors cells and CTCs in 18 patients with brain tumors. Ratio test was applied between the T cells and CTCs in tumor tissue and in vascular system. T/CTC ratio-based classification of PE in macrophage chemoattractant chemokine ligand 2 (CCL2), vascular endothelial growth factor (VEGF), epidermal growth factor (EGF), CD133, cyclin E, neurofilament marker, cytokeratin 19, and leukocyte common antigen (CD45) were investigated.
Total analyzed cells ranged between 10794-92283 for tumor cells and between 117-2870 for CTCs. Characteristics of histopathologic and status of an ataxia-telangiectasia mutated polymorphism (D1853N) in 18 patients affected with brain tumors were also provided. The course of evolution and metastatic event relied on the elevated protein expression in CTCs, which could be considered as a prognostic value. Diverse protein expression of the migrated cells into the blood stream and the tumor was indicative of the occurrence of evolution. Besides, the harmonic co-expression between CCL2/EGF and CCL2/VEGF could facilitate the tumor progression including the metastatic event. Expression of these proteins in the migrated vasculature and into the buccal tissue offered a non-invasive follow-up detection in neoplastic disorders. PE-exploration of neurofilament marker/CD133/VEGF of the CTCs in meningioma and cytokeratin 19/CD45/ cyclin E in the patients with metastatic brain tumor would clarify the tumor biology of the brain neoplastic disorders.
The alphabetical base of the evolutionary mechanisms relies on dual-, triple-, and multi-models with diverse intensity of expression. In fact, cross-talk between initiative and the complementary channels defines the evolutionary insight in cancer. A diverse-model of protein expression, including low, medium, and high intensity, is the key requirement for the completed model. The cluster of cells with diverse expression and remarkable co-expression between CCL2/EGF/VEGF and NM/CD133/VEGF in CTCs may be indicative of probable invasiveness of the tumor. Furthermore, the mode of cytokeratin-19+/CD45- can be traced in the metastatic patients.
Core Tip: The present data revealed that a classified/functional/individualized cell-based preventive and therapeutic strategy is required for the cancer management. An interaction between chemoattractant chemokine ligand 2/epidermal growth factor/vascular endothelial growth factor is an influential and key utility in the approach of cancer cells. Tracing the tumor/circulating tumor cells evolution will facilitate the estimation of functional alterations in blood stream as a model to predict the probable initiative step for metastasis, formulating the progressive status of disease and by planning for a translational/personalized management. Finally, heterogeneity and diversity may minimize the severity of disease.
- Citation: Mehdipour P, Javan F, Jouibari MF, Khaleghi M, Mehrazin M. Evolutionary model of brain tumor circulating cells: Cellular galaxy. World J Clin Oncol 2021; 12(1): 13-30
- URL: https://www.wjgnet.com/2218-4333/full/v12/i1/13.htm
- DOI: https://dx.doi.org/10.5306/wjco.v12.i1.13
Based on the World Health Organization system, meningiomas are classified as the second most common-primary brain tumor (T) of the central nervous system in adults. Brain invasion has been included in the diagnostic criteria as atypical meningioma World Health Organization grade II[1]. The pitfalls in neoplastic diagnosis include late detection and unavailability of the precise formulated, classified data, the somatic/circulating tumor cells (CTCs)-based heterogeneity and evolutionary process. Three elements, including angiogenesis, edema, and growth, play a key role in the progression of meningioma. The vascular system of meningioma is rather diverse, extending from sporadic vascularization to the vast mode, like angiomatous meningioma[2].
Chemoattractant chemokine ligand 2 (CCL2/C) is involved in the process of cell migration and plays a key role in regulation of the transferring process through blood brain barrier (BBB)[3]. Macrophages are an influential factor in metastatic programming[4]. Besides, monocytes play a vital role in the seeding process through angiogenesis, so there is a cross-road between CCL2, macrophage, monocytes, and vascular endothelial growth factor (VEGF/V)[5]. However, such configuration is required for a successful event in the developmental seeding process of metastasis. Furthermore, no characterization of the expression on the “human cerebrovascular chemokine” has been provided[6,7].
VEGF is a key factor for formation, growth, development, and survival of tumor through angiogenesis. VEGF is a remarkable factor associated with the diverse potential of angiogenesis and metastasis in human neoplasms, but the precise functional mode of VEGF is not well known in meningioma. However, a remarkable vascularization related to the vascular permeability factor in some patients with meningioma has been reported[2]. Angiogenesis is essential for progression and the metastatic process[8]. However, it is required to unmask the diverse spectrum of protein expression (PE) in meningioma. This is a hypothesis on the puzzling quality and quantity of VEGF expression.
Epidermal growth factors (EGFs/E) are mainly involved in differentiation, cell proliferation, tumorigenesis, and apoptosis. An association has been found between high expression of EGF and progression, development, invasiveness, metastasis, and poor prognosis in cancer[9-12]. Furthermore, the intravasation/migration to the blood stream (BS) is required for “seed and soil” theory[13].
Since CTCs were first observed in a patient with metastasis in 1869, this strategy has not been considered a routine diagnostic tool[14]. The biological aspects of CTCs in metastasis have been highlighted previously[15]. It was stated that the invasiveness of CTCs could be related to their characteristics[16]. The CTCs from glioma had no metastatic behavior in the peripheral territory after migration to BS at the microRNA level[17]. Besides, the liquid biopsy for the deoxyribonucleic acid-sequencing-based test was published[18,19]. The CTCs have also been evaluated as a predictor of survival in patients with melanoma[20]. However, metastasis is characterized by the sequential puzzling events with diverse behaviors in different cancers.
The aims of this study were to: (1) Trace the PE diversity in CCL2/VEGF/EGF; and (2) Classify the PE behavior of these proteins at the somatic/CTC level to provide the personalized strategy for the early detection of CTCs. Upon these aims, the preventive/ predictive tasks are provided as a personalized model by exploring eight markers in patients with brain tumors. This strategy offers the initial step of the cell-based/formulated/categorized model for an early diagnosis of probable metastatic process and the follow-up plan through the patients’ life.
Patients and clinical information: The focal population included 10794-92283 cells for tumor cells and between 117-2870 for circulated T cells, which were analyzed in 18 patients, including 14 with meningioma and four patients with metastatic brain tumors [one with lung-, two with breast-origin, and one with cerebellar medulloblastoma (CM)] (Table 1). The samples were referred from the Department of Neurosurgery, Shariati Hospital, Tehran University of Medical Sciences (TUMS), and the consent letter was signed before surgery. Peripheral blood (PB) and tumor samples of patient were investigated at the Department of Medical Genetics, TUMS.
| Patient ID | Age in yr | Histopath/grade | Other complications | D1853N polymorphism status |
| 1 | 46 | Meningiotheliomatous type | - | + |
| 2 | 47 | Meningioma/I | - | - |
| 3 | 34 | Meningothelial type | - | + |
| 4 | 40 | Meningiotheliomatous type | Focal micro-invasion to the underlying brain tissue | + |
| 5 | 37 | Meningioma/angiomatous | - | - |
| 6 | 66 | Meningothelial type | - | - |
| 7 | 56 | Meningothelial type | - | |
| 8 | 50 | Meningiotheliomatous type | - | - |
| 9 | 21 | Meningiotheliomatous type/I | - | - |
| 10 | 69 | Meningiotheliomatous type/I | - | + |
| 11 | 43 | Meningioma/transitional type | - | - |
| 12 | 69 | Meningiotheliomatous type/I | - | - |
| 13 | 49 | Meningioma | Thyroid tumor (at the same age) | + |
| 14 | 36 | Meningioma/atypical | - | - |
| 15 | 50 | Metastatic carcinoma | Primary site: Lung | + |
| 16 | 51 | Metastatic brain | Primary site: Breast | + |
| 17 | 53 | Metastatic brain-breast origin | Primary site: Breast | + |
| 18 | 39 | Cerebellar medulloblastoma/IV | Micro-vascular proliferation | + |
Design of this investigation was based on evolutionary and personalized insights.
The analytical strategy (AS) was designed as a complementary tool for more precise/specific analysis and categorizing the achieved data. Diverse intensity of PE was categorized as C1, C2, and C3 for CCL2; V1, V2, and V3 for VEGF; and E1, E2, and E3 for EGF.
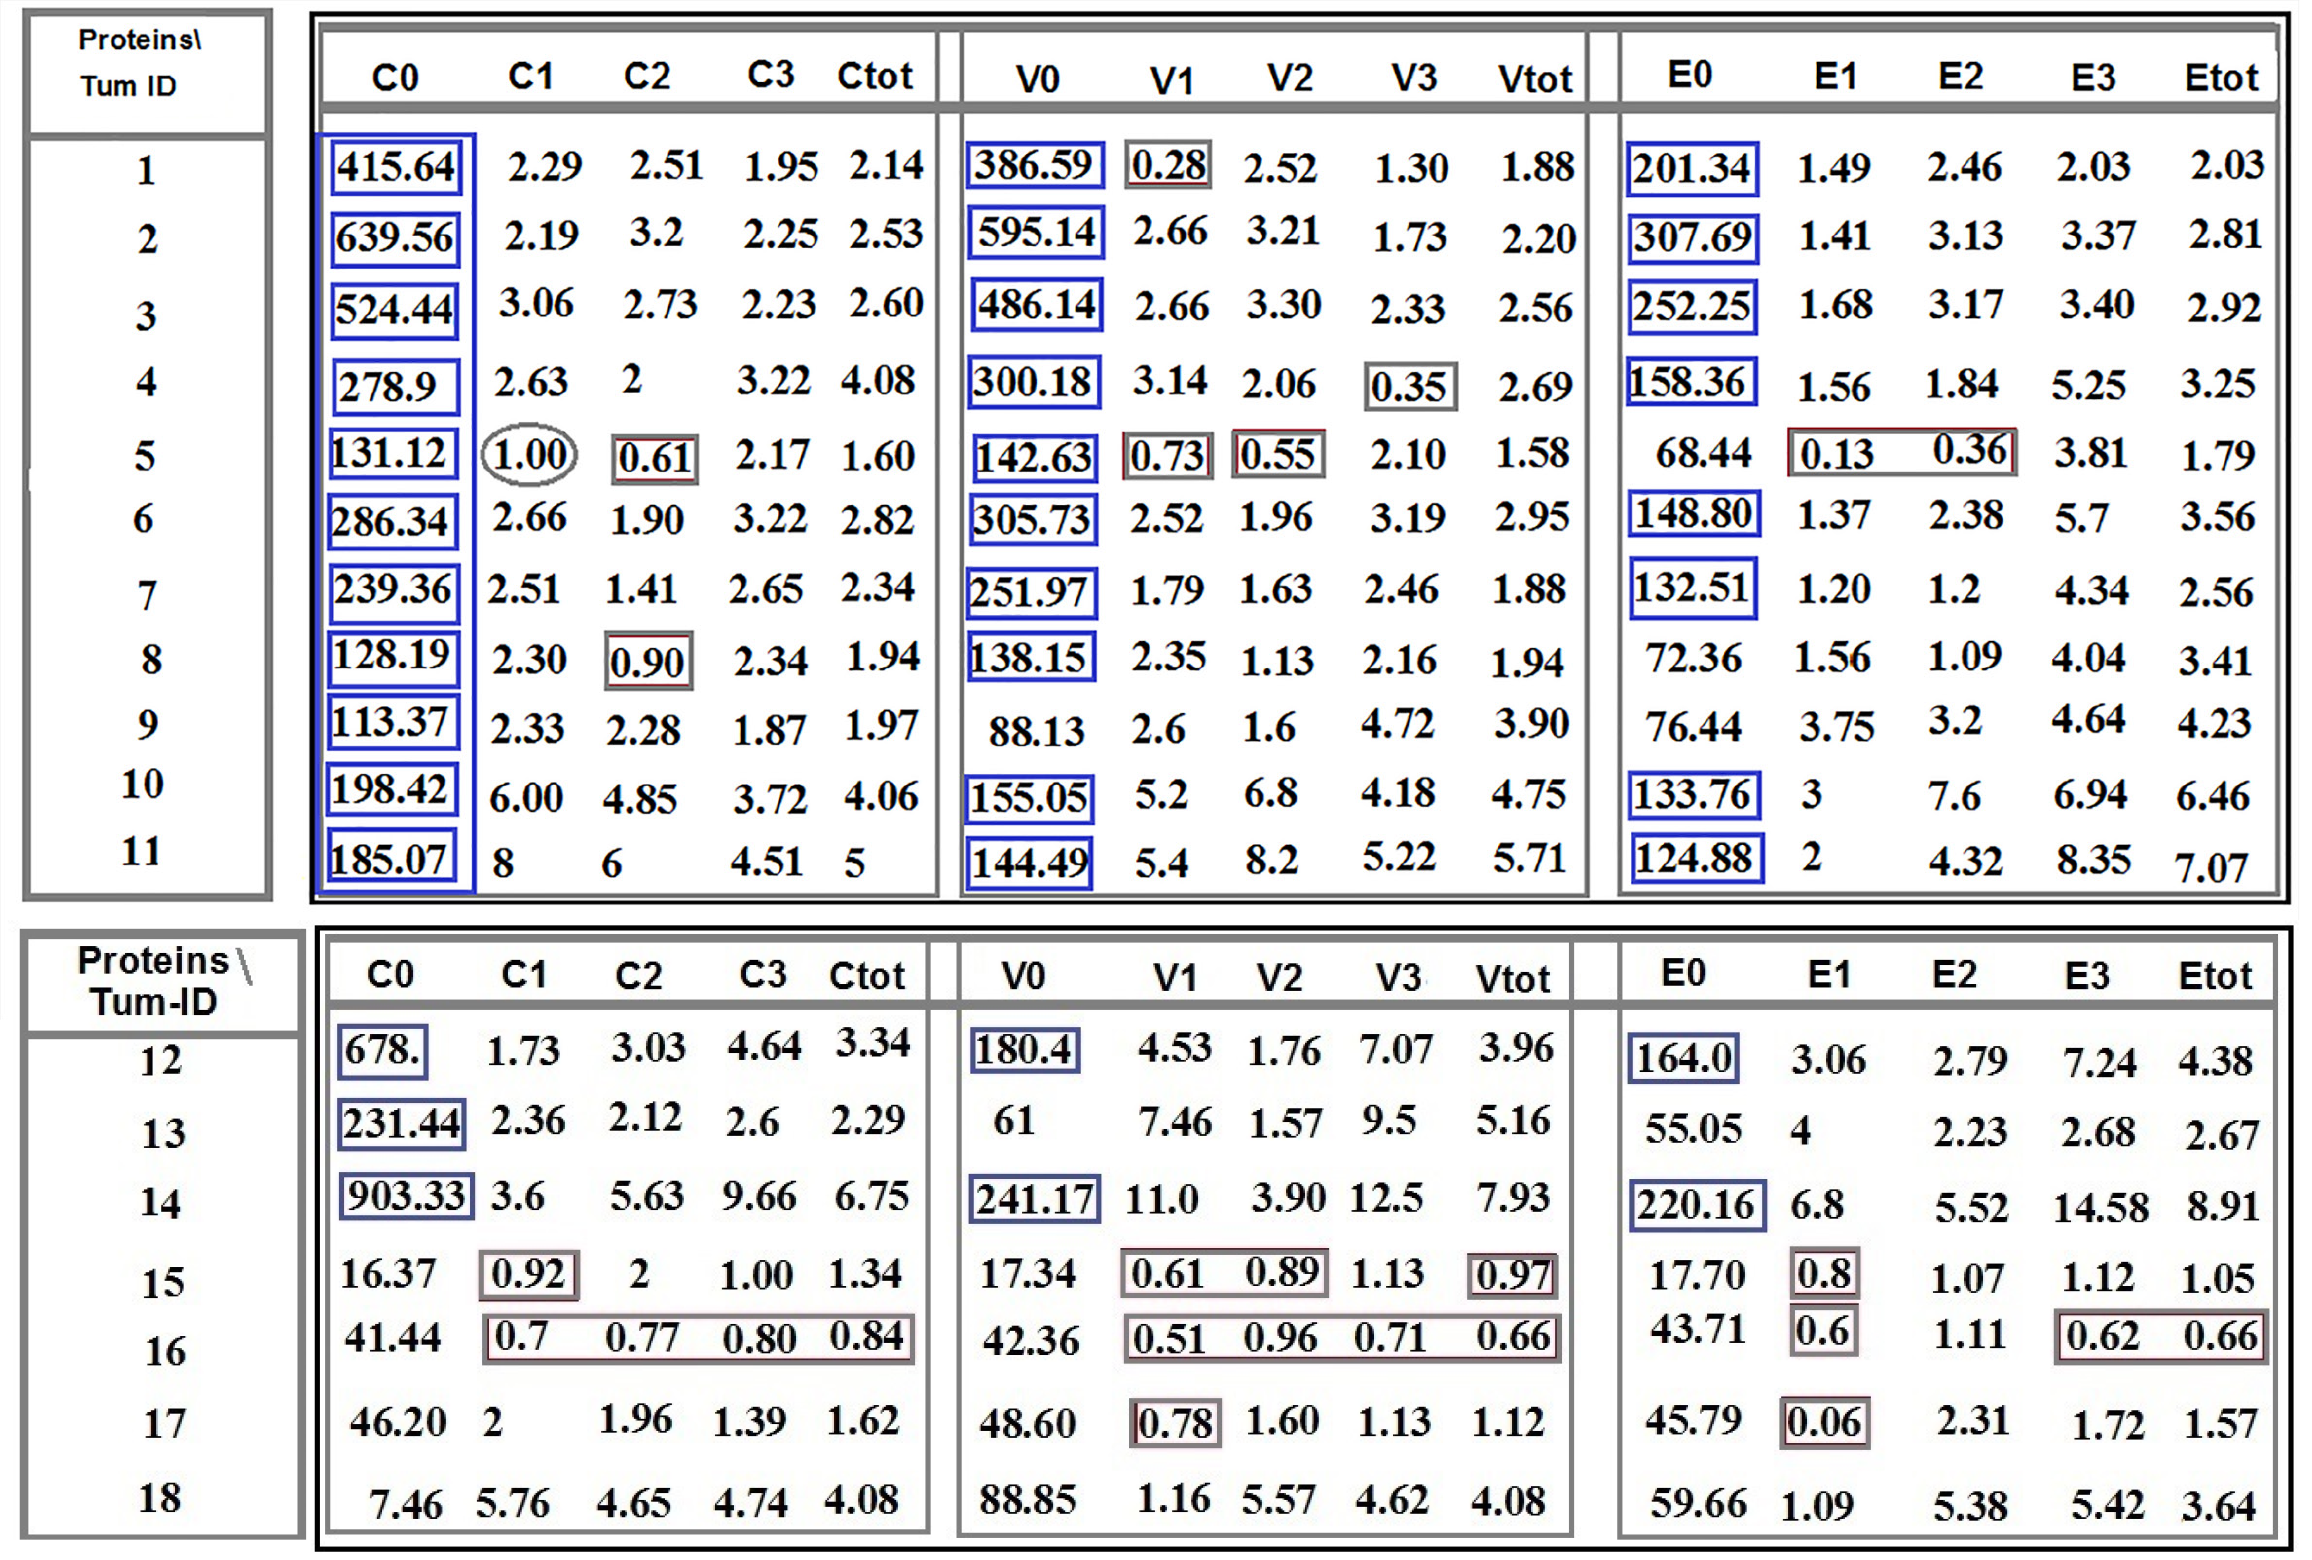
AS is based on the intensity of expression, which varies in different proteins and is provided as C1 (patient 5), V1 (patients 1 and 5), E1 (patient 5); C2 (in patients 5 and 8), V2 (patient 5), E2 (patient 5); and V3 (patient 4). An equal ratio is, exceptionally, observed in patient 5 for C1 category (Figure 1).
The horizontal comparison presents diversity of ratio between the proteins; and the vertical comparison focuses on the intensity spectrum of PE, diversity, and the manner of any cascade alteration(s). Analysis of cells was based on the fluorescence intensity including 0: Lack of expression; 1: Low; 2: Medium; and 3: High expression for CCL2, EGF, and VEGF and the complementary markers (Figure 1).
The traditional direct/manual-based analysis guaranteed the adequate enumeration and detection of cells and heterogeneous pattern of PE, respectively, with more benefits including: (1) Analyzability of the quantitative and qualitative mode of PE; (2) Tracing the vasculature system; (3) Sensitivity of assay; (4) Possibility of multi-assay of the key markers and co-expression; and (5) Analysis of the multi-clonal populations and sub-population. So, this manner led to the quantitative- and qualitative-based classification of tumor cells in both tumor and CTCs. In addition, D1853N polymorphism was tested, which plays a predisposing role for probable occurrence of further exonic and/or intronic alteration(s) through different periods of patients‘ lives[21-23].
The extracted cells from 4 mL heparinized PB were stained with anti-CCL2 (monocyte chemoattractant protein-1) (eBioscience, San Diego, CA, United States), VEGF (Genature, Belgium), and EGF (Novus Biologicals, Littleton, CO, United States). This mixture was incubated at 4 °C. Staining was carried out by second layer antibodies, including fluorescein isothiocyanate for CCL2, R-phycoerythrin for VEGF, and phycoerythrin–indodicarbocyanine (Pe–Cy5) for EGF. Finally, by adding nuclear dye [4′,6-diamidino-2-phenylindole (DAPI)], the status of PE was assayed by the Leica EICA, DM RXA2-fluorescence microscope (Wetzlar, Germany). The CTCs were also assayed with cytokeratin 19 (KRT 19) (ScyTek, Logan, UT, United States), leukocyte common antigen [LCA cocktail (CD45) (BioCare Medical, Pacheco, CA, United States)], neuronal marker (NM) (ScyTek), and DAPI. Identification of brain CTCs was based on positive cells with DAPI/NM, and positive metastatic cells were confirmed through DAPI+/cytokeratin+/CD45-). The Manuel search was also performed to detect CTCs amongst the leukocytes. The CTCs were defined as nucleated cells by: (1) Expressing NM; and (2) Lacking CD45/positive KRT19. CD133 (Biolegend, San Diego, CA, United States), VEGF (Genature), and cyclin E (Zymed, San Francisco, CA, United States) were also assayed.
The present study was approved and granted by the deputy of Research, TUMS (32208-30-04-95). The written consent declaration was obtained from the patients at Department of Neurosurgery, Shariati Hospital, TUMS.
By considering the personalized insight, the ratio test was applied between the CTCs and the T cells in tumor tissue and the vascular system.
The total analyzed cell population was ranged between 10794-92283 for T cells and between 117-2870 for CTCs. Characteristics of histopathologic and status of an ataxia-telangiectasia mutated polymorphism (D1853N) in 18 patients affected with brain tumors are provided (Table 1). The information in the table was provided by the surgeon and the patients.
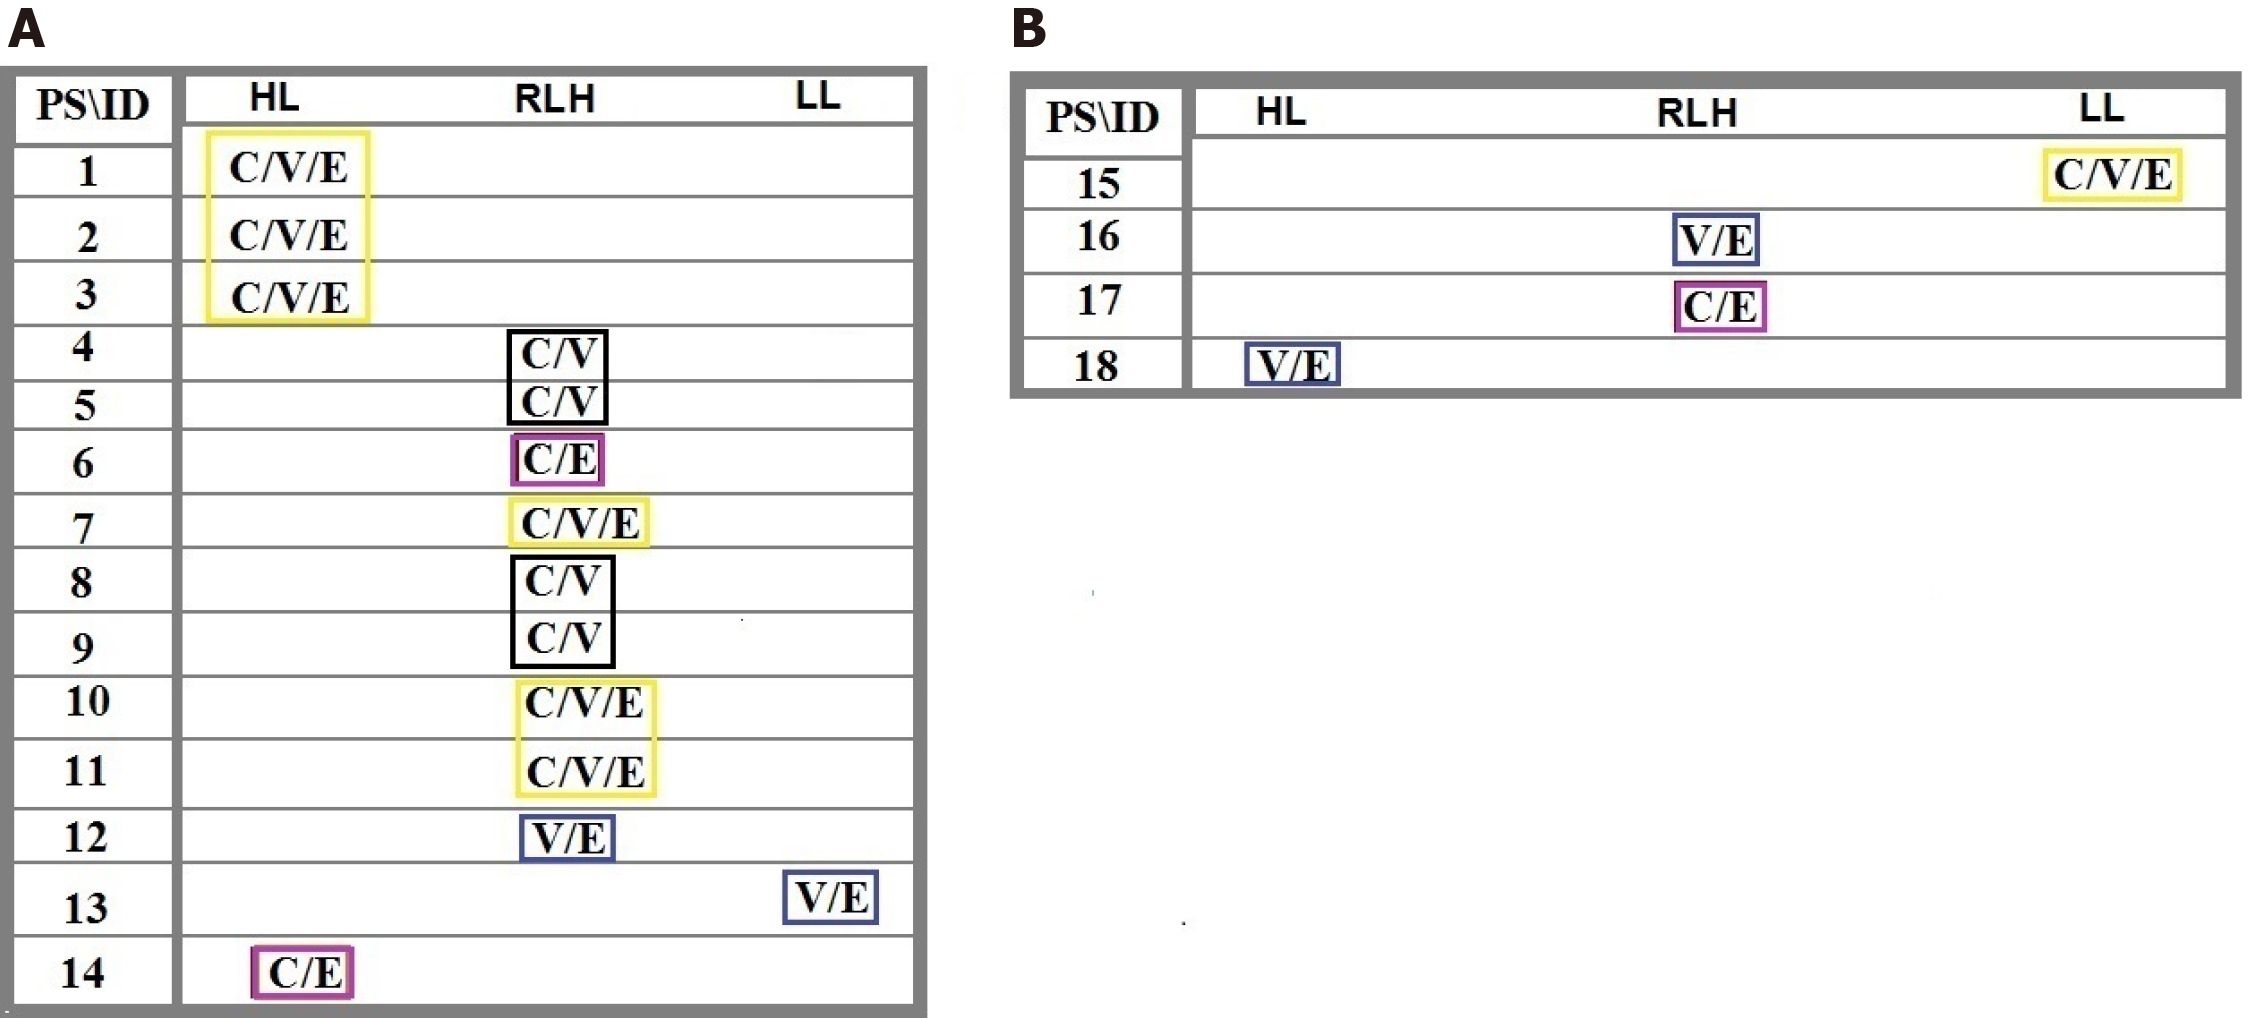
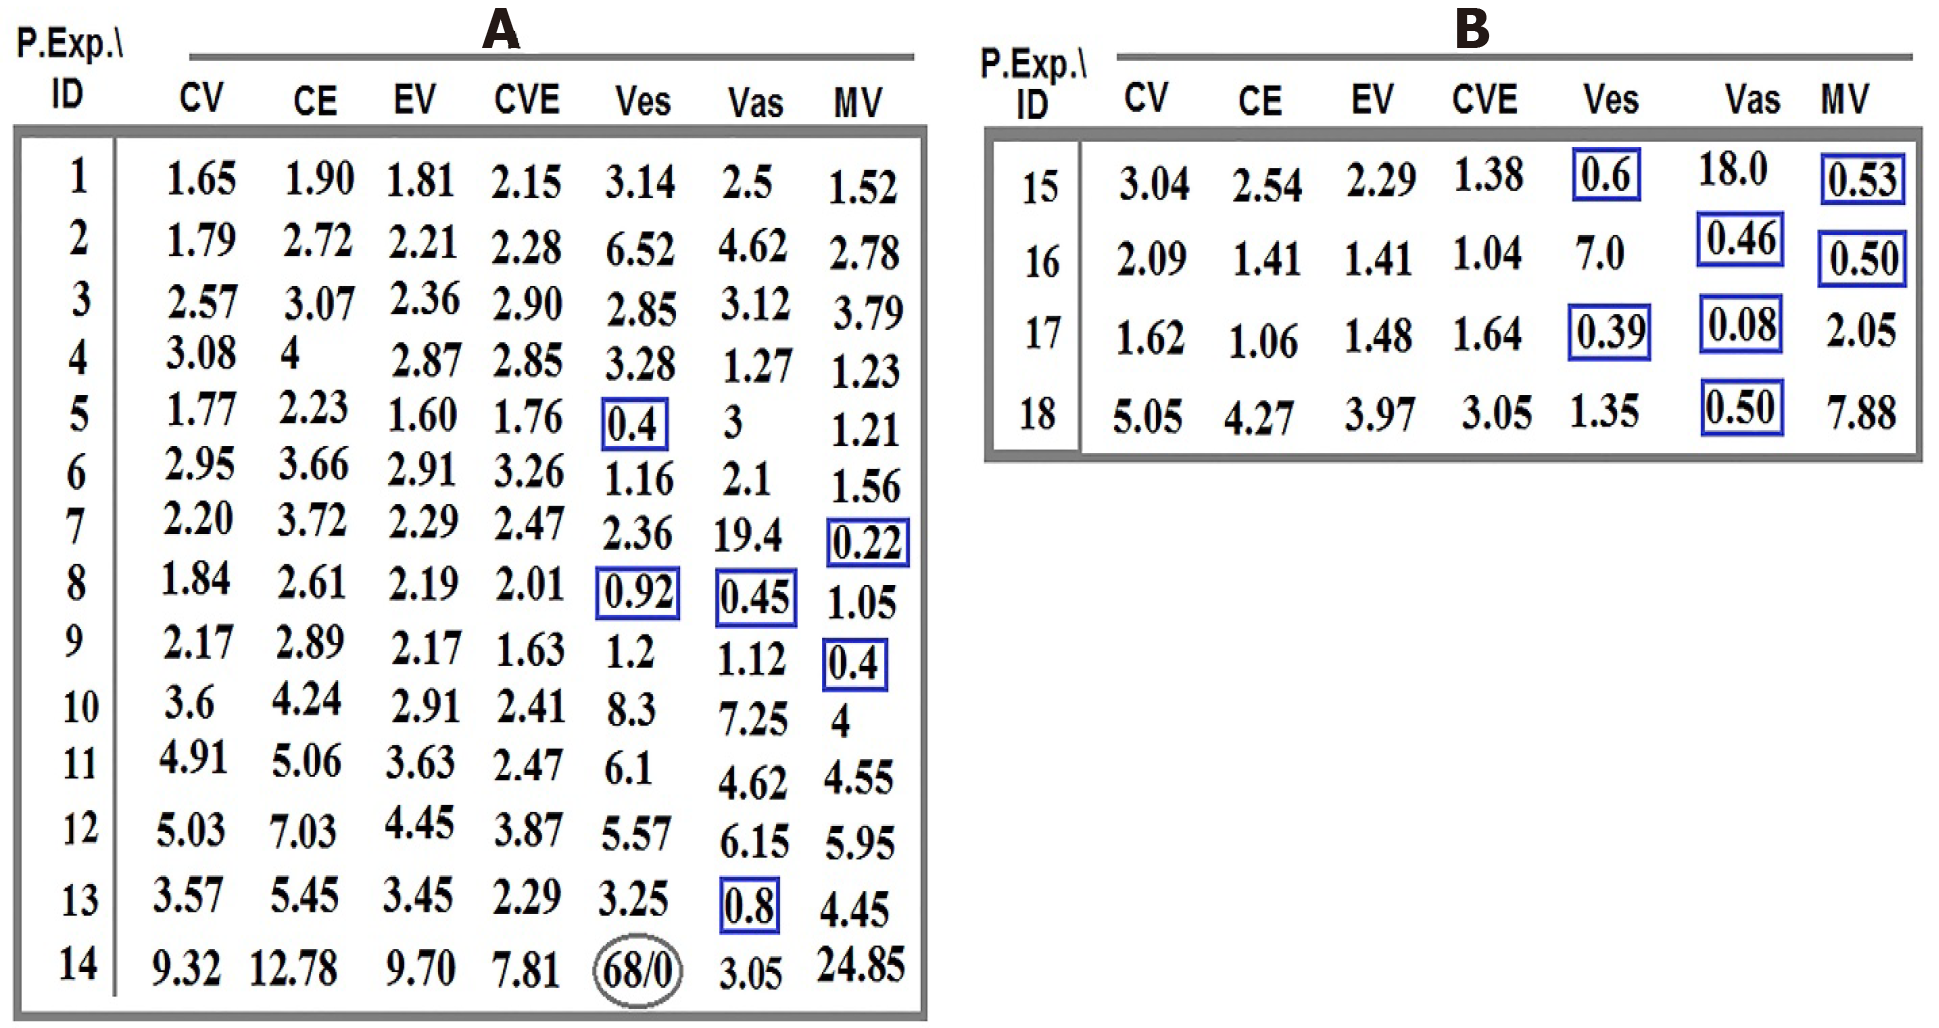
Distribution of the intensity-based T/CTCs-ratio of PE for C, V, and E in the blood territory of patients 1-14 affected with meningioma (Figure 1) and in the patients 15-18 affected with malignant brain tumors, including one lung metastatic carcinoma, two metastatic carcinomas with breast origin, and one with CM are provided (Figure 1). The harmonic ratio of tumor cells lacking PE of C, V, and E to the CTCs in patients with meningioma and brain cancer is illustrated in Figure 2A and B. The ratio of co-expression for tumor cells to the migrated tumor cells in the blood and the vascular system between proteins CCL2, VEGF, and EGF of the patients (Nos. 1-14) affected by meningioma is also provided (Figure 3A). The ratio of co-expression in tumor cells to the migrated tumor cells in the blood and the vascular system between these proteins of patients with brain cancer (patients 15-18) are presented (Figure 3B).
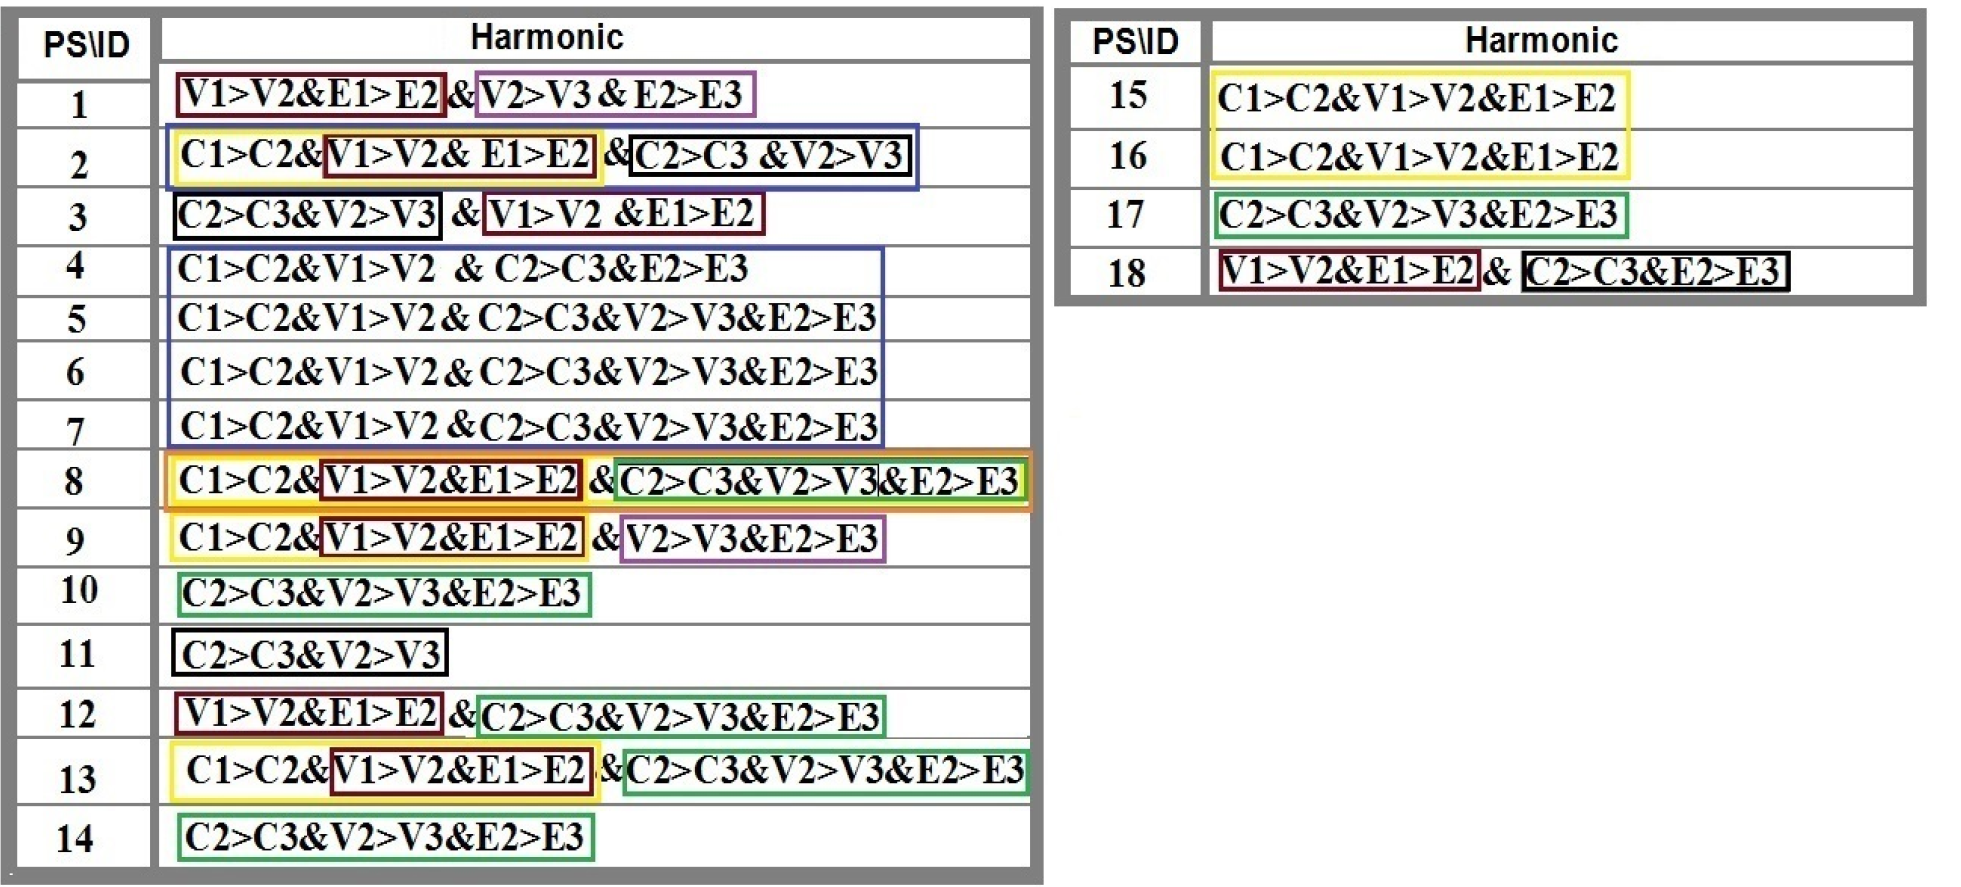
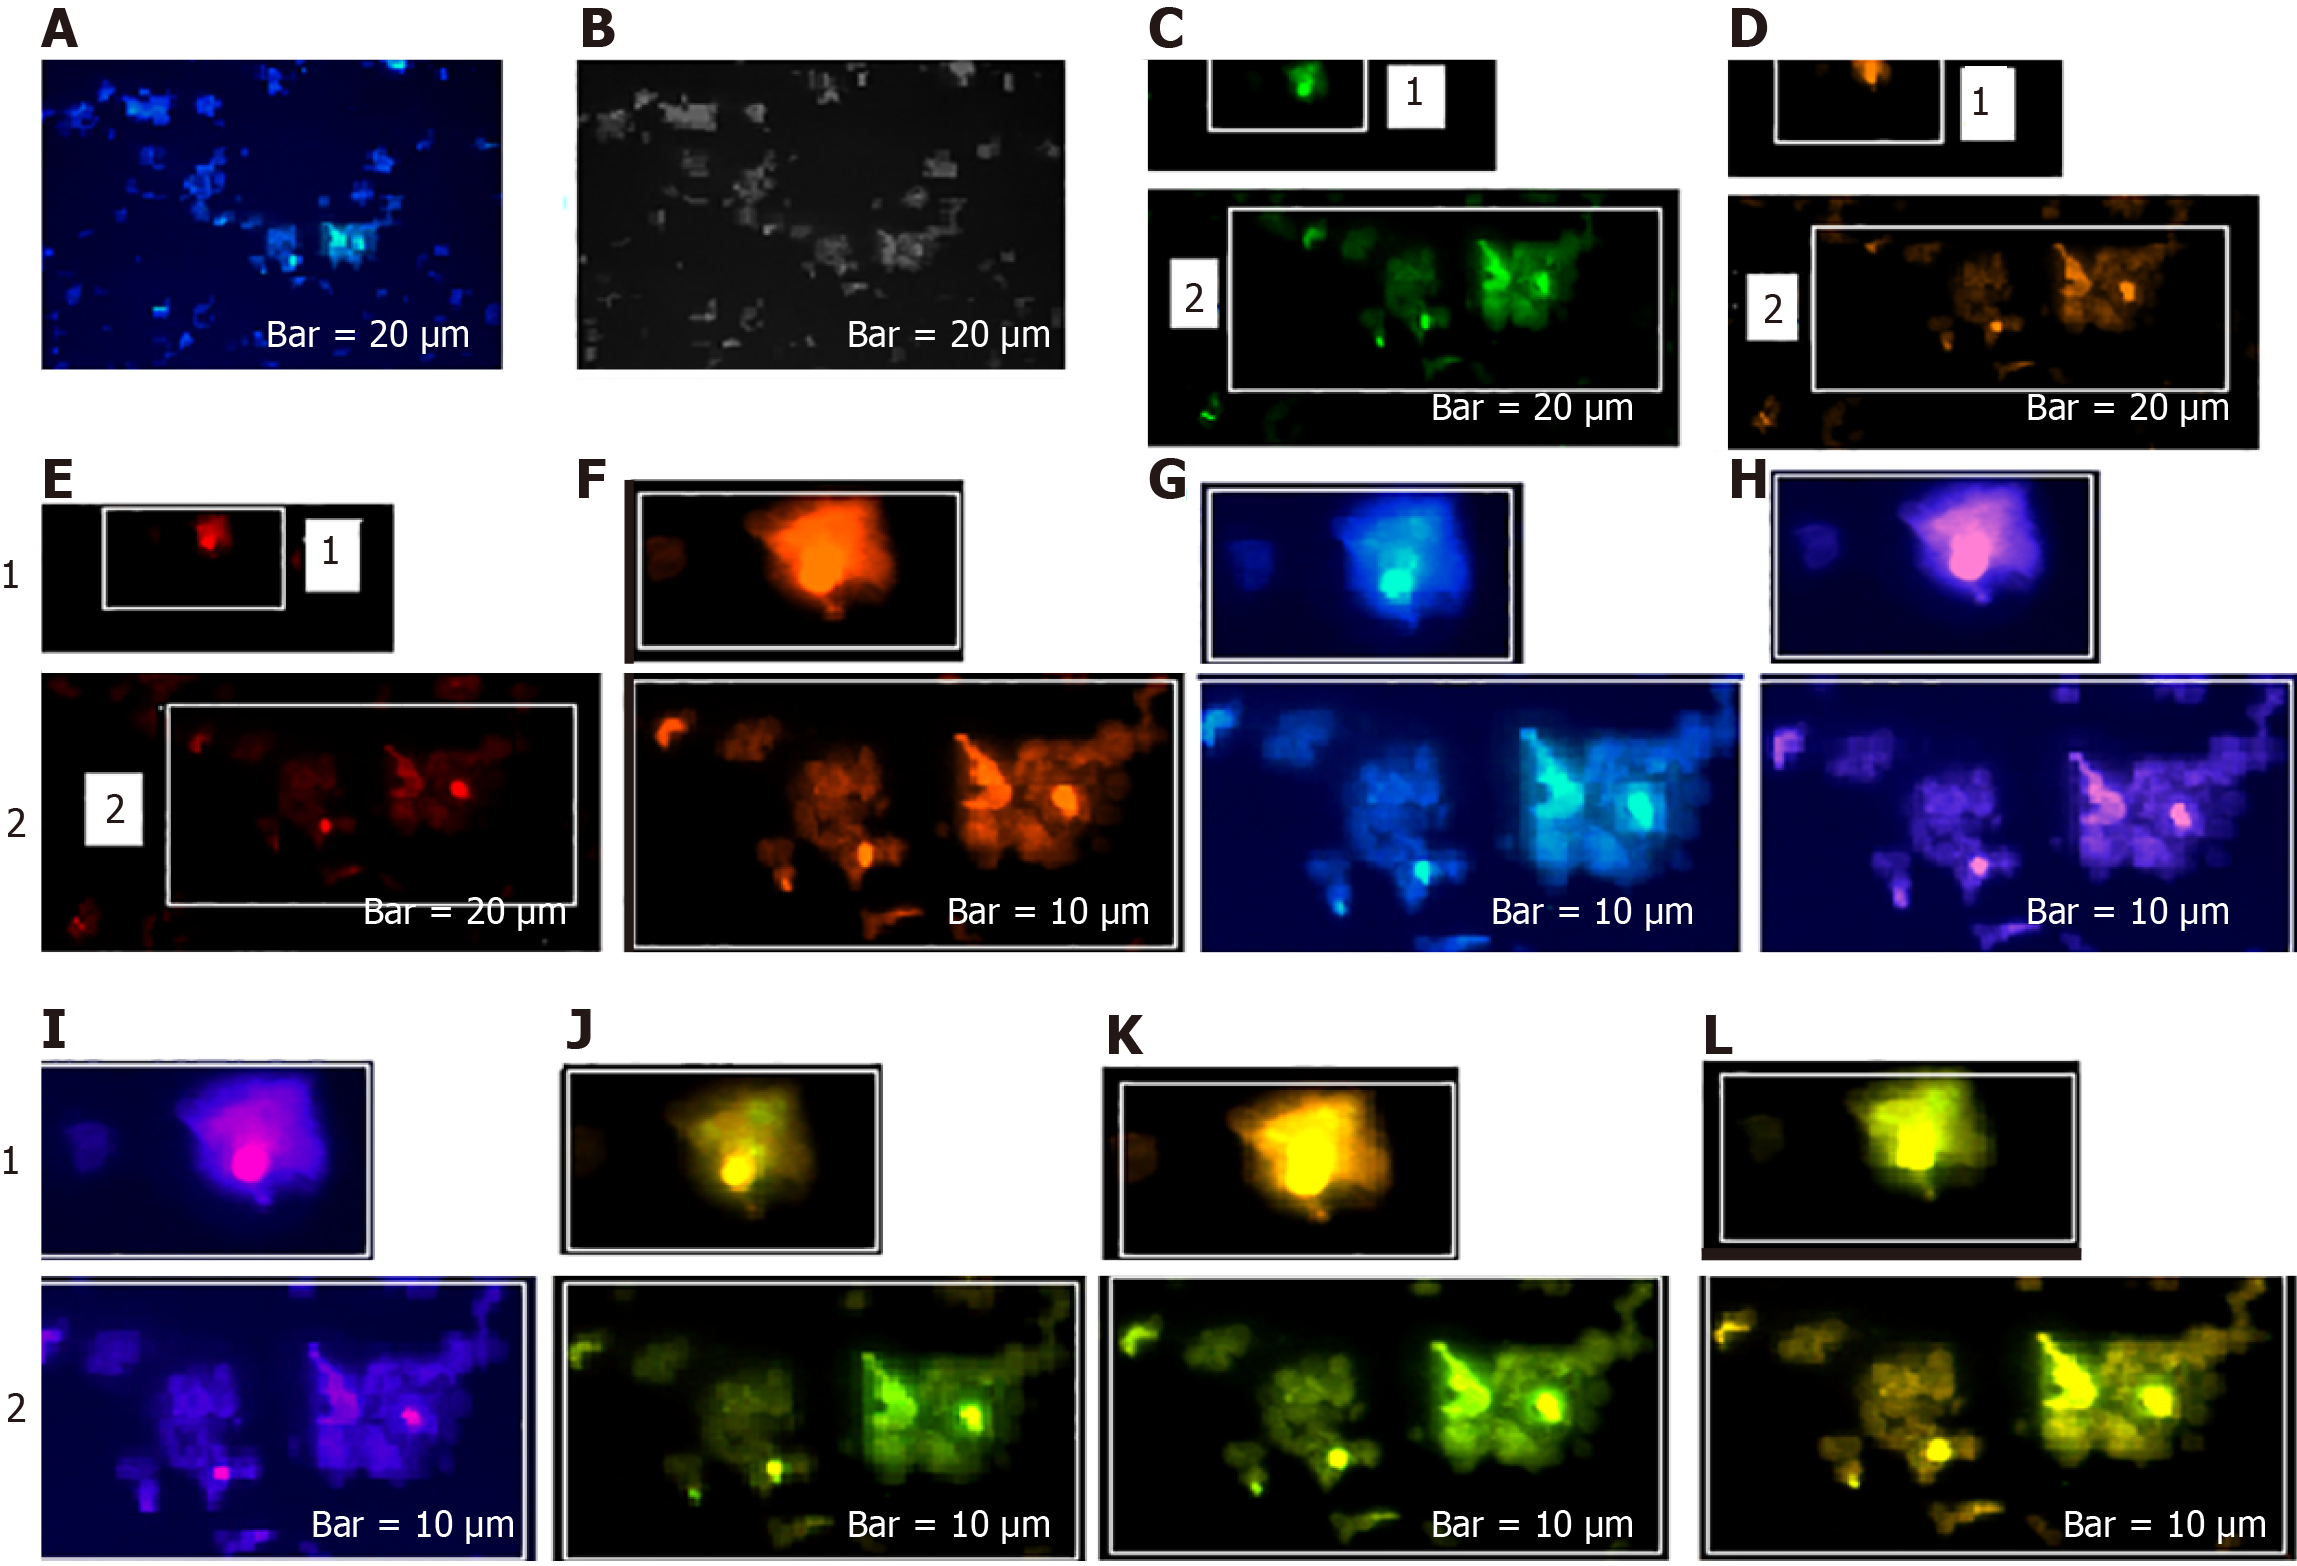
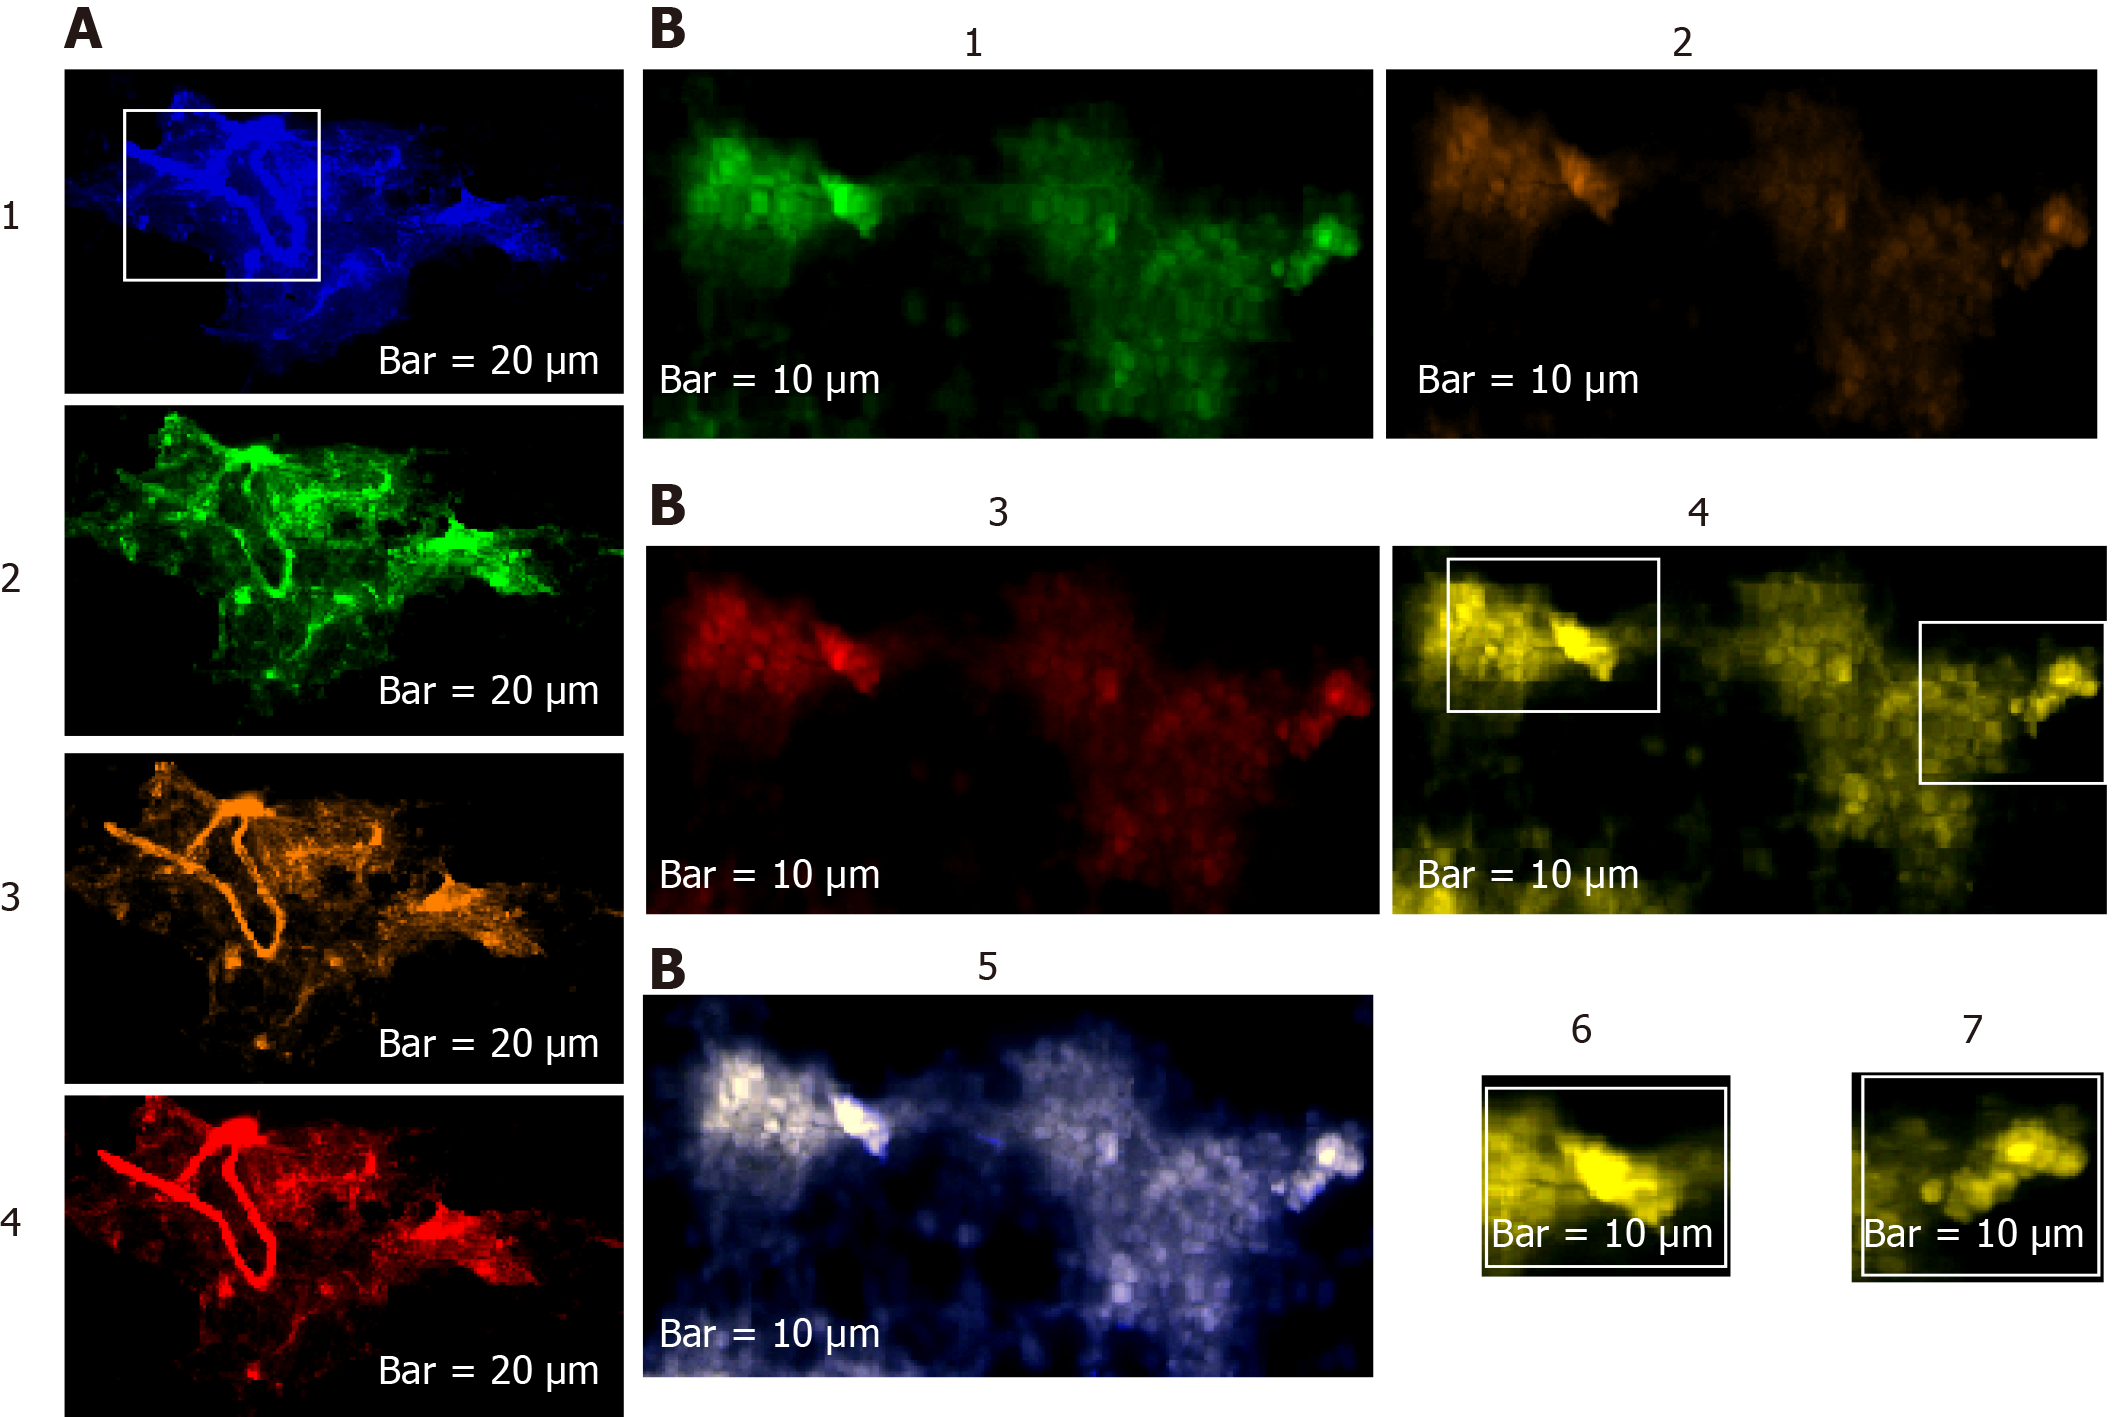
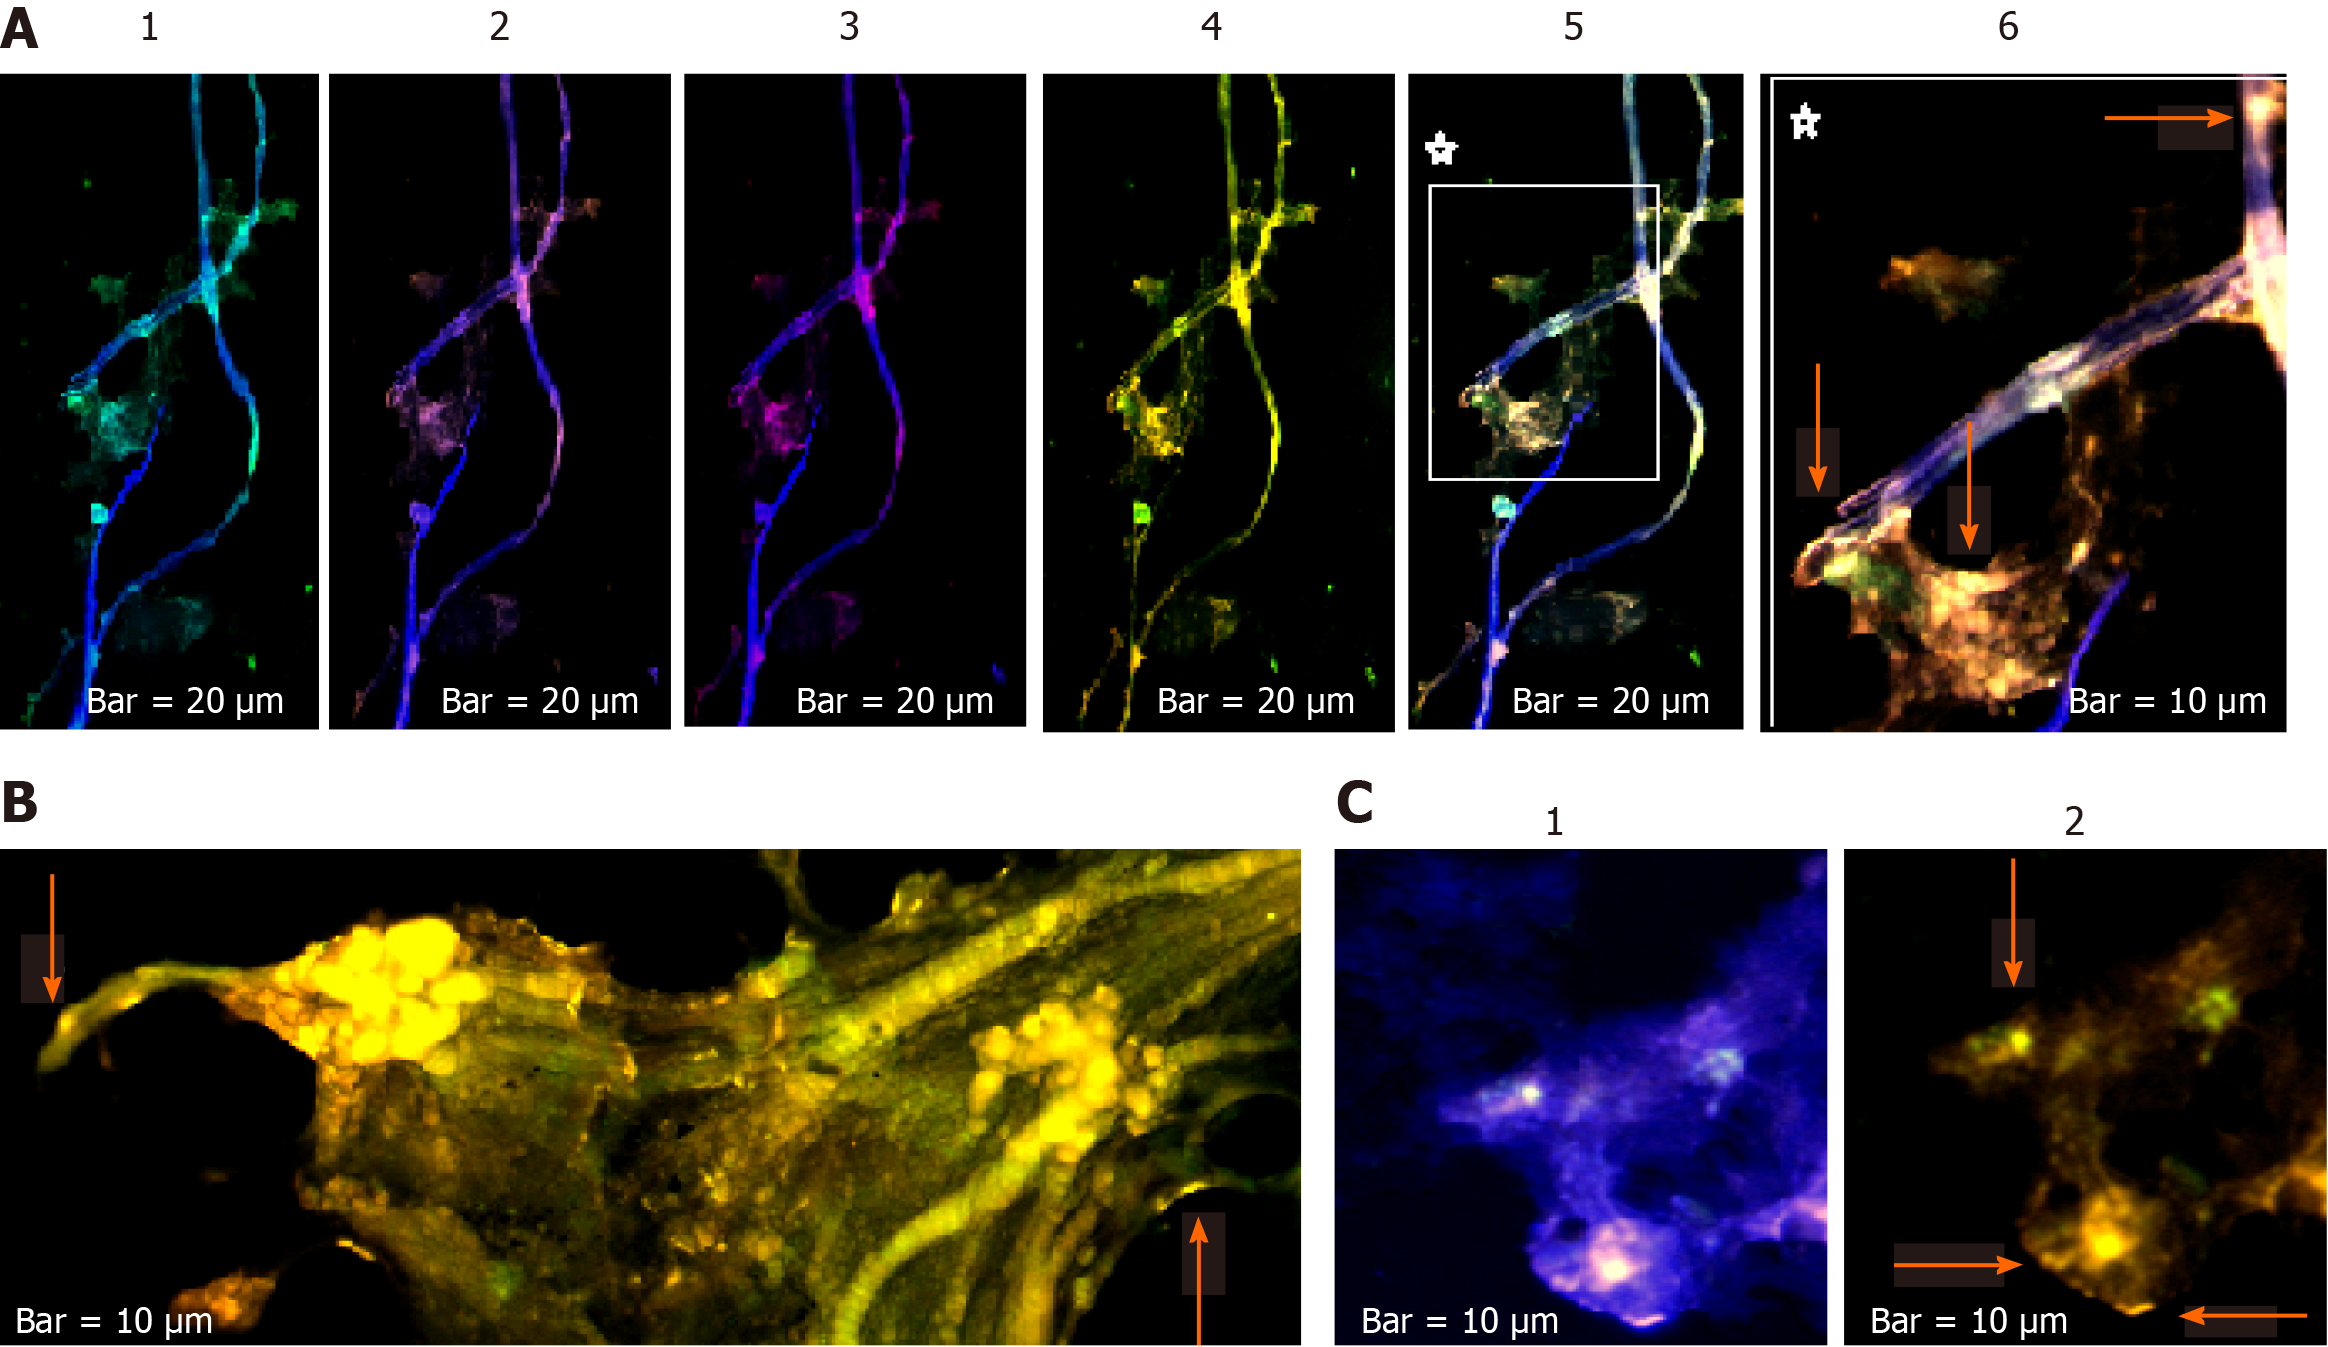
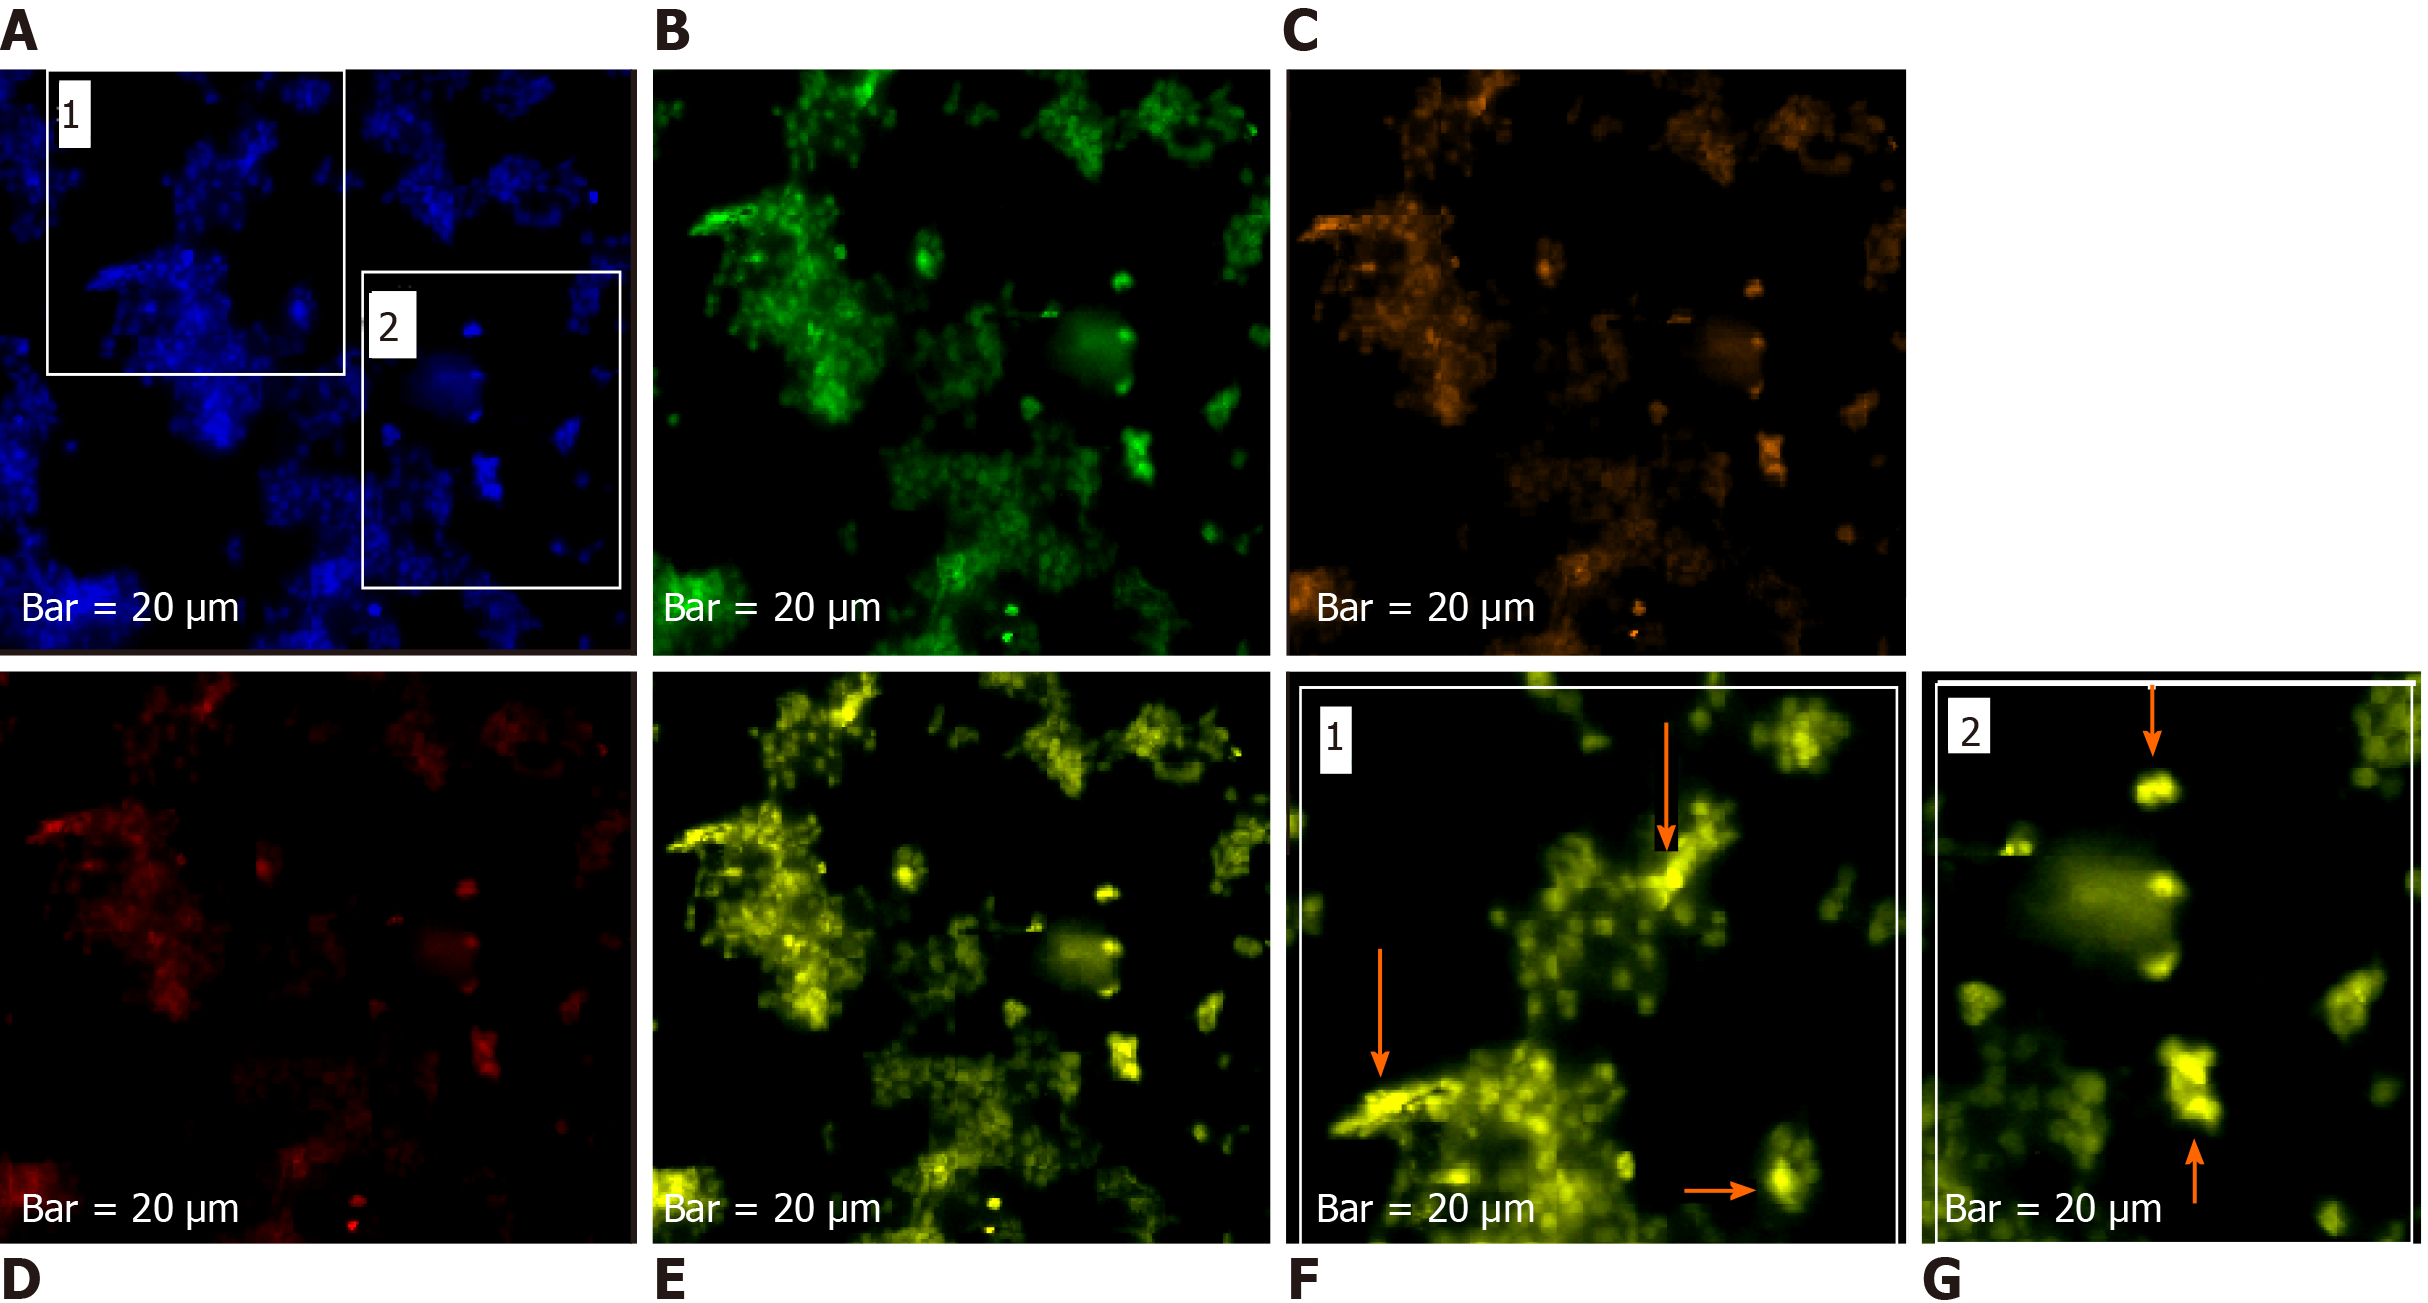
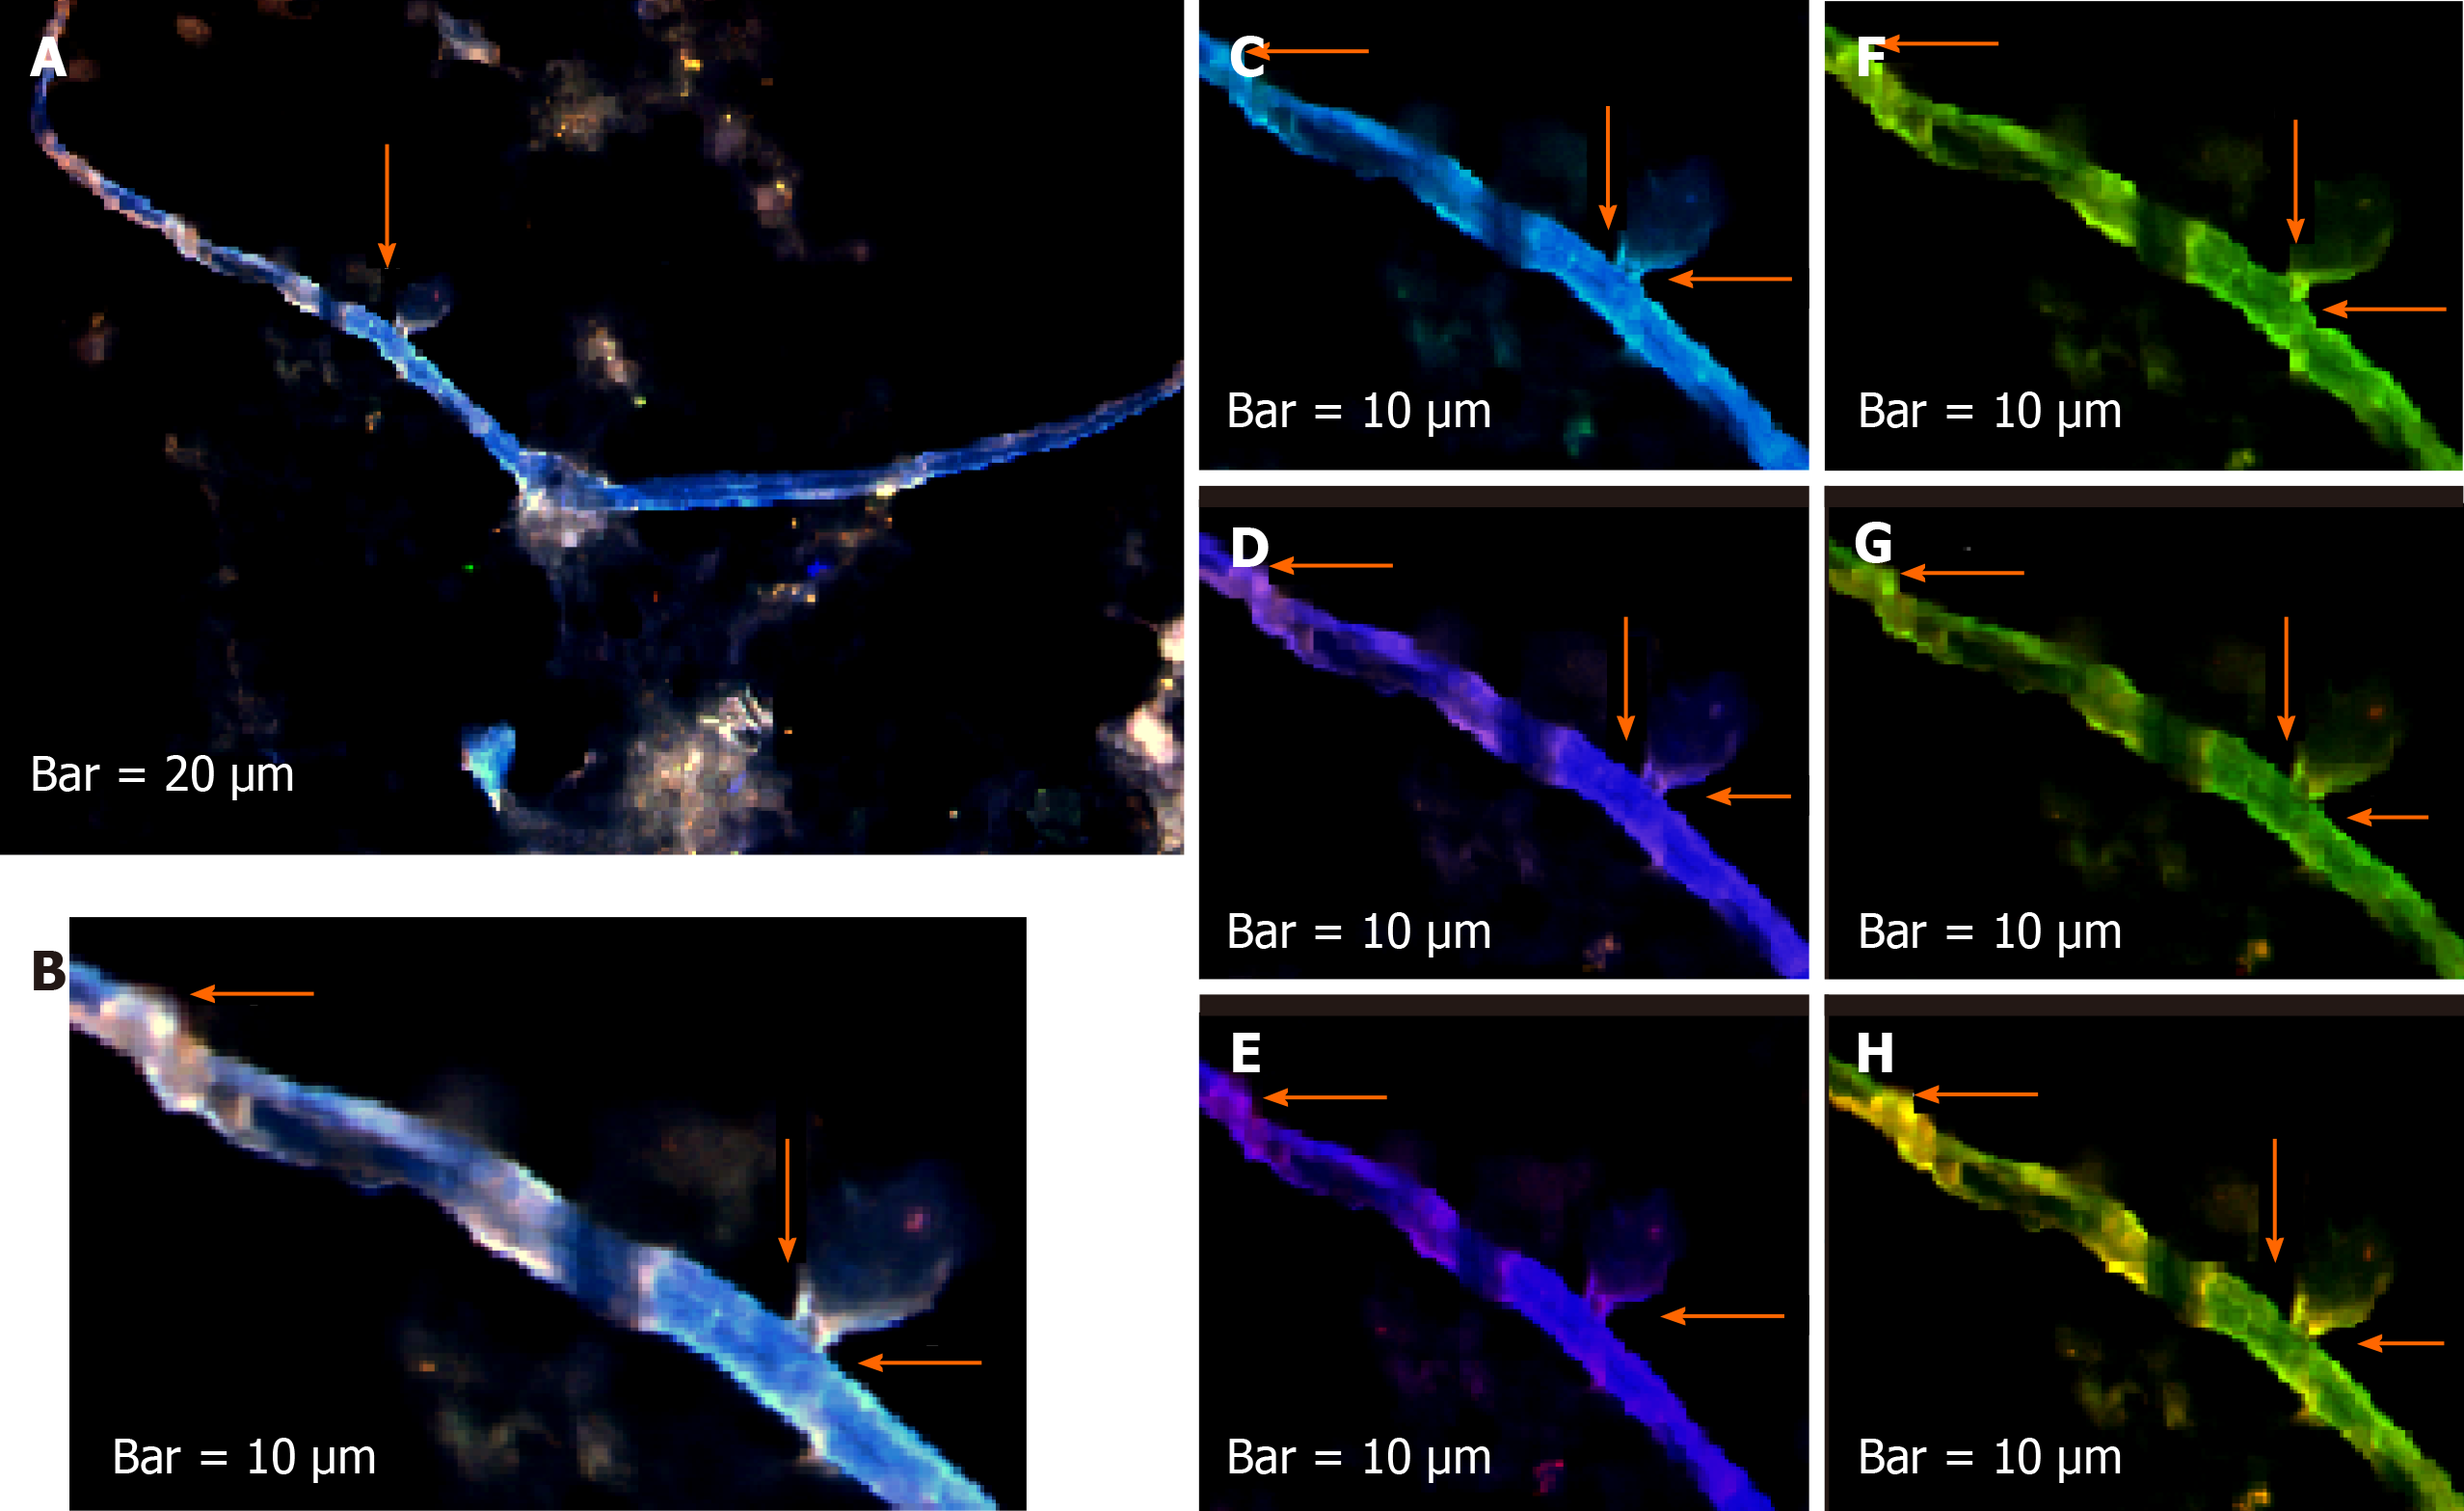
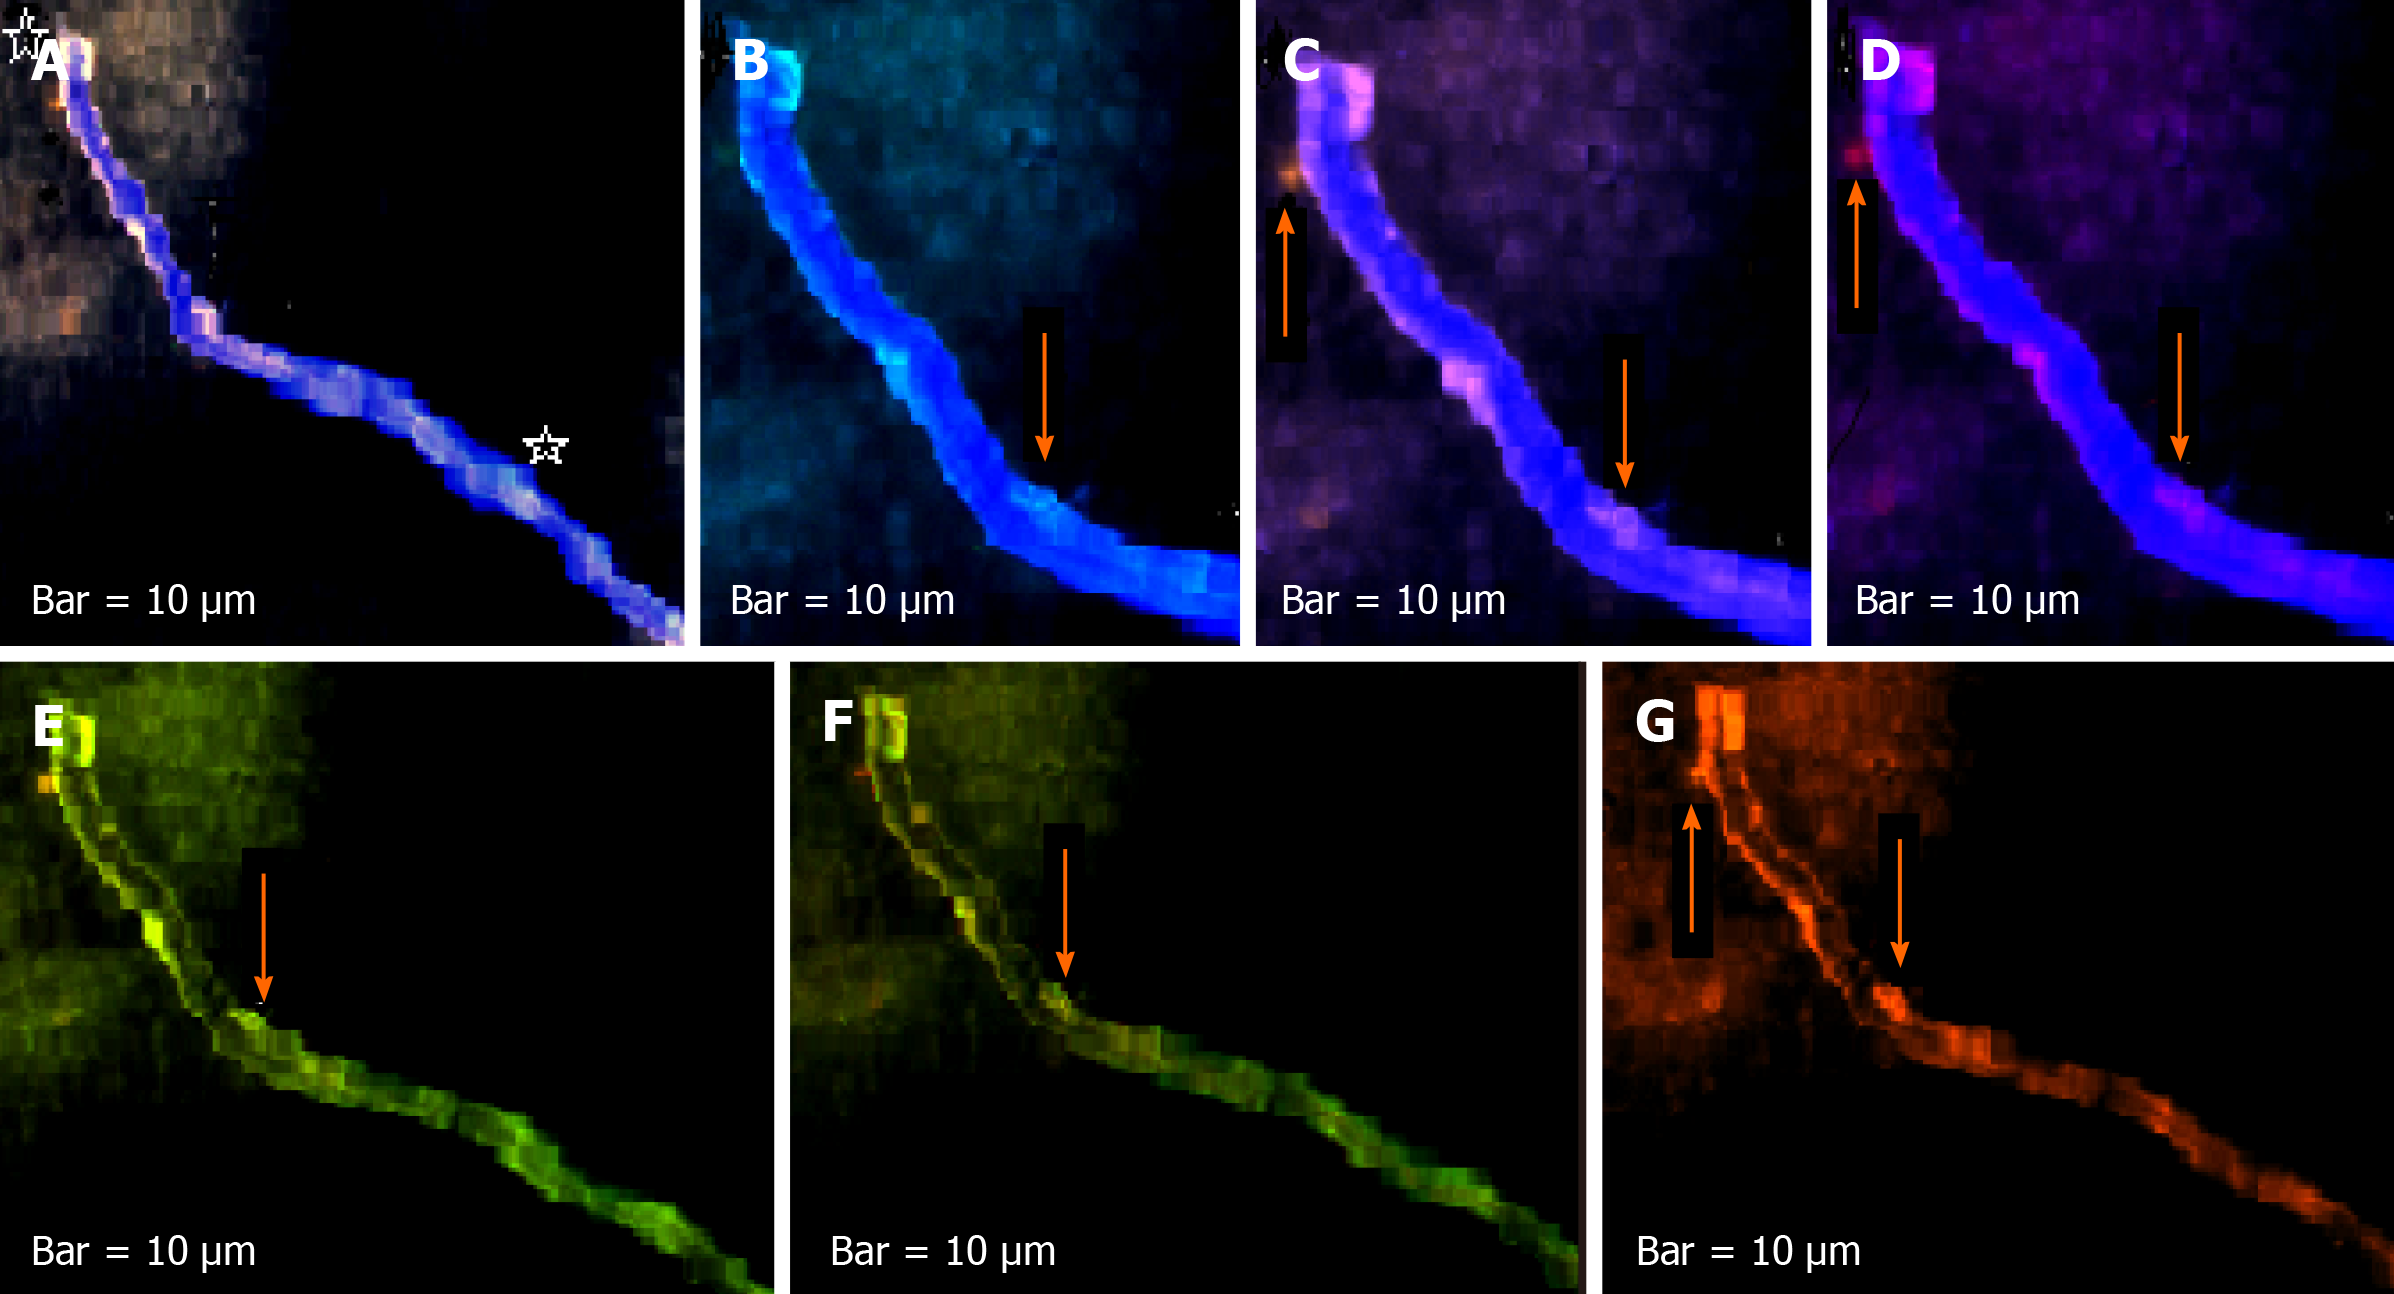
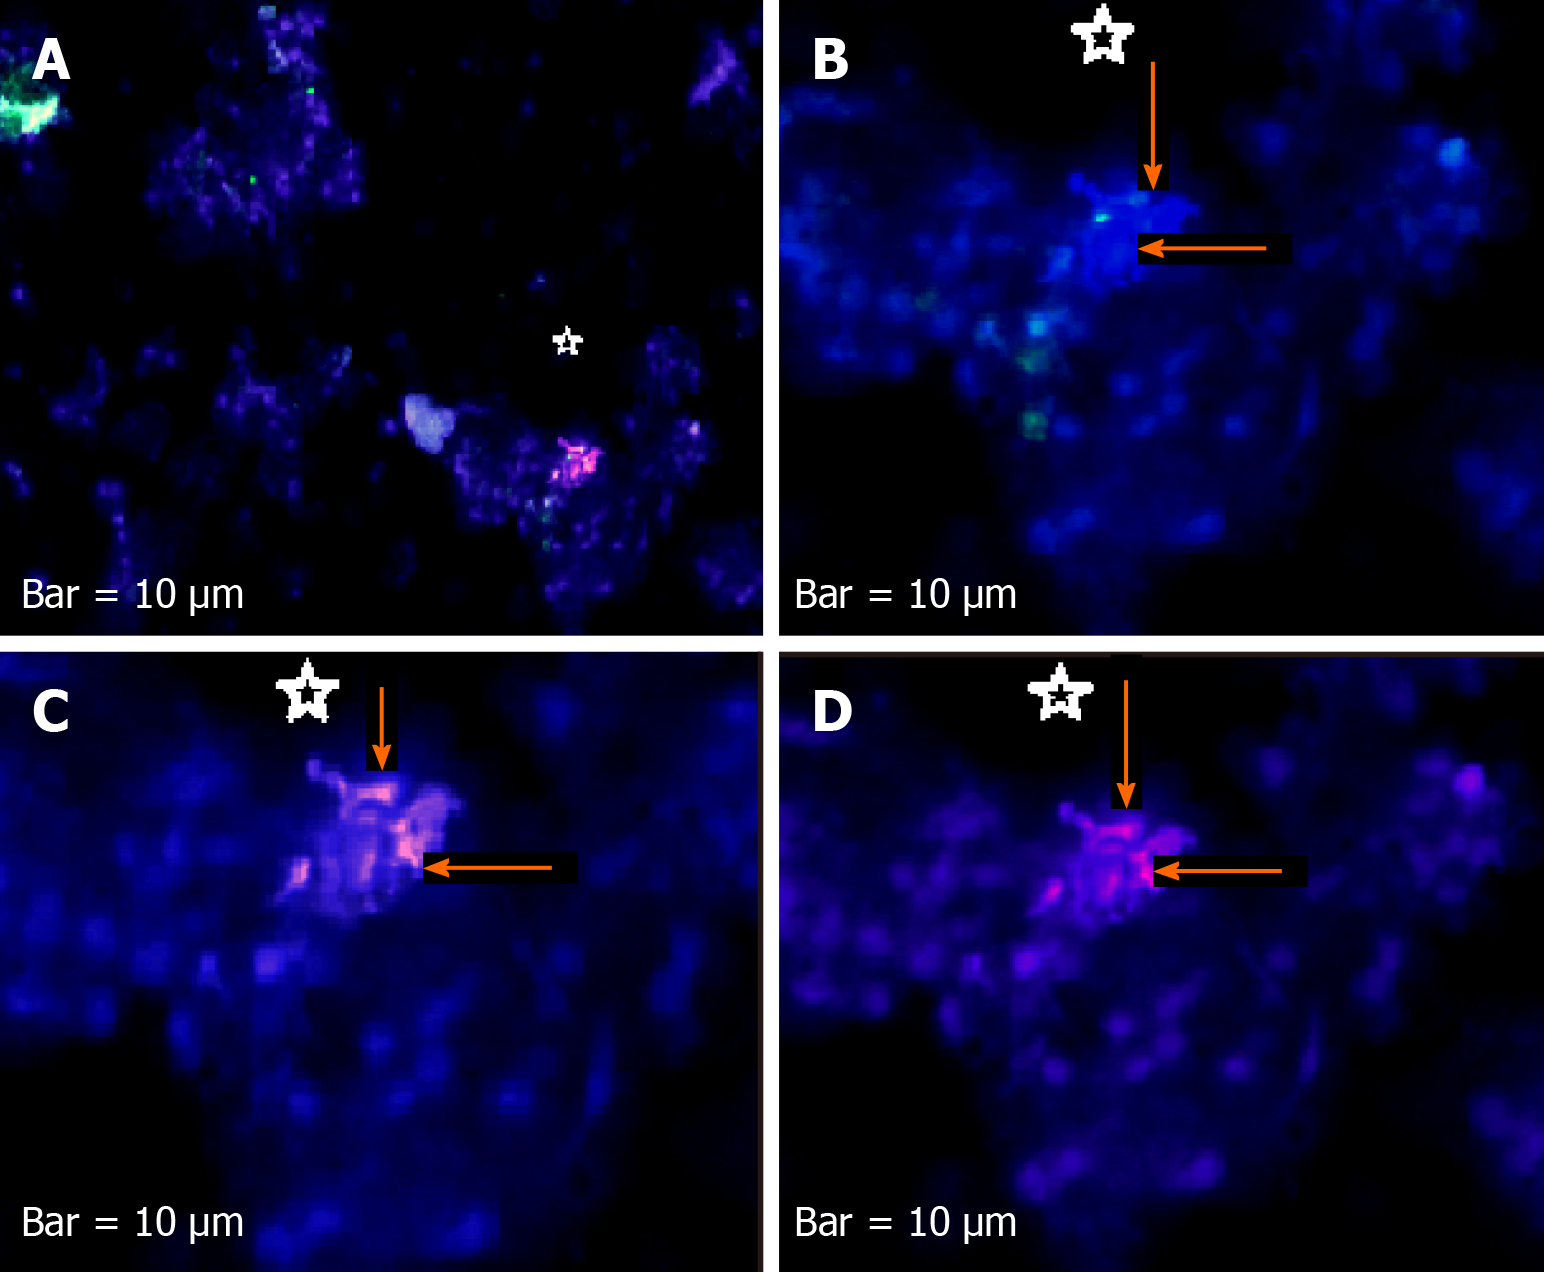
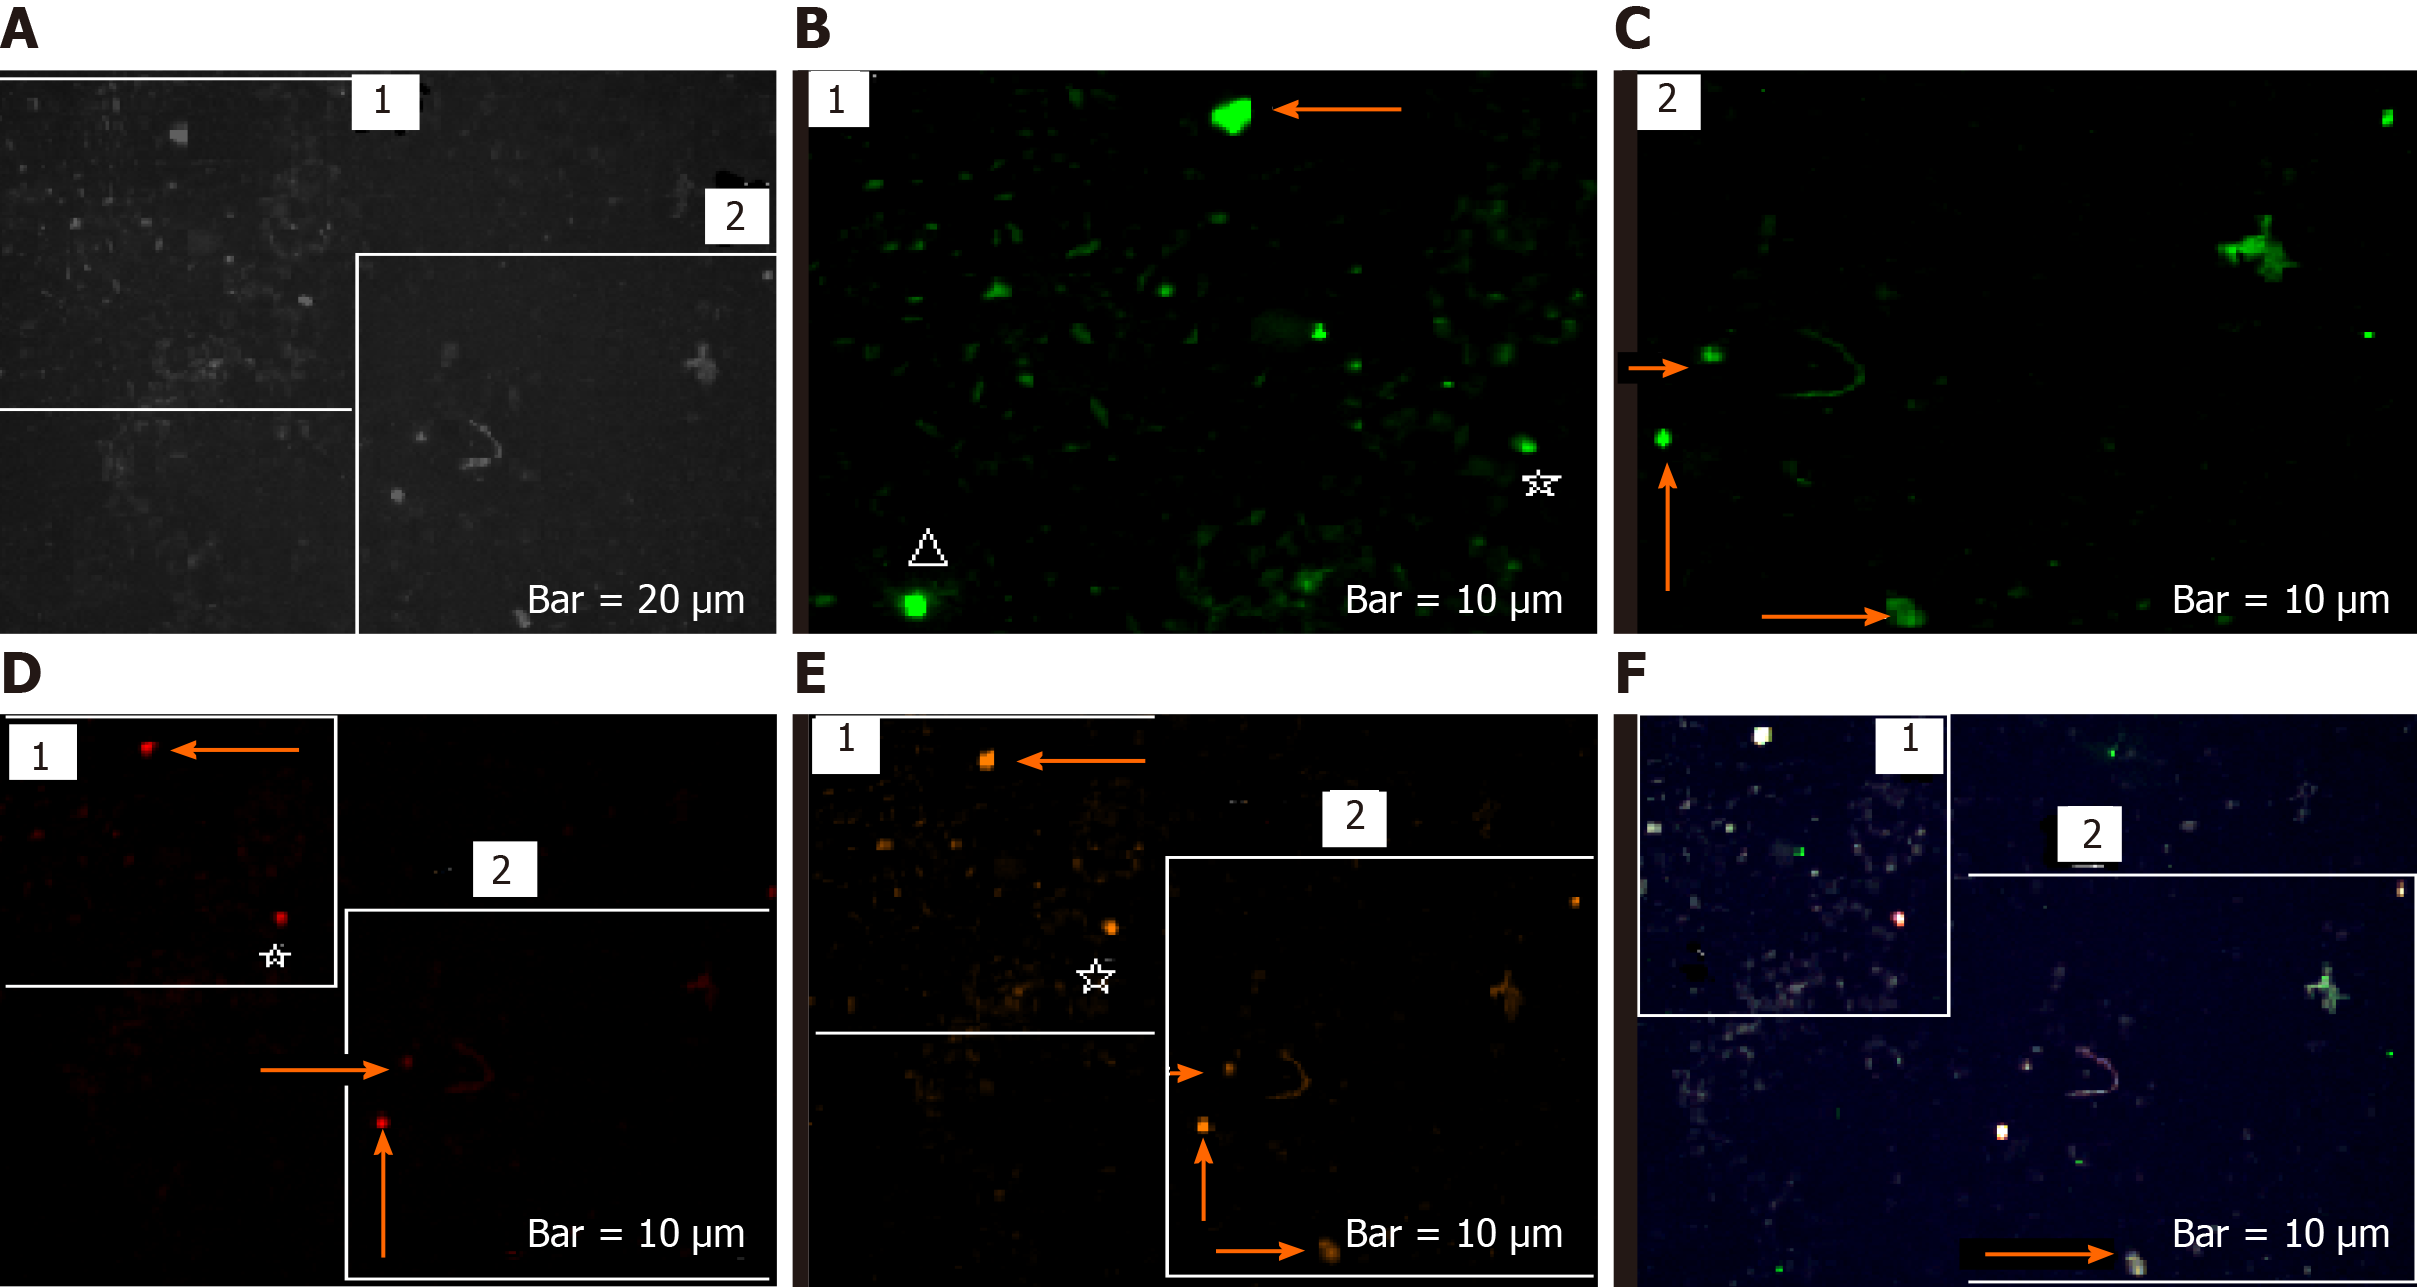
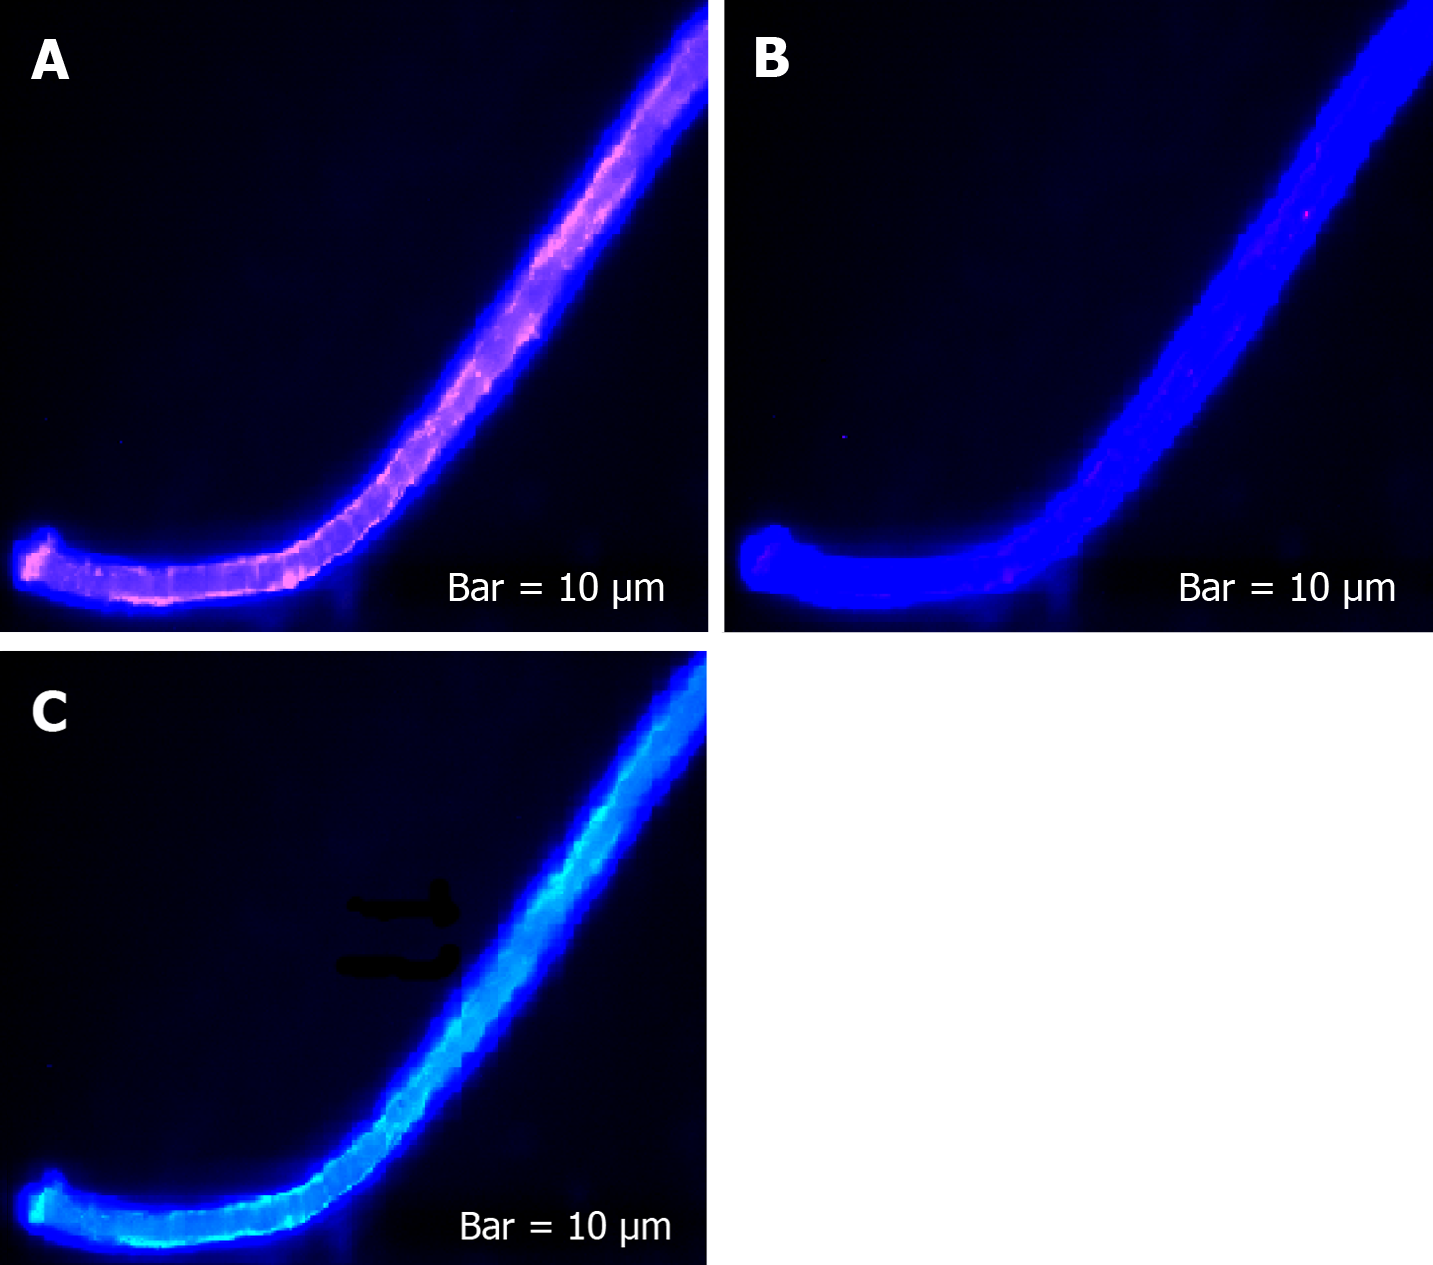
The harmonic manner of elevated or declined ratio for each protein is illustrated in a periodic chart (Figure 4). In this figure, the progressive intensity of proteins C, V, and E is traceable. Status of PE and co-expression of C, V, and E in CTCs of patients 1 and 9 (Figure 5) and in patient 4 (Figure 6) with meningioma are provided. Expression status of these proteins in meningioma tumors, vasculatures, and CTCs in patient 11 (Figure 7) and in patient 13 (Figure 8) are also available. In patient 15 with lung metastatic carcinoma, the status of PE and co-expression of CCL2/VEGF/EGF through migration of tumor cells to the blood territory is shown (Figure 9). The migrated vasculature into the BS, the CTCs in patient 15 (Figure 9A-G and in patient 17, and expression of these three proteins in the migrated vasculature into the BS are presented (Figure 10). The CTCs are shown in patient 18 with CM (Figure 11). Furthermore, the mode of PE of NM/CD133/VEGF in the CTCs of patient 1 with meningioma is presented (Figure 12). The PE of KRT19/CD45/cyclin E in patients 16 and 17 with metastatic brain tumor is provided (Figures 13 and 14, respectively).
Programming of neoplasms is based on an evolutionary-mechanism that is not completely clarified in brain tumors. The T/CTCs ratio of cells lacking expression of C, V, and E indicate the highest value amongst all patients (Figure 1). The ratio of cells lacking PE, including C0, V0, and E0, reflects lower value in two patients with metastatic brain tumors (patients 16 and 17) and highlights the lowest value in CM-patient (i.e. more migrated tumor cells to the BS) (Figure 1). Furthermore, the declined or elevated values of T/B ratio play an important role in initiation and promotion of an evolutionary and developmental process through which transformation of the tumor cells lacking PE to the cells with positive PE, by gaining different intensity of expression will be possible. So, the sequential ratio is heterogeneous, varying within ranges of 113.37-903.33 in CCL2, 61-595.14 in VEGF, and 17.70-307.69 in EGF (Figure 1). Such pattern for the tumor cells is a challenging item in cancer initiation and progression. The question is whether such diversity has positive or negative impact on the invasiveness of tumor. An essential step in T progression is the most cooperative manner between relevant proteins, and a successful protein co-expression depends on the stage of disease, frequency of involved cells, and intensity of PE. Besides, systematic classification of the initiator factors would facilitate innovation of therapeutic channels. Distribution of ratios for C, V, and E is indicative of: (1) Diversity between different patients with the same tumor and between the categorized intensity-based ratios and total-based ratios, including total C, total V, and total E (Figure 1); and (2) The origin of evolution at the primary tumor, followed through blood with further behavior in the host organ (unpublished data). Besides, remarkable poor prognosis is related to the ratios less than 1. The AS is based on the intensity of expression that varied in different proteins and is provided as C1 (patient 5), V1 (patients 1 and 5), E1 (patient 5), C2 (in patients 5 and 8), V2 (patient 5), E2 (patient 5), and V3 (patient 4). An equal ratio is, exceptionally, observed in patient 5 for C1 category (Figure 1).
The harmonic- and non-harmonic status of the provided ratios for C/V/E is due to the different intensity-based classification through the course of evolution (Figure 2A and B). According to the co-expression images (Figure 9A and B), the migrated cells are, diversely, observed in the blood territory, ranging between 1.06-24.85 for the meningioma’s and 0.08-0.92 for malignant tumors (Figure 3A and B). Co-expression including CCL2/VEGF, CCL2/EGF, EGF/VEGF, and CCL2/VEGF/EGF reveals the higher frequency of cells in T- than in blood-territory. Interestingly, only the ratio of PE in the vesicles, vasculature, and microvesicles is found to be higher in blood than in tumor, which may be the sign of poor prognosis for patients 5, 7, 8, 9, 13, 15, 16, 17, and 18 (Figure 3A and B). Convincingly, it is aimed that a complementary AS can provide more details on the nature and evolutionary process at tumor and blood levels for offering the road map of CTCs in brain tumors and other neoplasms. The key role of circulating micro-vesicles has been highlighted in leukemic cell-to-cell cross talk by integrating the key proteins in vitro[21]. They have stated that the quantity of micro-vesicles can increase cell proliferation. In addition, our results highlight the quantitative analysis of involved proteins including VEGF in microvesicles of the tumor and CTCs with a persuasive impact on the clinical management. Interestingly, our results opposed the complete capability of BBB and highlight a complete availability of brain CTCs.
By considering degree of the PE-intensity, C, V, and E have medium status in common with ratio less than 1. Such pattern may provide poor prognosis for patient 5 with meningioma, micro-metastasis, and positive D1853N polymorphism. Furthermore, this patient had also minimum ratio of T/CTCs for low and medium intensity of VEGF and EGF in common, which is also a sign for poor prognosis. Two patients with metastasis (15 and 16) are unique examples with poor prognosis by having < 1 ratio of cells with low PE in common; patient 16 also had different degree of PE for CCL2 and VEGF (Figure 1). Poor prognosis is related to the low expression of VEGF and EGF (T/B ratio 0.78 and 0.06 respectively) in patient 17 as a breast cancer (BC)-metastatic patient and positive/predisposing D1853N polymorphism. This polymorphism led to occurrence of further exonic and/or intronic alterations with negative impact on the clinical outcome[22-24].
The ratio of T/CTCs for lacking PE in C, V, and E may be harmonic and categorization of the ratios will have an influential and complementary role in the progression of tumor and clinical management (Figure 2A and B). By considering harmonic ratio of tumor cells lacking PE, seven patients (1-3, 7, 10, 11, and 15) reflect a remarkable triangle harmonic status of C/V/E, followed by dual harmonic status of C/V in patients 4, 5, 8, and 9; dual pattern of V/E in patients 12, 13, 17, and 18; and dual harmonic pattern of C/E in patients 13 and 17. These data reflect involvement of the triangle PE within diverse values in different patients. So, the cooperation between different proteins with diverse ratio may facilitate the initiation and promotion of the harmonic/cascade/evolutionary events as the elevated and/or decreased ratio as well.
By considering a novel categorization, different patterns of evolution, including dual-, triple-, and multi-, model are provided. The altered intensity (low: 1, medium: 2, high: 3) of expression leads to transform low-intensity to medium or high in C, V, and E proteins that include: (1) Dual pattern from V1 > V2 and from E1 > E2 in patients 1, 2, 9, 12, 13, and 18; (2) Dual model as V2 > V3 and E2 > E3 in patients 1 and 12; (3) Triple model as C1 > C2 and V1 > V2 and E1 > E2 alterations in patients 2, 9, 13, 15, and 16; triple pattern formation as C2 > C3, V2 > V3 and E2 > E3 in patients 10, 12, 13, 14 and 17; and (4) Multi pattern development including C1 > C2, V1 > V2, C2 > C3, V2 > V3, and E2 > E3 in patient 8 who harbors the most complicated evolutionary model in which all the initiative events are accompanied by complimentary functional incidents. So, the model is initiated simply by the occurrence of dual-evolution and is followed by further diverse development of triple-events. Conclusively, to form the completed model, diverse dual and triple patterns are required to be formed, and the priority of initial formation could occur from the low expression with further development to medium- and high-intensity of expression (Figure 4A and B). These evolutionary models in our patients reflect the occurrence of cascade events with common origin. The provided model indicates the cross-talk between initiative and the complementary channels to form an evolutionary insight in cancer. Such pattern could occur in all types of neoplastic tumors with further evolution through the metastatic process (unpublished data). It is essential to emphasize that such models vary within different proteins and patients. Therefore, these patterns are rather personalized with specific and multi-combinational patterns.
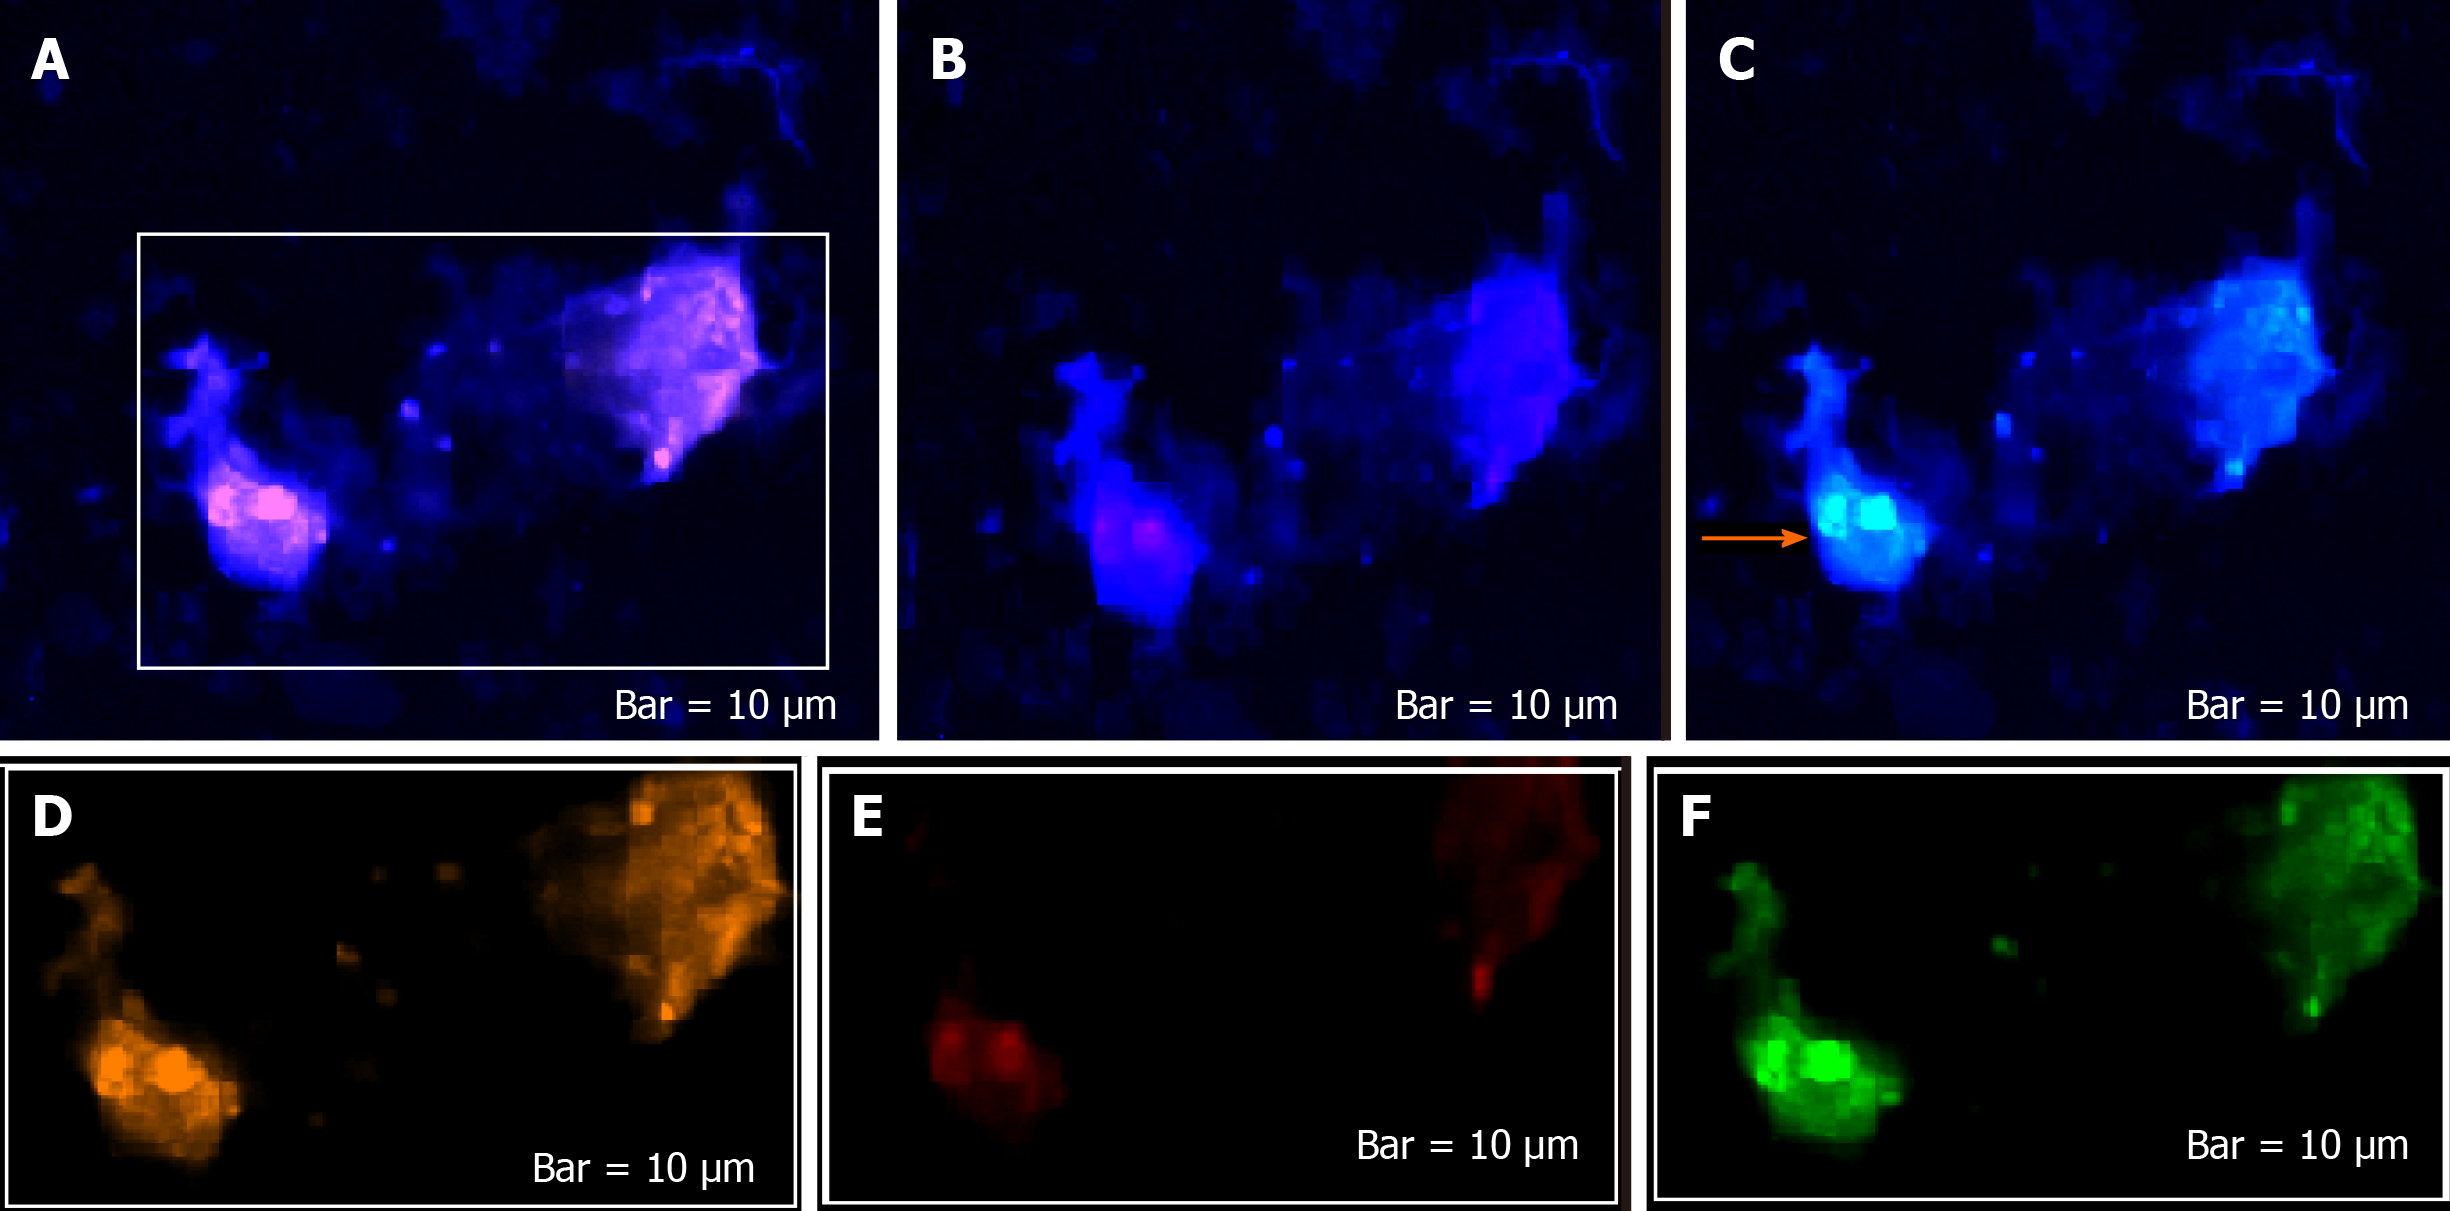
In patients 5 and 8, the higher PE in CTCs may be indicative of the occurrence of an evolution in favor of the metastatic process (Figure 5). Interestingly, the manner of PE was more diverse between the cells in tumor than in the migrated cells into the vascular system within the tumor region (Figure 6A) and also in the CTCs within the blood territory in patient 4 with meningioma (Figure 6B). Status of PE in CCL2/ VEGF/EGF of the two cell populations from tumor sample of patient 11 and CTCs presents the journey from tumor to the destinations, including the vascular- and BS-territory (Figure 7). In spite of the lowest expression of EGF/VEGF (Figure 7C and D), higher expression with CCL2 and the co-expression within CTCs is noticeable in patient 13 (Figure 8E and G). Migrated tumor cells within tumor territory to the BS are shown by arrows (Figure 9C-H) in which the co-expression of CCL2/VEG and CCL2/VEGF/EGF is more remarkable than in CCL2/EGF (Figure 9F-H). Regarding patient 17, more cells conjugated with CCL2 are observable than with VEGF and EGF (Figure 10B-D). Images C, D, and G reflected an observable expression in a single CTC with proteins VEGF and EGF but not with CCL2 in image B. In contrast, the mode of expression is diverse within the vasculature territory. There was a diverse co-expression pattern indicating more harmonic interaction between CCL2/VEGF than CCL2/EGF. However, co-expression between these proteins was remarkable either in CTCs or within the vasculature territory (Figure 10). In patient 18 with CM, co-expression between CCL2/VEGF/EGF is observable in CTCs (Figure 11A), but there is only a single CTC with high expression of CCL2 (Figure 11B). In contrast, high expression of VEGF and EGF, with slight difference between these two proteins, is observable (Figure 11C and D).
For tracing the tissue origin of CTCs, PE of NM is accompanied by stem cell marker CD133 and VEGF in patient 1 (Figure 12), presenting the cluster of cells with higher expression of NM (Figure 12B) and few cells with lower expression of CD133 and VEGF (Figure 12D and E). Interestingly, remarkable co-expression between NM/CD133/VEGF in CTCs may be indicative of a warning message for probable invasiveness of the tumor. The presence of CTCs was confirmed by the mode of cytokeratin-19+/CD45- in patients 16 and 17 (Figures 13 and 14).
The minimal residual disease was traced by CTCs in the blood of BC patients[25]. They have reported a poorer outcome by detecting ≥ 5 CTCs/7.5 mL of PB by automated cell Search® system. Furthermore, presence of ≥ 1 CTC/7.5 mL pre- and post-chemotherapy has led to distant metastasis[26]. They also highlighted that although CTC was correlated with circulating VEGF, there was no association with status of EGF. So they have proposed that the CTCs may be a remarkable predicting response to the angiogenic inhibitors. CTCs are known as epithelial tumor cells, traceable in the BS of solid tumors at the molecular level. CTCs have also been considered in research and clinical management since 1990. But, no categorized cell-based diagnostic strategy as the translational research in cancer has been provided yet. There are the notable challenges on tracing of CTCs, so an alphabetic guideline is required for this topic. Therefore, we aimed to explore the scenario of the behavior of CTCs in brain tumor/blood samples to provide the personalized, hypothetical-based agenda in the brain neoplasms that can be applied in other types of neoplastic disorders; and also as a follow-up approach in the patients and their relatives who are at risk.
The prognostic potential of CTCs and the clinical significances in different tumors and a few examples on BC-brain metastasis are reviewed[27]. They have delivered the application of “Liquid biopsy” at mRNA level. The machinery of CTCs with focus on genomes and transcriptomes is also reviewed[28]. It was also reported that the presence of CTCs plays an independent role in prognosis of BC with brain or bone metastasis[29]. In spite of the presence of only ≥ 5 CTCs, they found a correlation between the undetectable CTCs and occurrence of metastasis in brain but not in bone. So, they concluded that undetected CTCs might be due to an incomplete tracing of CTCs by automated Cell Search system and possibly related to the “epithelial-mesenchymal transition. The first reason is cleared by the enumeration strategy in our present data. However, our data indicate that BBB may have very limited restriction on the tumor cell migration into the BS (Figure 15).
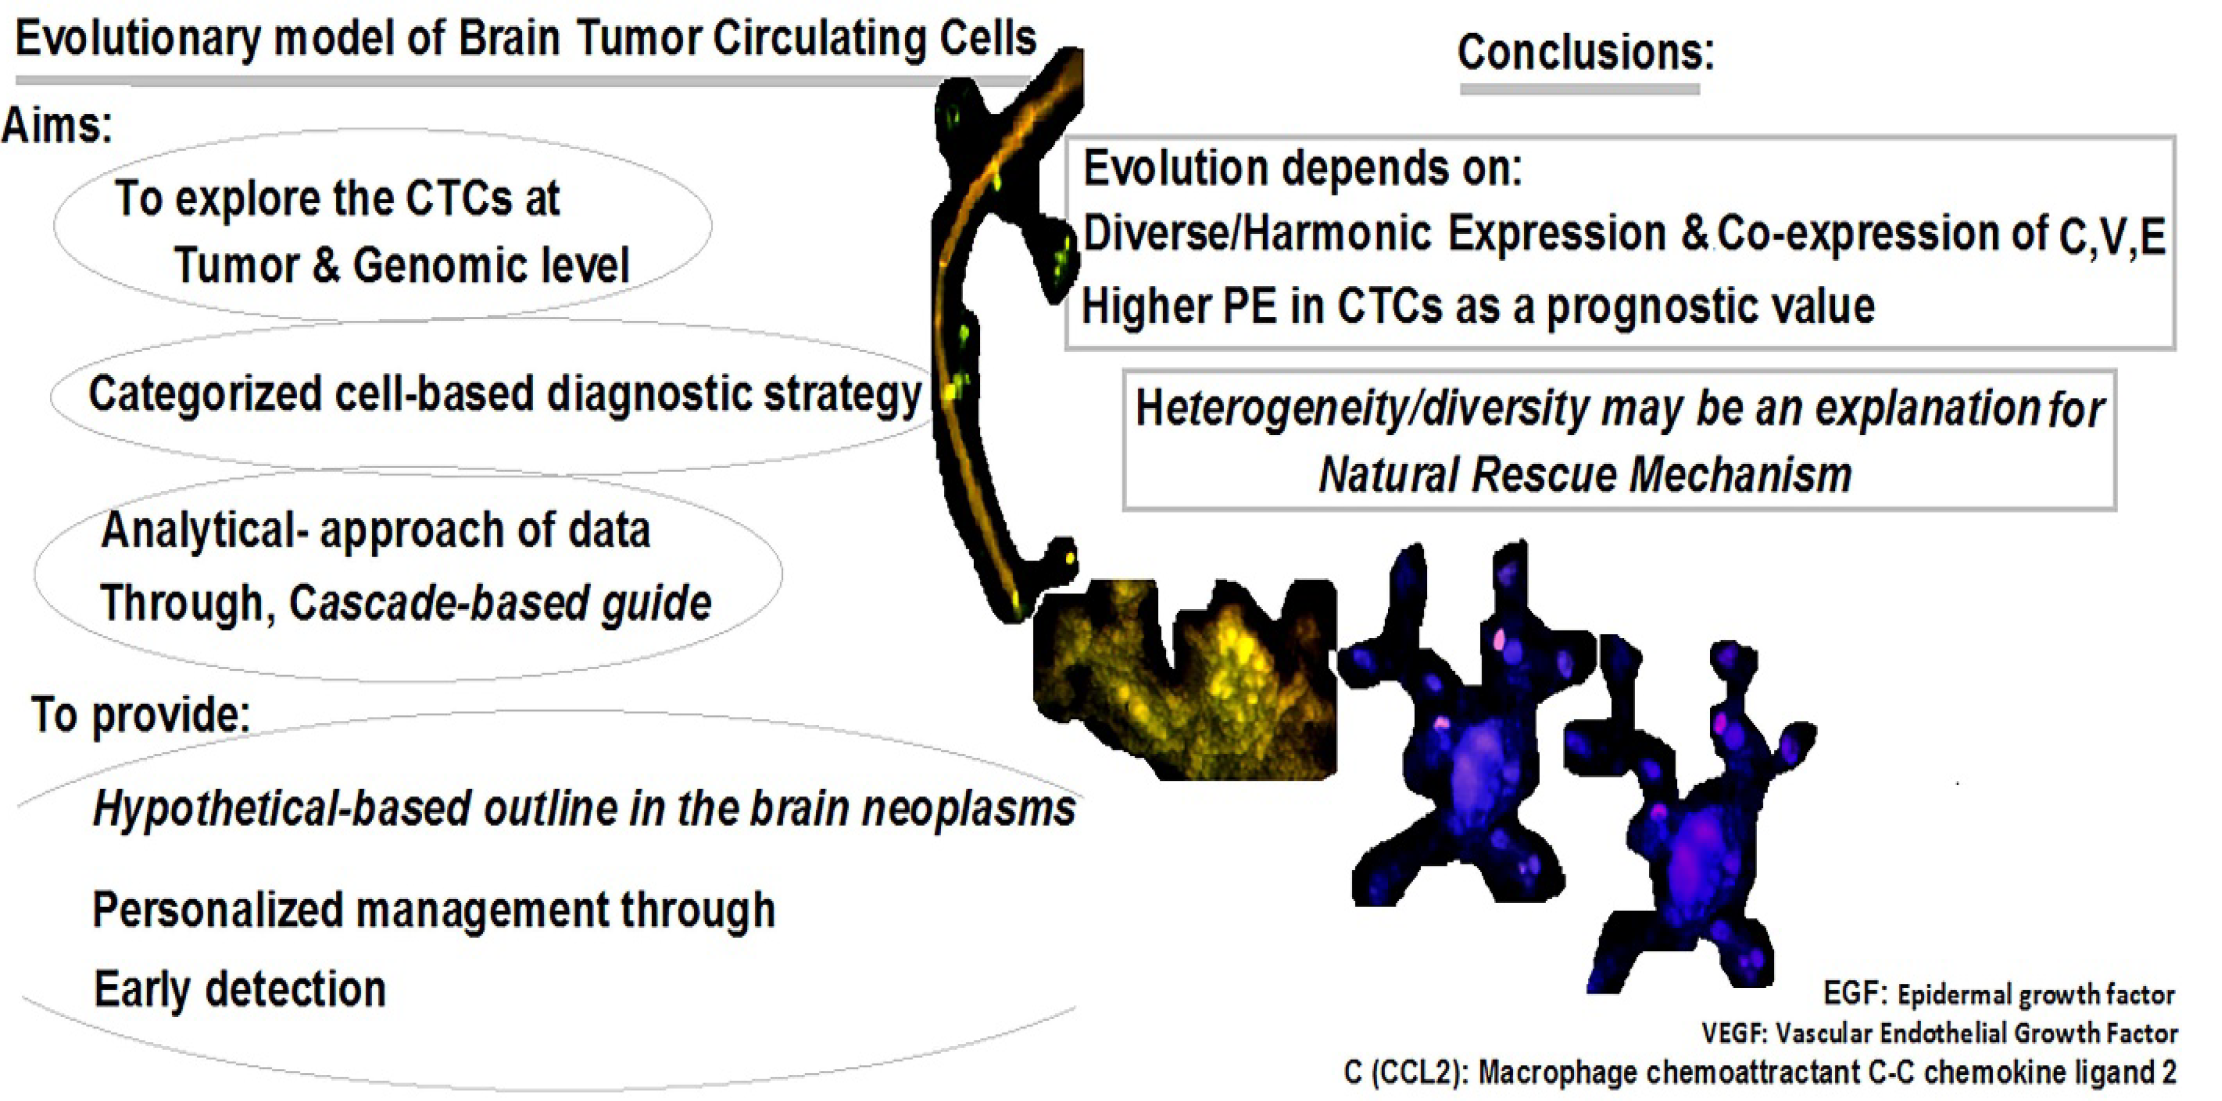
Heterogeneity/diversity may be an explanation for the Natural Rescue Mechanism through which the severity of disease may be minimized in brain tumors and hopefully in other neoplasms.
Adequate informative data on CTCs is a guideline for management of metastatic process. Regarding the application of anti-VEGF in brain tumors, the multi-disciplinary insight in the therapeutic strategy is also required. Interestingly, application of anti-CCL2 in tumorigenic models has led to weakening the metastasis and improving the survival period[30]. So, adequate enumeration of CTCs, formulated predictive information with a personalized-based strategy for different types of cancers, will be possible. As questions: Whether the high number of CTCs is reflective of (1) poor developmental course of neoplasms; and (2) poor survival status or recurrence? Or relapse? And does low enumeration of CTCs lead to the false negative diagnosis?
Circulating tumor cells (CTCs) are the most applicable strategy in preventive oncology. The most puzzling items include the lack of: (1) The basic information on the migrated cells into the tumor and into the blood stream; (2) The categorized data for the personalized strategy of CTCs; (3) Information on the application of CTCs for the patients affected with brain tumors as early as possible; and (4) The data on the early detection of the brain tumors in the probands affected with brain tumor and the relatives through their pedigree. Hence, it was aimed to explore the developmental picture of CTC behavior in tumor (T) and blood in the brain neoplasms.
The key target to explore CTCs was revealed to be early detection; therefore, availability of adequate data on the pedigree of proband affected either with brain tumor or any other neoplastic disorder (s) will facilitate application of the preventive strategy for the probands’ relatives who are at risk of being affected with the neoplastic disorders.
In the cancer-prone families: The target objectives, include: (1) The family history of any neoplastic disorders in the proband’s pedigree and age of the onset for the target individuals; (2) The key information for each individual affected with neoplastic disorder including cancer; (3) Tracing and selecting the target relatives of the probands; and (4) Performing the CTC test for the selected individuals.
In the family of the probands without any history of the neoplastic disorders: In case of the influential micro-and/or macro-environmental hazards, the target offspring of the proband through the further generations may be selected for the performance of CTCs.
The novelty of this research is relied on the simple Manuel analysis, which provides an adequate single cell screening process. Based on this strategy, diverse pattern of intensity and categorization of different target proteins will be facilitated.
The course of evolution and possibility of metastatic event rely on the higher protein expression in CTCs. Such a finding is indicative of prognostic value. Besides, diversity in protein expression of the migrated cells into the both tumor and blood stream and diverse pattern of protein expression in both tissues are indicative of the occurrence of evolution. Besides, the harmonic co-expression between C-C chemokine ligand 2/epidermal growth factor and C-C chemokine ligand 2/vascular endothelial growth factor can facilitate the tumor progression including the metastatic event.
There is a diverse pattern of protein expression of the migrated cells at different territories including tumor and the bloodstream by performing CTCs by Manuel analytical strategy to unmask heterogeneity of the protein expression.
The direction of further research includes providing: (1) The educational/informative packages on the early detection by CTCs to the cancer clinics or the related hospitals with the available preventive cancer section; and (2) Cancer Genetic counselling to the referral cancer patients for performing an early detection of probable metastasis by CTCs test.
The authors would like to thank the patients for their participation and providing the required information.
Manuscript source: Invited manuscript
Specialty type: Oncology
Country/Territory of origin: Iran
Peer-review report’s scientific quality classification
Grade A (Excellent): 0
Grade B (Very good): 0
Grade C (Good): C, C
Grade D (Fair): 0
Grade E (Poor): 0
P-Reviewer: Ding L, Zeng YY S-Editor: Fan JR L-Editor: Filipodia P-Editor: Wang LL
| 1. | Louis DN, Perry A, Reifenberger G, von Deimling A, Figarella-Branger D, Cavenee WK, Ohgaki H, Wiestler OD, Kleihues P, Ellison DW. The 2016 World Health Organization Classification of Tumors of the Central Nervous System: a summary. Acta Neuropathol. 2016;131:803-820. [RCA] [PubMed] [DOI] [Full Text] [Cited by in Crossref: 10993] [Cited by in RCA: 10852] [Article Influence: 1205.8] [Reference Citation Analysis (0)] |
| 2. | Provias J, Claffey K, delAguila L, Lau N, Feldkamp M, Guha A. Meningiomas: role of vascular endothelial growth factor/vascular permeability factor in angiogenesis and peritumoral edema. Neurosurgery. 1997;40:1016-1026. [RCA] [PubMed] [DOI] [Full Text] [Cited by in Crossref: 158] [Cited by in RCA: 141] [Article Influence: 5.0] [Reference Citation Analysis (0)] |
| 3. | Rossi D, Zlotnik A. The biology of chemokines and their receptors. Annu Rev Immunol. 2000;18:217-242. [PubMed] [DOI] [Full Text] |
| 4. | Joyce JA, Pollard JW. Microenvironmental regulation of metastasis. Nat Rev Cancer. 2009;9:239-252. [RCA] [PubMed] [DOI] [Full Text] [Full Text (PDF)] [Cited by in Crossref: 2949] [Cited by in RCA: 2766] [Article Influence: 172.9] [Reference Citation Analysis (0)] |
| 5. | Qian BZ, Li J, Zhang H, Kitamura T, Zhang J, Campion LR, Kaiser EA, Snyder LA, Pollard JW. CCL2 recruits inflammatory monocytes to facilitate breast-tumour metastasis. Nature. 2011;475:222-225. [RCA] [PubMed] [DOI] [Full Text] [Full Text (PDF)] [Cited by in Crossref: 2327] [Cited by in RCA: 2221] [Article Influence: 158.6] [Reference Citation Analysis (0)] |
| 6. | Weiss JM, Downie SA, Lyman WD, Berman JW. Astrocyte-derived monocyte-chemoattractant protein-1 directs the transmigration of leukocytes across a model of the human blood-brain barrier. J Immunol. 1998;161:6896-6903. [PubMed] |
| 7. | Simpson JE, Newcombe J, Cuzner ML, Woodroofe MN. Expression of monocyte chemoattractant protein-1 and other beta-chemokines by resident glia and inflammatory cells in multiple sclerosis lesions. J Neuroimmunol. 1998;84:238-249. [RCA] [PubMed] [DOI] [Full Text] [Cited by in Crossref: 309] [Cited by in RCA: 316] [Article Influence: 11.7] [Reference Citation Analysis (0)] |
| 8. | Hanahan D, Weinberg RA. The hallmarks of cancer. Cell. 2000;100:57-70. [RCA] [PubMed] [DOI] [Full Text] [Cited by in Crossref: 19834] [Cited by in RCA: 19494] [Article Influence: 779.8] [Reference Citation Analysis (0)] |
| 9. | Sanson M, Cornu P. Biology of meningiomas. Acta Neurochir (Wien). 2000;142:493-505. [RCA] [PubMed] [DOI] [Full Text] [Cited by in Crossref: 67] [Cited by in RCA: 53] [Article Influence: 2.1] [Reference Citation Analysis (0)] |
| 10. | Gullick WJ. Prevalence of aberrant expression of the epidermal growth factor receptor in human cancers. Br Med Bull. 1991;47:87-98. [RCA] [PubMed] [DOI] [Full Text] [Cited by in Crossref: 325] [Cited by in RCA: 337] [Article Influence: 9.9] [Reference Citation Analysis (0)] |
| 11. | Modjtahedi H, Dean C. The receptor for EGF and its ligands - expression, prognostic value and target for therapy in cancer (review). Int J Oncol. 1994;4:277-296. [RCA] [PubMed] [DOI] [Full Text] [Cited by in Crossref: 7] [Cited by in RCA: 27] [Article Influence: 2.1] [Reference Citation Analysis (0)] |
| 12. | Zhau HY, Chang SM, Chen BQ, Wang Y, Zhang H, Kao C, Sang QA, Pathak SJ, Chung LW. Androgen-repressed phenotype in human prostate cancer. Proc Natl Acad Sci USA. 1996;93:15152-15157. [RCA] [PubMed] [DOI] [Full Text] [Cited by in Crossref: 160] [Cited by in RCA: 167] [Article Influence: 5.8] [Reference Citation Analysis (0)] |
| 13. | Fidler IJ. The pathogenesis of cancer metastasis: the 'seed and soil' hypothesis revisited. Nat Rev Cancer. 2003;3:453-458. [RCA] [PubMed] [DOI] [Full Text] [Cited by in Crossref: 3231] [Cited by in RCA: 3323] [Article Influence: 151.0] [Reference Citation Analysis (0)] |
| 14. | Ashworth T. A case of cancer in which cells similar to those in the tumours were seen in the blood after death. Aust Med J. 1869;14:146. |
| 15. | Yu M, Stott S, Toner M, Maheswaran S, Haber DA. Circulating tumor cells: approaches to isolation and characterization. J Cell Biol. 2011;192:373-382. [RCA] [PubMed] [DOI] [Full Text] [Full Text (PDF)] [Cited by in Crossref: 820] [Cited by in RCA: 810] [Article Influence: 57.9] [Reference Citation Analysis (0)] |
| 16. | Sullivan JP, Nahed BV, Madden MW, Oliveira SM, Springer S, Bhere D, Chi AS, Wakimoto H, Rothenberg SM, Sequist LV, Kapur R, Shah K, Iafrate AJ, Curry WT, Loeffler JS, Batchelor TT, Louis DN, Toner M, Maheswaran S, Haber DA. Brain tumor cells in circulation are enriched for mesenchymal gene expression. Cancer Discov. 2014;4:1299-1309. [RCA] [PubMed] [DOI] [Full Text] [Cited by in Crossref: 159] [Cited by in RCA: 193] [Article Influence: 17.5] [Reference Citation Analysis (0)] |
| 17. | Zhang L, Zhang S, Yao J, Lowery FJ, Zhang Q, Huang WC, Li P, Li M, Wang X, Zhang C, Wang H, Ellis K, Cheerathodi M, McCarty JH, Palmieri D, Saunus J, Lakhani S, Huang S, Sahin AA, Aldape KD, Steeg PS, Yu D. Microenvironment-induced PTEN loss by exosomal microRNA primes brain metastasis outgrowth. Nature. 2015;527:100-104. [RCA] [PubMed] [DOI] [Full Text] [Cited by in Crossref: 861] [Cited by in RCA: 944] [Article Influence: 94.4] [Reference Citation Analysis (0)] |
| 18. | Kaiser J. 'Liquid biopsy' for cancer promises early detection. Science. 2018;359:259. [RCA] [PubMed] [DOI] [Full Text] [Cited by in Crossref: 36] [Cited by in RCA: 41] [Article Influence: 5.9] [Reference Citation Analysis (0)] |
| 19. | Cohen JD, Li L, Wang Y, Thoburn C, Afsari B, Danilova L, Douville C, Javed AA, Wong F, Mattox A, Hruban RH, Wolfgang CL, Goggins MG, Dal Molin M, Wang TL, Roden R, Klein AP, Ptak J, Dobbyn L, Schaefer J, Silliman N, Popoli M, Vogelstein JT, Browne JD, Schoen RE, Brand RE, Tie J, Gibbs P, Wong HL, Mansfield AS, Jen J, Hanash SM, Falconi M, Allen PJ, Zhou S, Bettegowda C, Diaz LA Jr, Tomasetti C, Kinzler KW, Vogelstein B, Lennon AM, Papadopoulos N. Detection and localization of surgically resectable cancers with a multi-analyte blood test. Science. 2018;359:926-930. [RCA] [PubMed] [DOI] [Full Text] [Cited by in Crossref: 1752] [Cited by in RCA: 1878] [Article Influence: 268.3] [Reference Citation Analysis (0)] |
| 20. | Li J, Fu W, Zhang W, Li P. High Number of Circulating Tumor Cells Predicts Poor Survival of Cutaneous Melanoma Patients in China. Med Sci Monit. 2018;24:324-331. [RCA] [PubMed] [DOI] [Full Text] [Full Text (PDF)] [Cited by in Crossref: 9] [Cited by in RCA: 8] [Article Influence: 1.1] [Reference Citation Analysis (0)] |
| 21. | Mehdipour P, Habibi L, Mohammadi-Asl J, Kamalian N, Mehr Azin M. Three-hit hypothesis in astrocytoma: tracing the polymorphism D1853N in ATM gene through a pedigree of the proband affected with primary brain tumor. J Cancer Res Clin Oncol. 2008;134:1173-1180. [RCA] [PubMed] [DOI] [Full Text] [Full Text (PDF)] [Cited by in Crossref: 15] [Cited by in RCA: 11] [Article Influence: 0.6] [Reference Citation Analysis (0)] |
| 22. | Mehdipour P, Mahdavi M, Mohammadi-Asl J, Atri M. Importance of ATM gene as a susceptible trait: predisposition role of D1853N polymorphism in breast cancer. Med Oncol. 2011;28:733-737. [RCA] [PubMed] [DOI] [Full Text] [Cited by in Crossref: 12] [Cited by in RCA: 12] [Article Influence: 0.9] [Reference Citation Analysis (0)] |
| 23. | Mehdipour P, Azarnezhad A. Five-hit hypothesis in ATM gene: An individualized model in a breast cancer patient. Front Biosci (Elite Ed). 2018;10:375-383. [RCA] [PubMed] [DOI] [Full Text] [Cited by in Crossref: 1] [Cited by in RCA: 1] [Article Influence: 0.1] [Reference Citation Analysis (0)] |
| 24. | Milani G, Lana T, Bresolin S, Aveic S, Pastò A, Frasson C, Te Kronnie G. Expression Profiling of Circulating Microvesicles Reveals Intercellular Transmission of Oncogenic Pathways. Mol Cancer Res. 2017;15:683-695. [RCA] [PubMed] [DOI] [Full Text] [Cited by in Crossref: 25] [Cited by in RCA: 28] [Article Influence: 3.5] [Reference Citation Analysis (0)] |
| 25. | Pantel K, Brakenhoff RH, Brandt B. Detection, clinical relevance and specific biological properties of disseminating tumour cells. Nat Rev Cancer. 2008;8:329-340. [RCA] [PubMed] [DOI] [Full Text] [Cited by in Crossref: 883] [Cited by in RCA: 868] [Article Influence: 51.1] [Reference Citation Analysis (0)] |
| 26. | Lang JE, Mosalpuria K, Cristofanilli M, Krishnamurthy S, Reuben J, Singh B, Bedrosian I, Meric-Bernstam F, Lucci A. HER2 status predicts the presence of circulating tumor cells in patients with operable breast cancer. Breast Cancer Res Treat. 2009;113:501-507. [RCA] [PubMed] [DOI] [Full Text] [Cited by in Crossref: 64] [Cited by in RCA: 64] [Article Influence: 4.0] [Reference Citation Analysis (0)] |
| 27. | Alix-Panabières C, Pantel K. Challenges in circulating tumour cell research. Nat Rev Cancer. 2014;14:623-631. [RCA] [PubMed] [DOI] [Full Text] [Cited by in Crossref: 917] [Cited by in RCA: 1011] [Article Influence: 91.9] [Reference Citation Analysis (0)] |
| 28. | Pantel K, Speicher MR. The biology of circulating tumor cells. Oncogene. 2016;35:1216-1224. [RCA] [PubMed] [DOI] [Full Text] [Cited by in Crossref: 396] [Cited by in RCA: 376] [Article Influence: 41.8] [Reference Citation Analysis (0)] |
| 29. | Mego M, De Giorgi U, Dawood S, Wang X, Valero V, Andreopoulou E, Handy B, Ueno NT, Reuben JM, Cristofanilli M. Characterization of metastatic breast cancer patients with nondetectable circulating tumor cells. Int J Cancer. 2011;129:417-423. [RCA] [PubMed] [DOI] [Full Text] [Cited by in Crossref: 80] [Cited by in RCA: 85] [Article Influence: 5.7] [Reference Citation Analysis (0)] |
| 30. | Hitchcock JR, Watson CJ. Anti-CCL2: building a reservoir or opening the floodgates to metastasis? Breast Cancer Res. 2015;17:68. [RCA] [PubMed] [DOI] [Full Text] [Full Text (PDF)] [Cited by in Crossref: 10] [Cited by in RCA: 13] [Article Influence: 1.3] [Reference Citation Analysis (0)] |


