Copyright
©The Author(s) 2025.
World J Clin Oncol. Apr 24, 2025; 16(4): 102565
Published online Apr 24, 2025. doi: 10.5306/wjco.v16.i4.102565
Published online Apr 24, 2025. doi: 10.5306/wjco.v16.i4.102565
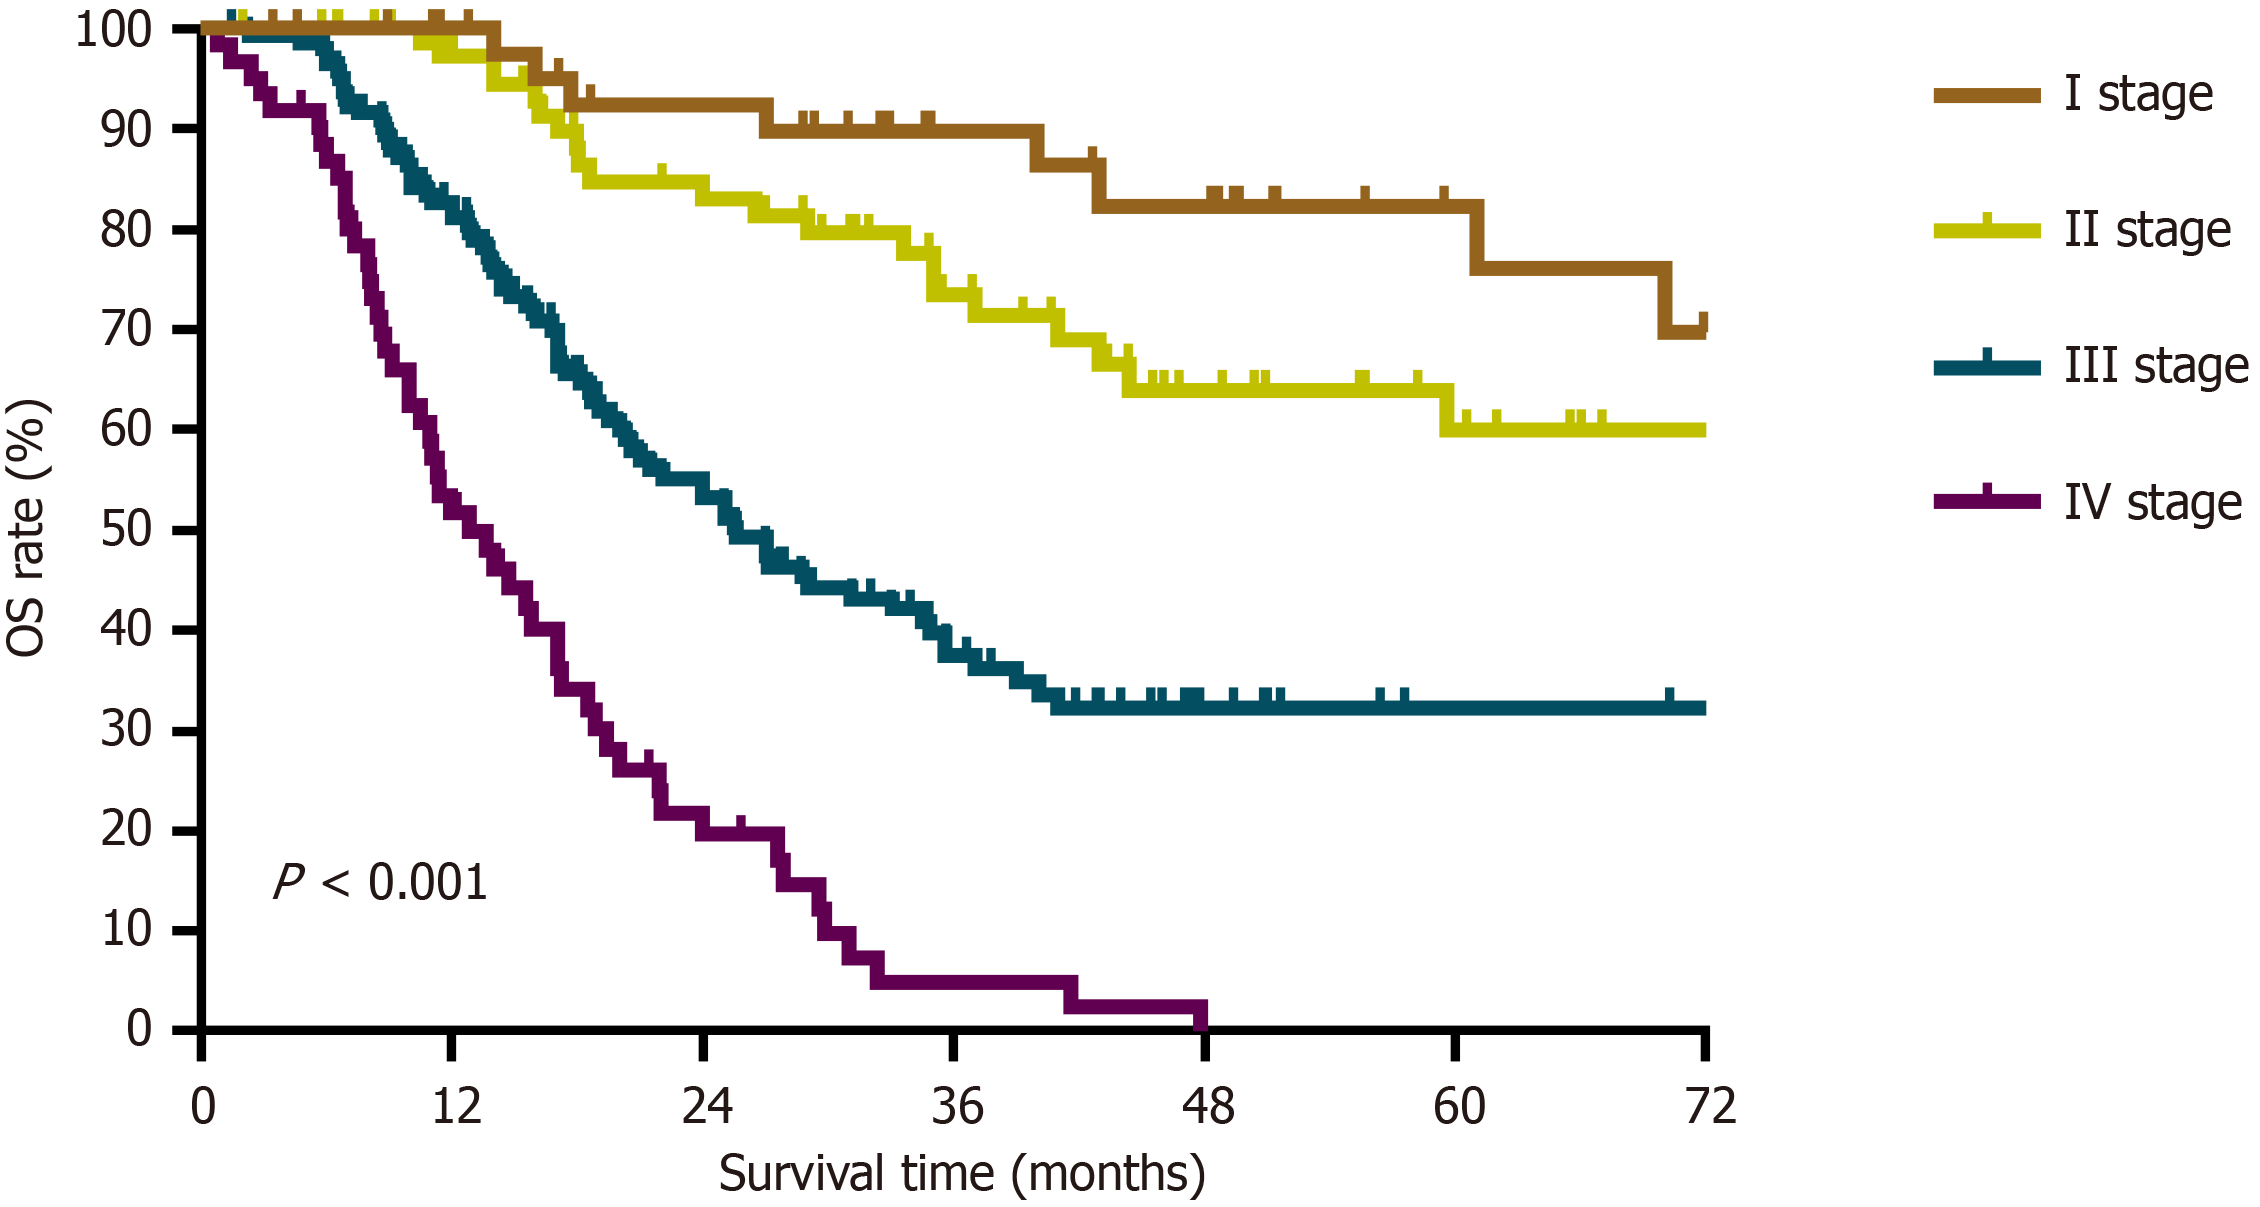
Figure 1 Comparison of overall survival among stage I, stage II, stage III and stage IV patients.
OS: Overall survival.
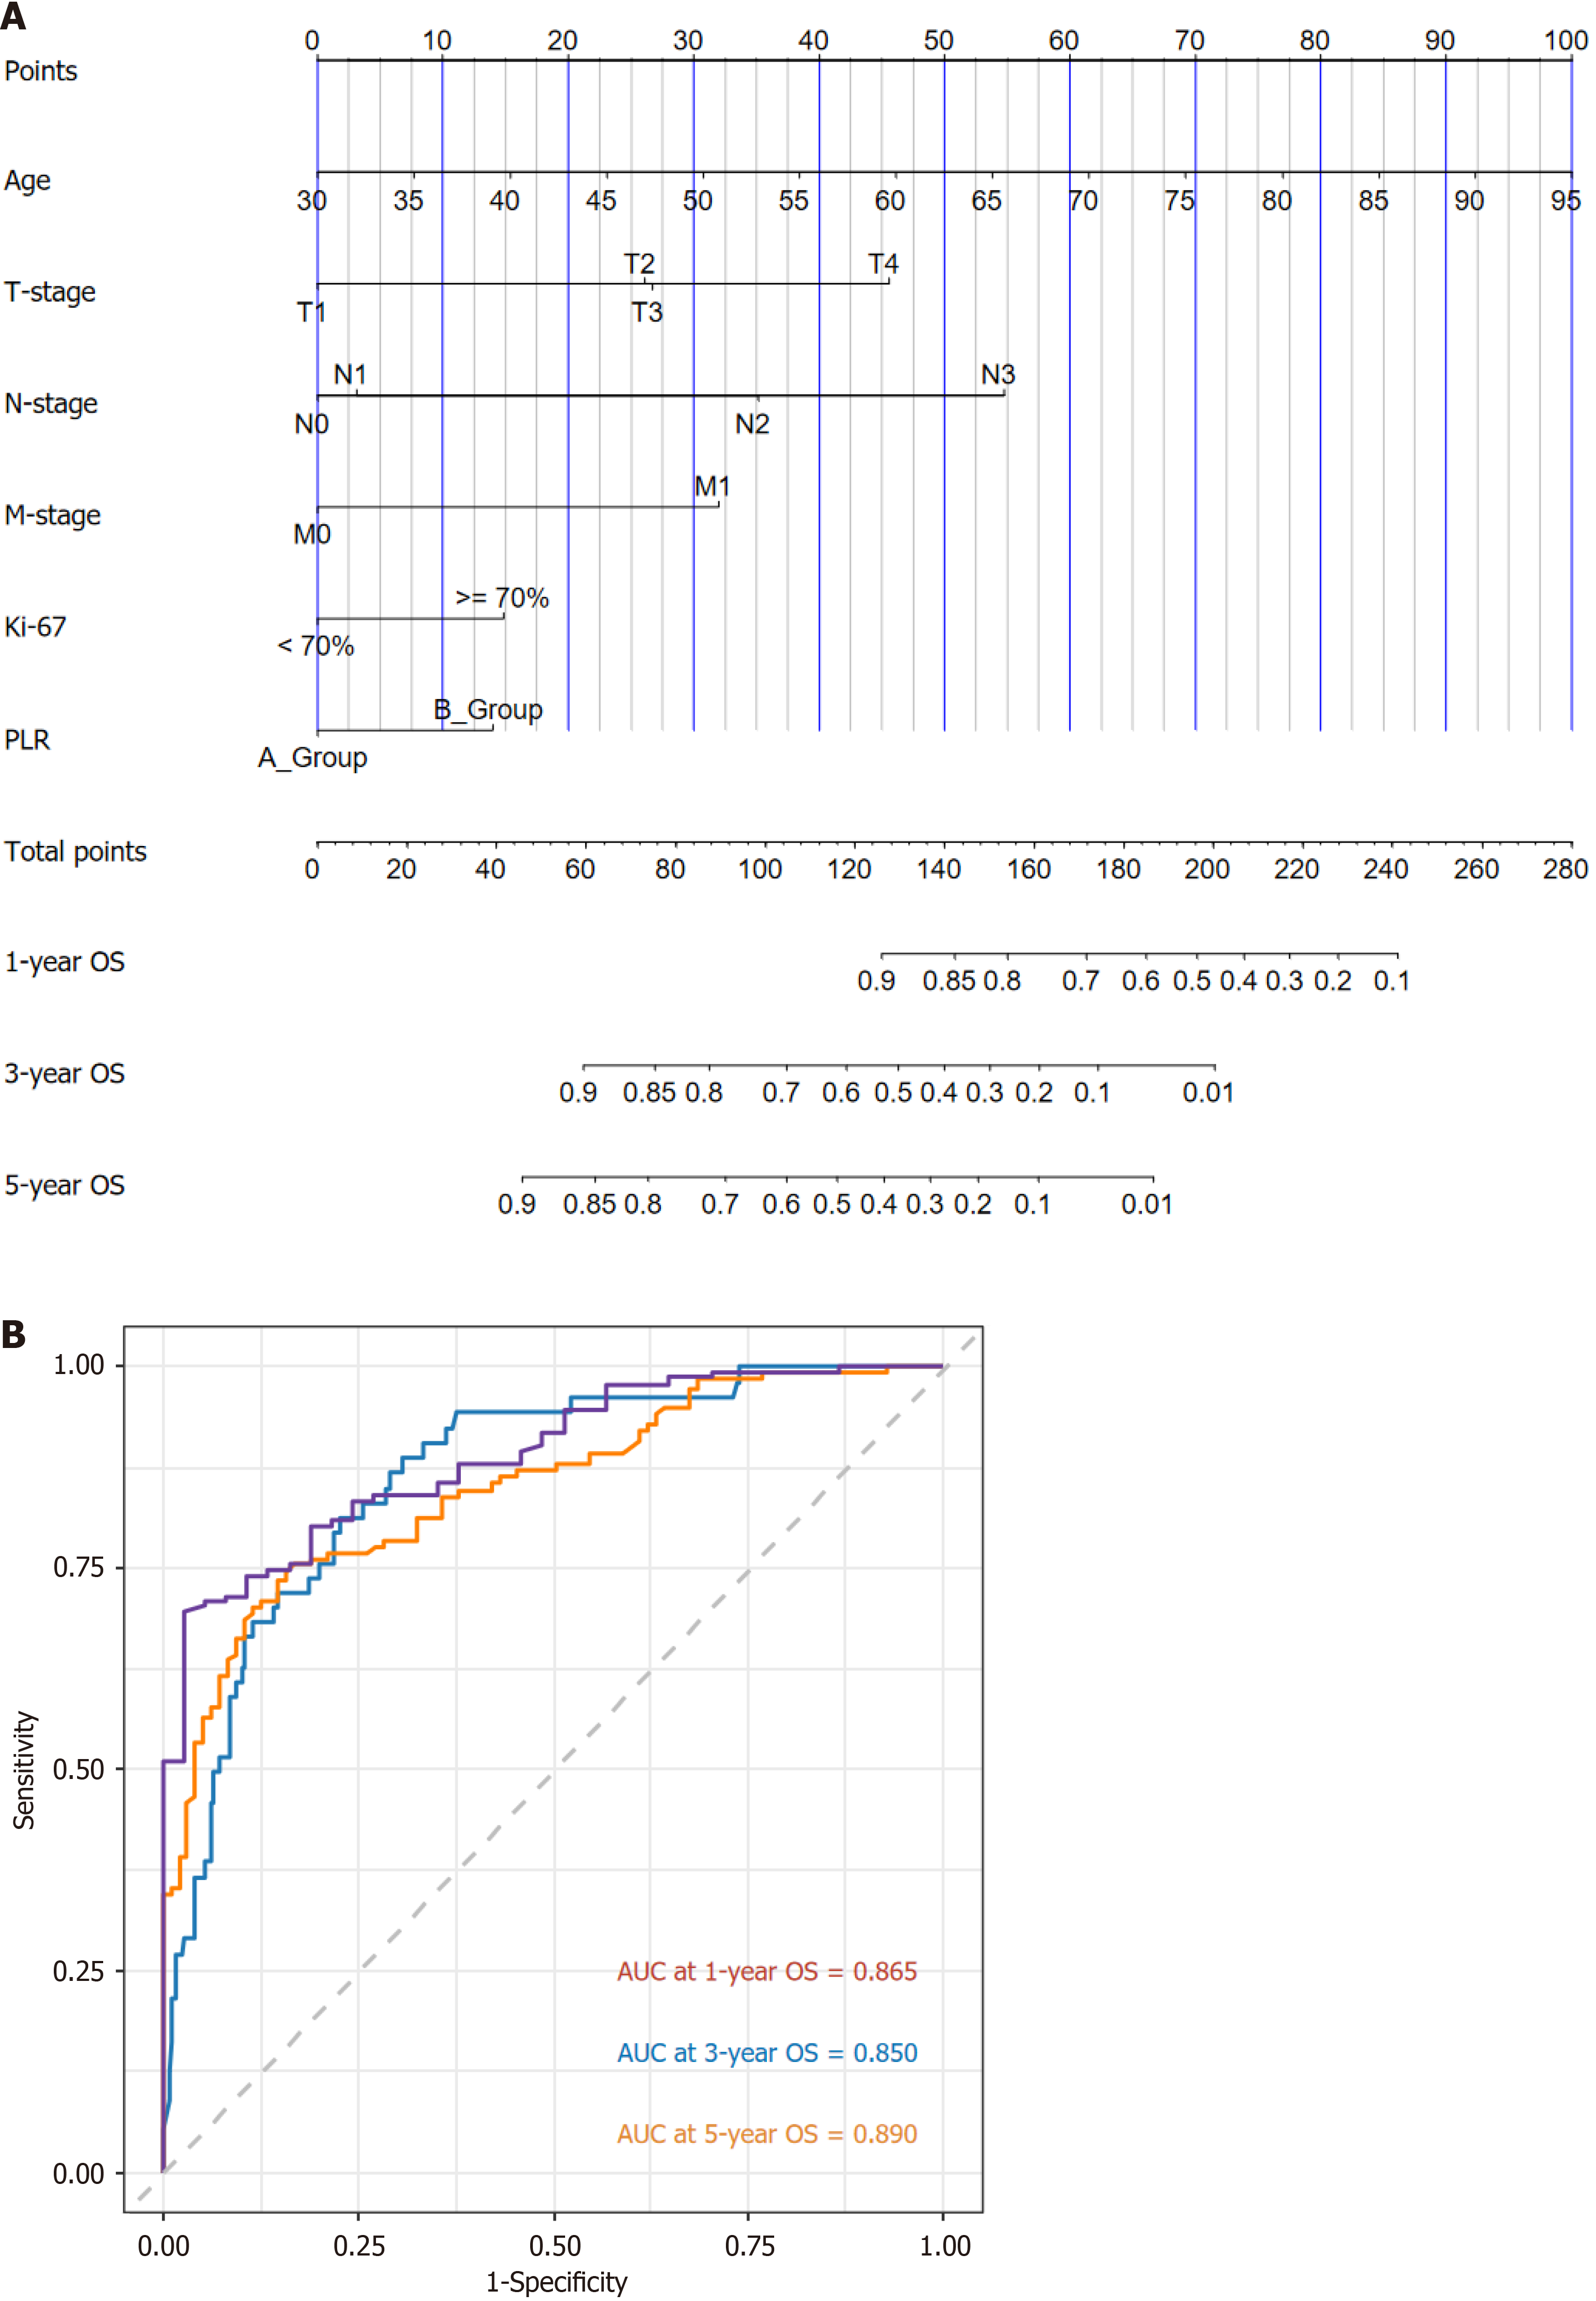
Figure 2 Nomogram prediction model.
A: Nomogram prediction model for 1-year, 3-year, and 5-year overall survival in patients; B: Receiver operating characteristic for the nomogram prediction model. PLR: Platelet-to-lymphocyte ratio; OS: Overall survival; AUC: Area under the curve.
Figure 3 Calibration curve for the nomogram prediction model.
OS: Overall survival.
Figure 4 Decision curve analysis of nomogram prediction model and American Joint Committee on Cancer (8th edition) tumor-node-metastasis staging system.
A: 1-year overall survival (OS); B: 3-year OS; C: 5-year OS. TNM: Tumor-node-metastasis.
- Citation: Zhang BL, Peng F, Li L, Gao YH, Wang ZJ, Lu YX, Chen L, Zhang KC. Construction and validation of a novel prognostic nomogram for patients with poorly differentiated gastric neuroendocrine neoplasms. World J Clin Oncol 2025; 16(4): 102565
- URL: https://www.wjgnet.com/2218-4333/full/v16/i4/102565.htm
- DOI: https://dx.doi.org/10.5306/wjco.v16.i4.102565


