Copyright
©The Author(s) 2025.
World J Clin Oncol. Apr 24, 2025; 16(4): 102397
Published online Apr 24, 2025. doi: 10.5306/wjco.v16.i4.102397
Published online Apr 24, 2025. doi: 10.5306/wjco.v16.i4.102397
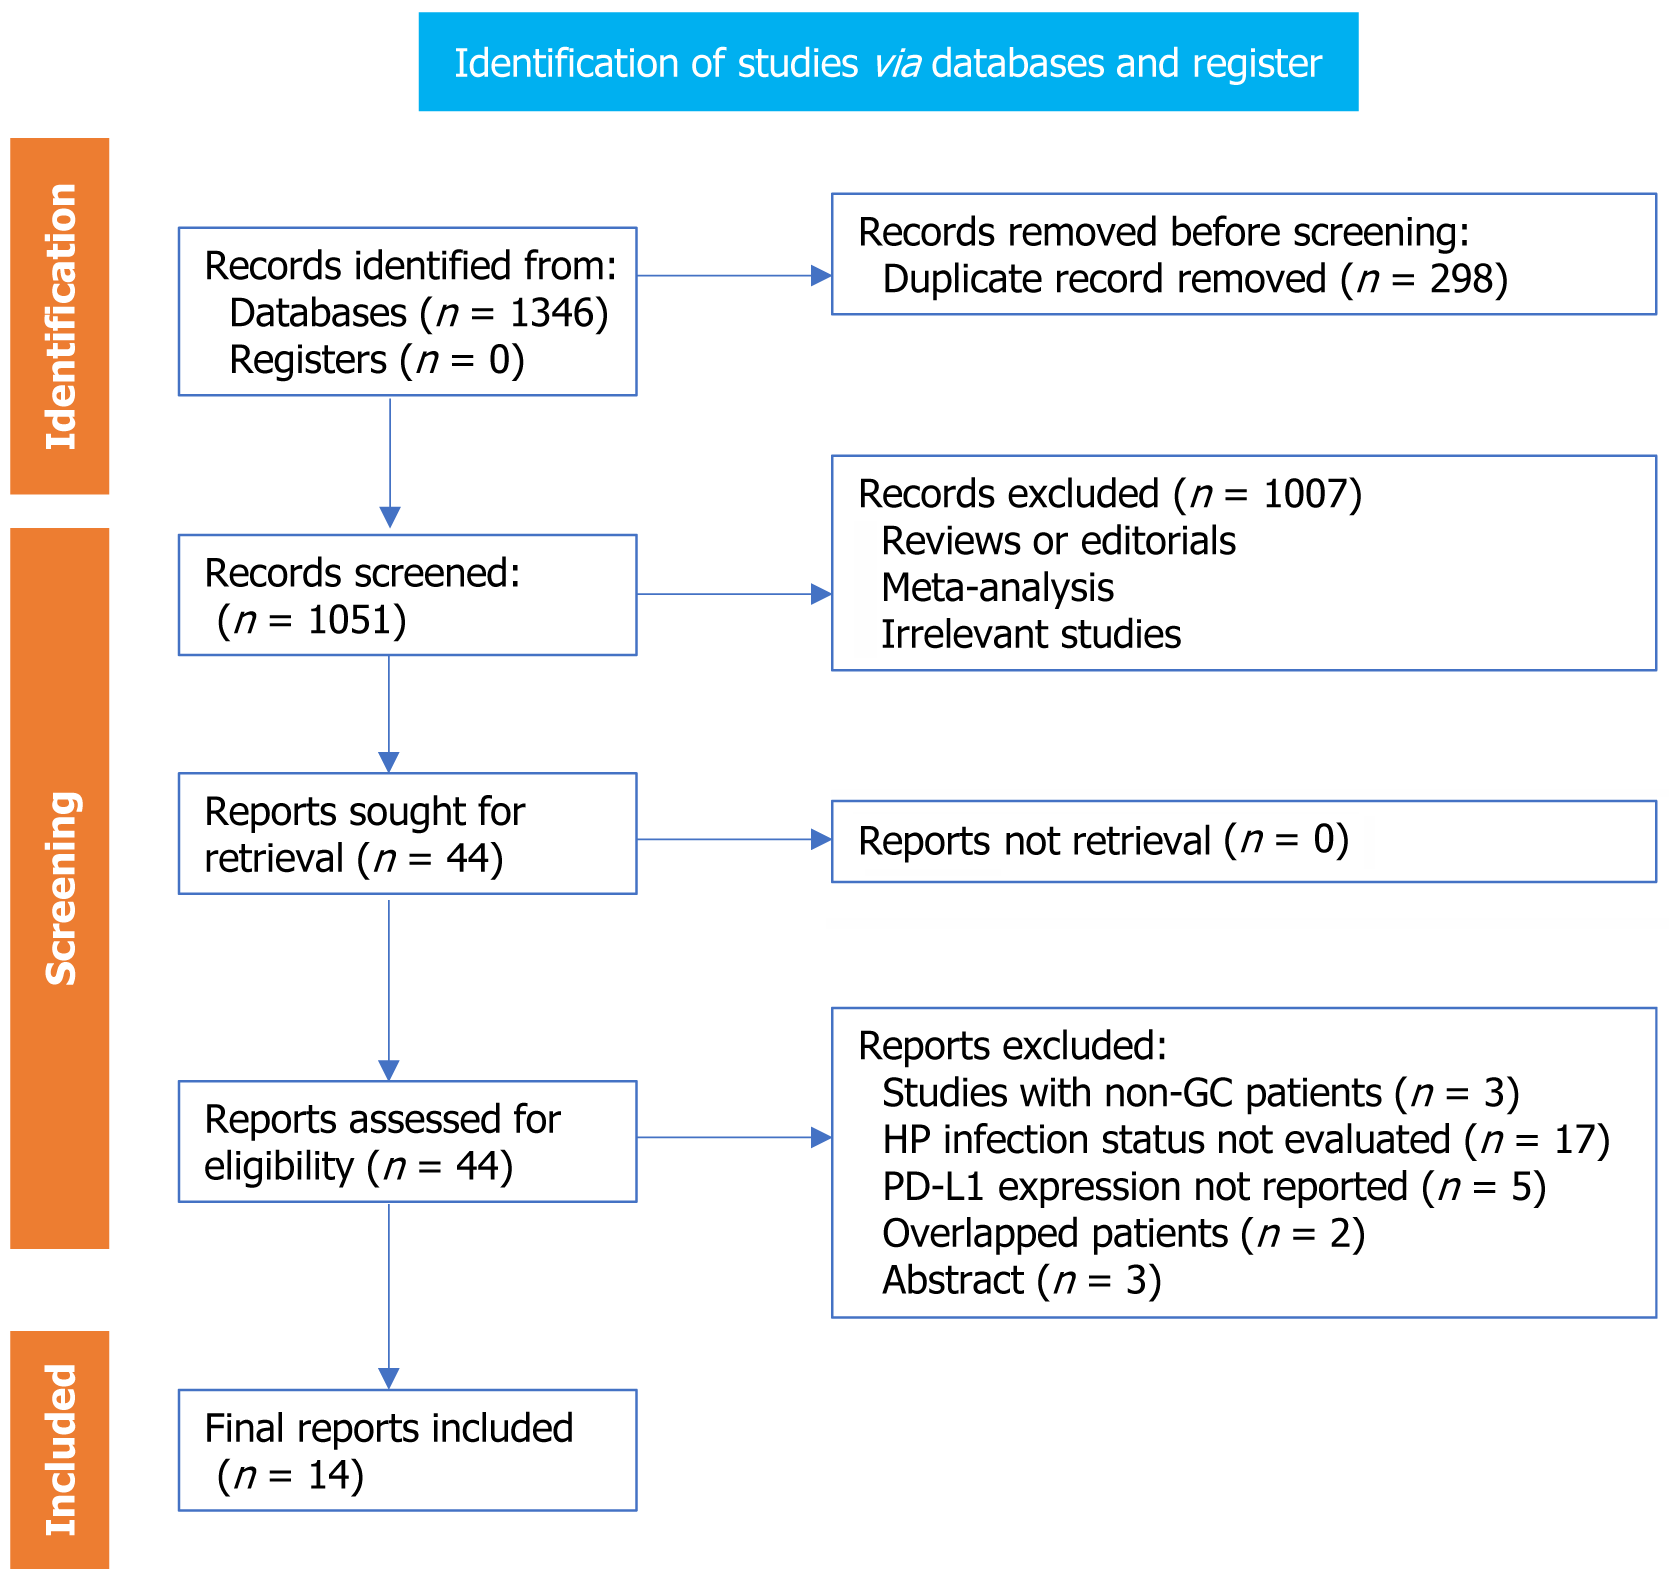
Figure 1 Diagram of database search and study inclusion.
GC: Gastric cancer; HP: Helicobacter pylori; PD-L1: Programmed death ligand-1.
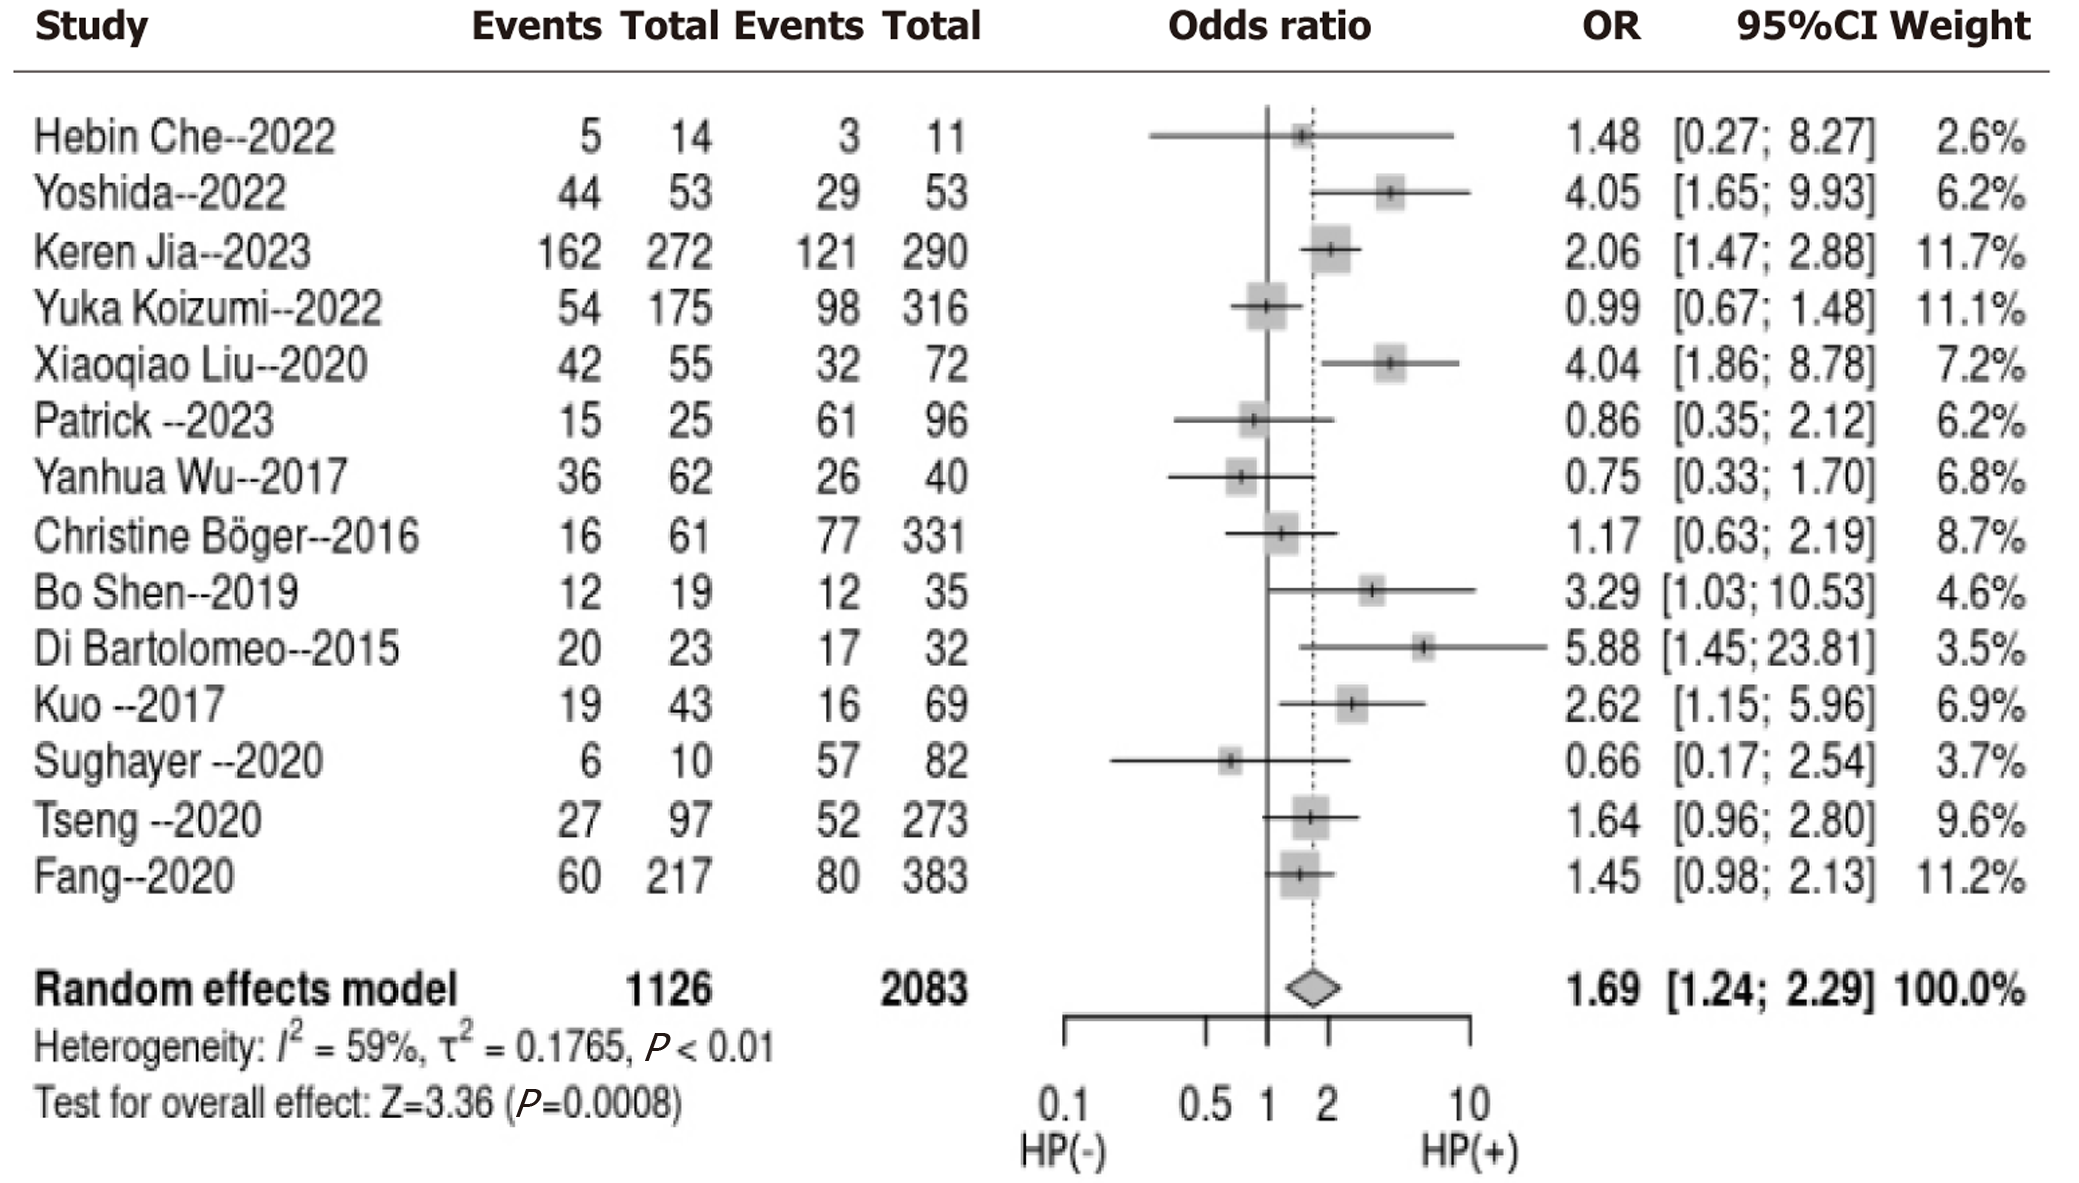
Figure 2 Forest plots for meta-analyses regarding the association between Helicobacter pylori infection and programmed death ligand-1 tumor expression in patients with gastric cancer.
HP: Helicobacter pylori; CI: Confidence interval; OR: Odds ratio.
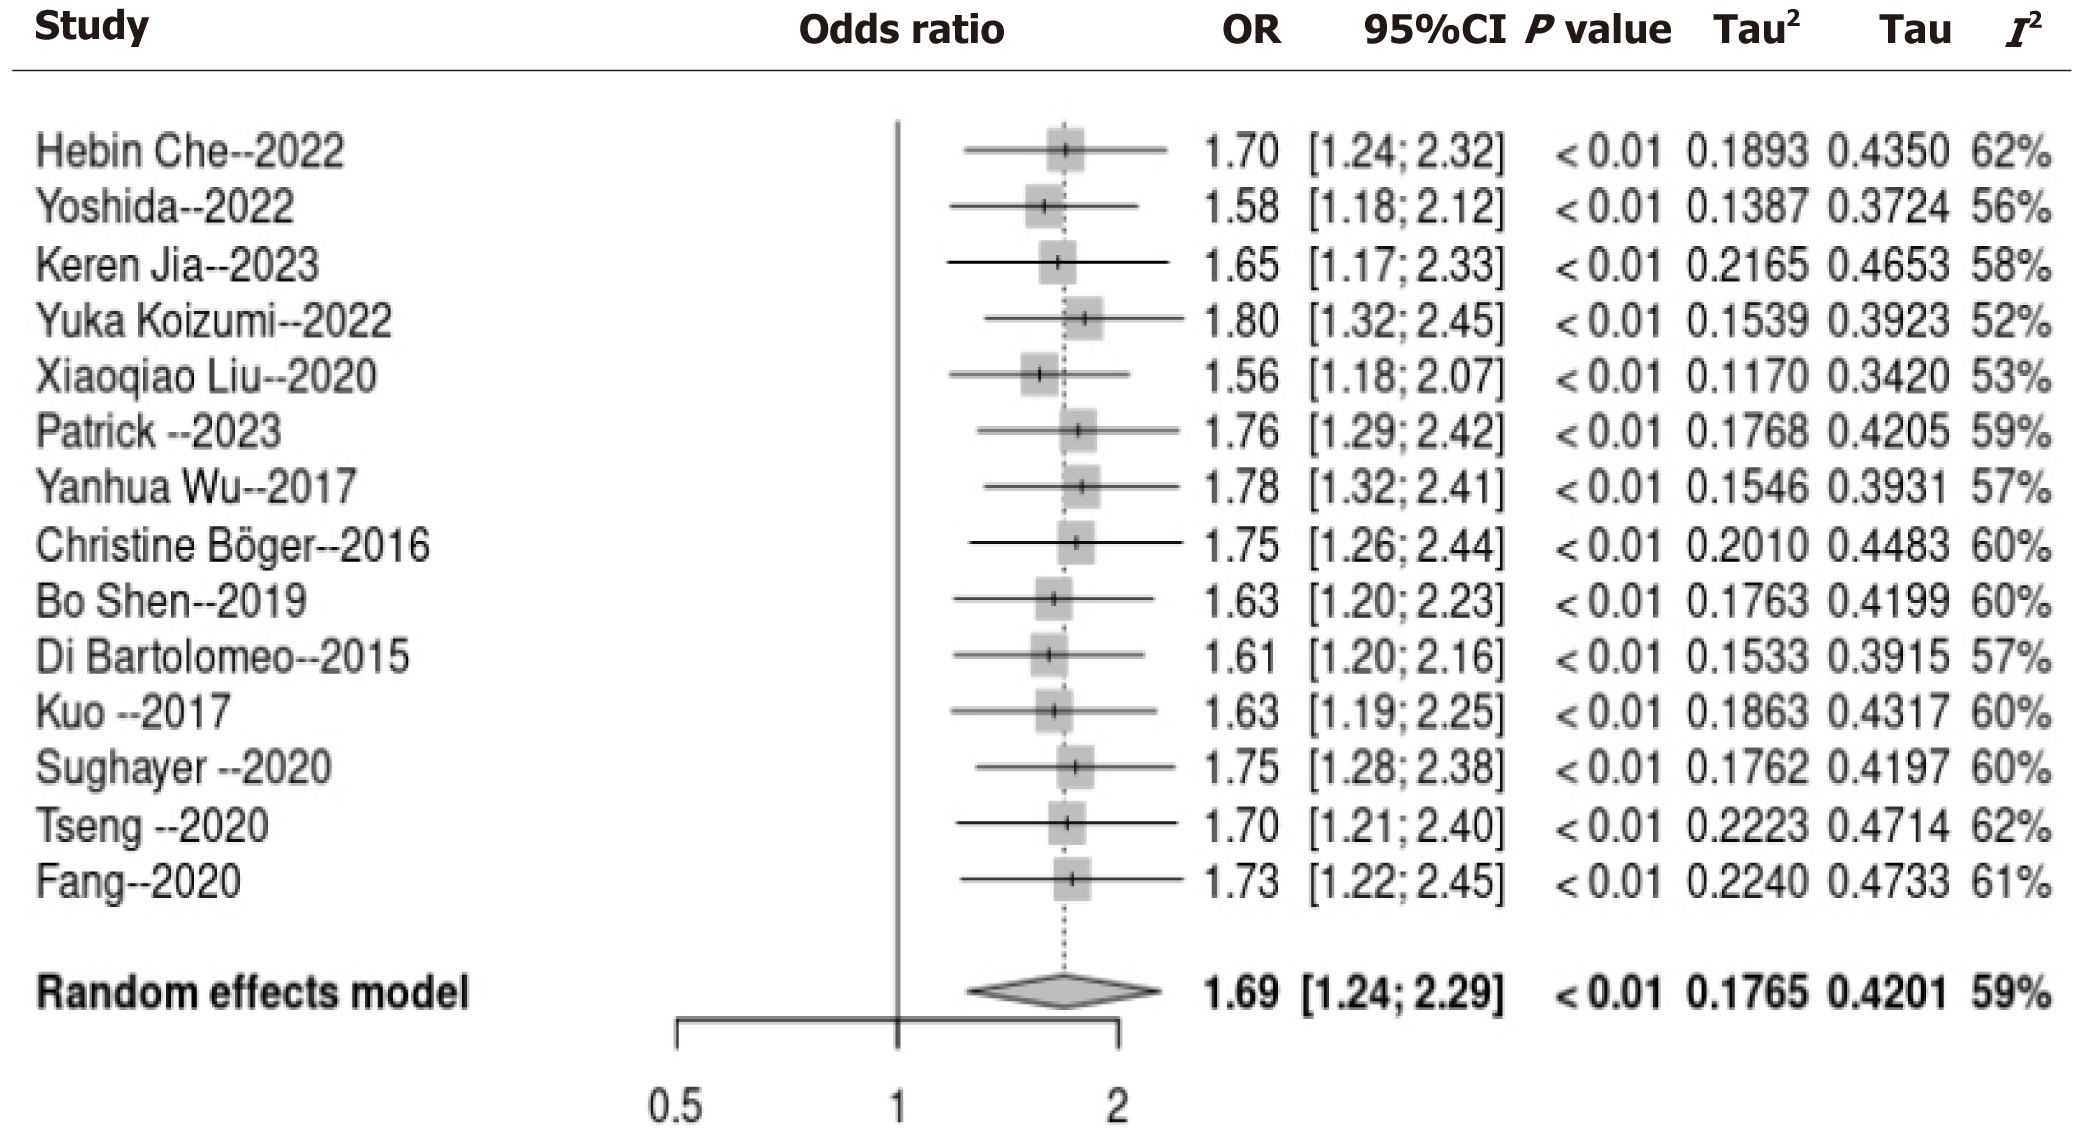
Figure 3 Sensitivity analyses.
CI: Confidence interval; OR: Odds ratio.
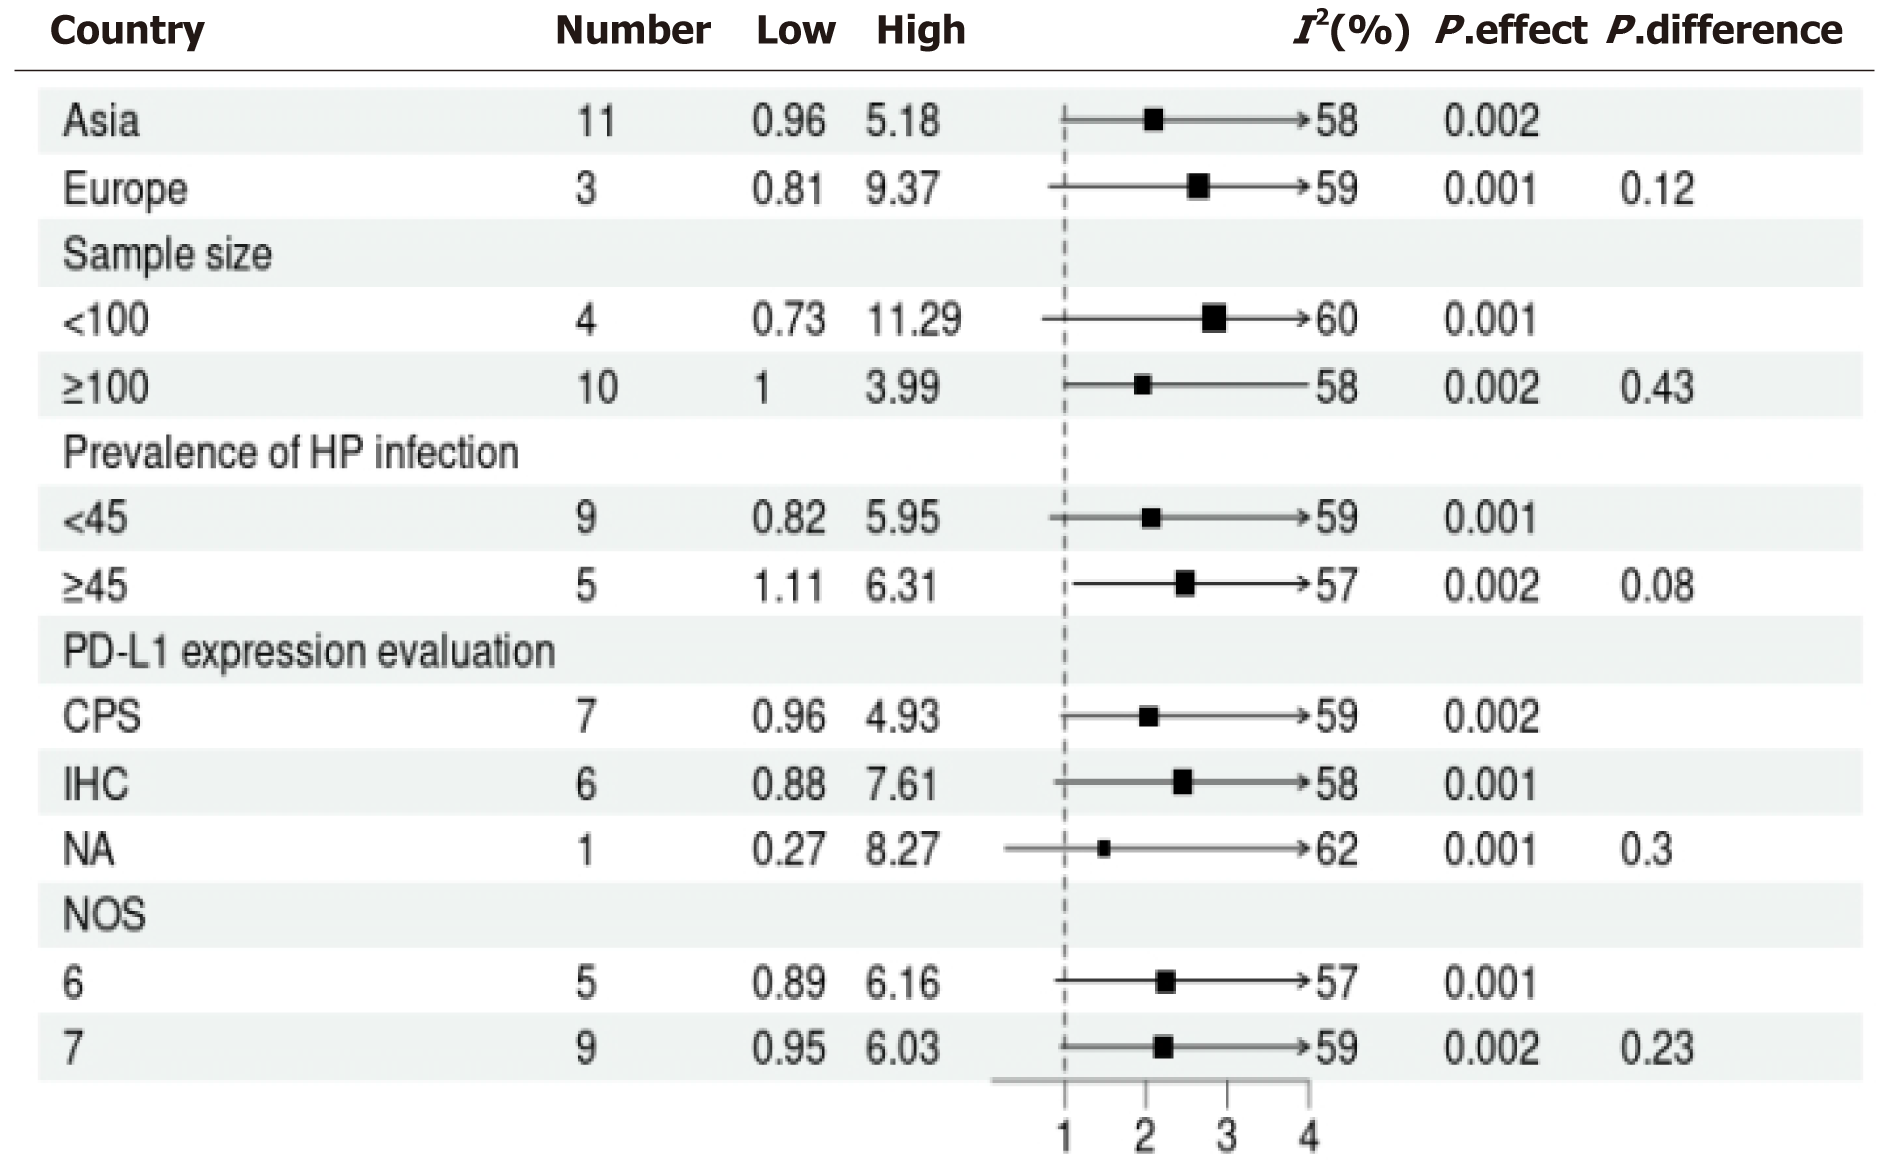
Figure 4 Subgroup analyses.
HP: Helicobacter pylori; PD-L1: Programmed death ligand-1; CPS: Combined positive score; IHC: Immunohistochemistry; NA: Not applicable; NOS: Newcastle-Ottawa scale.
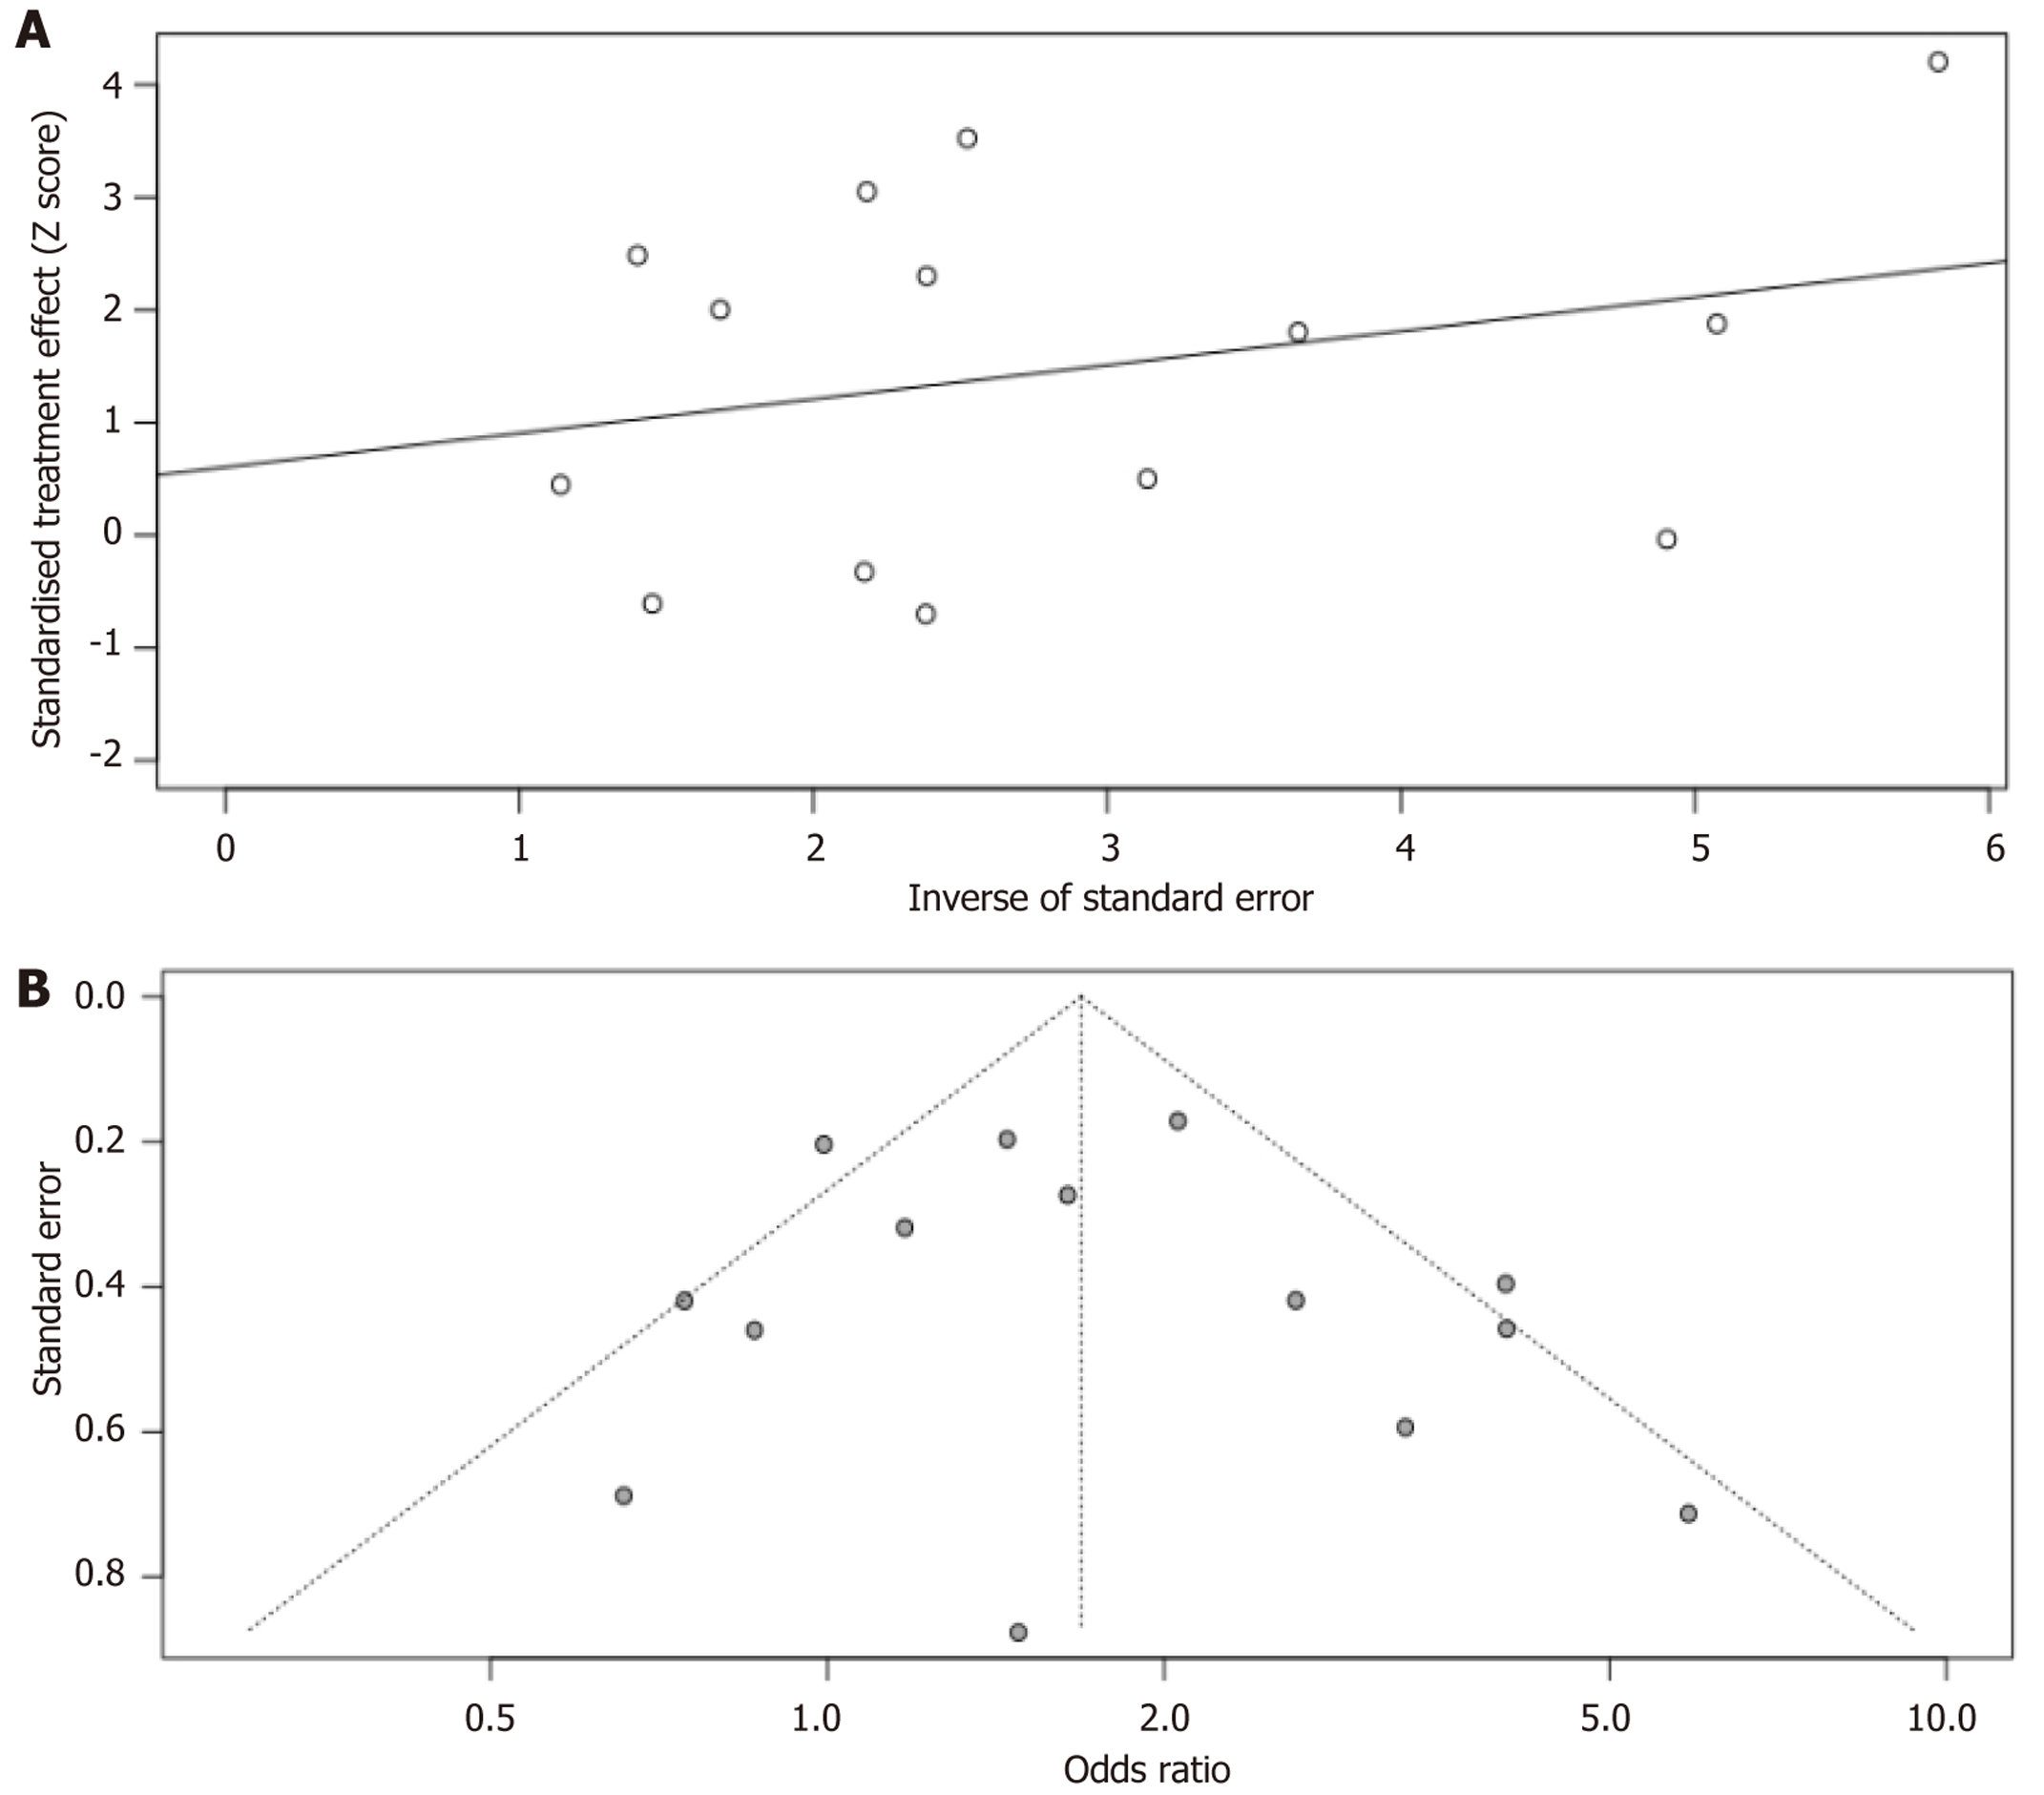
Figure 5 Funnel plot showing a low risk of publication bias.
Egger’s regression test also indicated a low risk of publication bias. A: Egger’s test; B: Funnel plots for the publication bias underlying the meta-analysis.
- Citation: Yang HC, Fu CF, Qiao LJ, Long GH, Yang LF, Yao B. Relationship between Helicobacter pylori infection and programmed death-ligand 1 in gastric cancer: A meta-analysis. World J Clin Oncol 2025; 16(4): 102397
- URL: https://www.wjgnet.com/2218-4333/full/v16/i4/102397.htm
- DOI: https://dx.doi.org/10.5306/wjco.v16.i4.102397


