Copyright
©The Author(s) 2025.
World J Clin Oncol. Feb 24, 2025; 16(2): 95910
Published online Feb 24, 2025. doi: 10.5306/wjco.v16.i2.95910
Published online Feb 24, 2025. doi: 10.5306/wjco.v16.i2.95910
Figure 1 The dynamic nomograms of overall survival and cancer-specific survival.
A: The dynamic nomogram of overall survival; B: The dynamic nomogram of cancer-specific survival. CSS: Cancer-specific survival; LNR: Lymph node ratio (refers to the ratio of regional nodes that were positive vs those examined); OS: Overall survival; SEER: Surveillance, epidemiology, and end results.
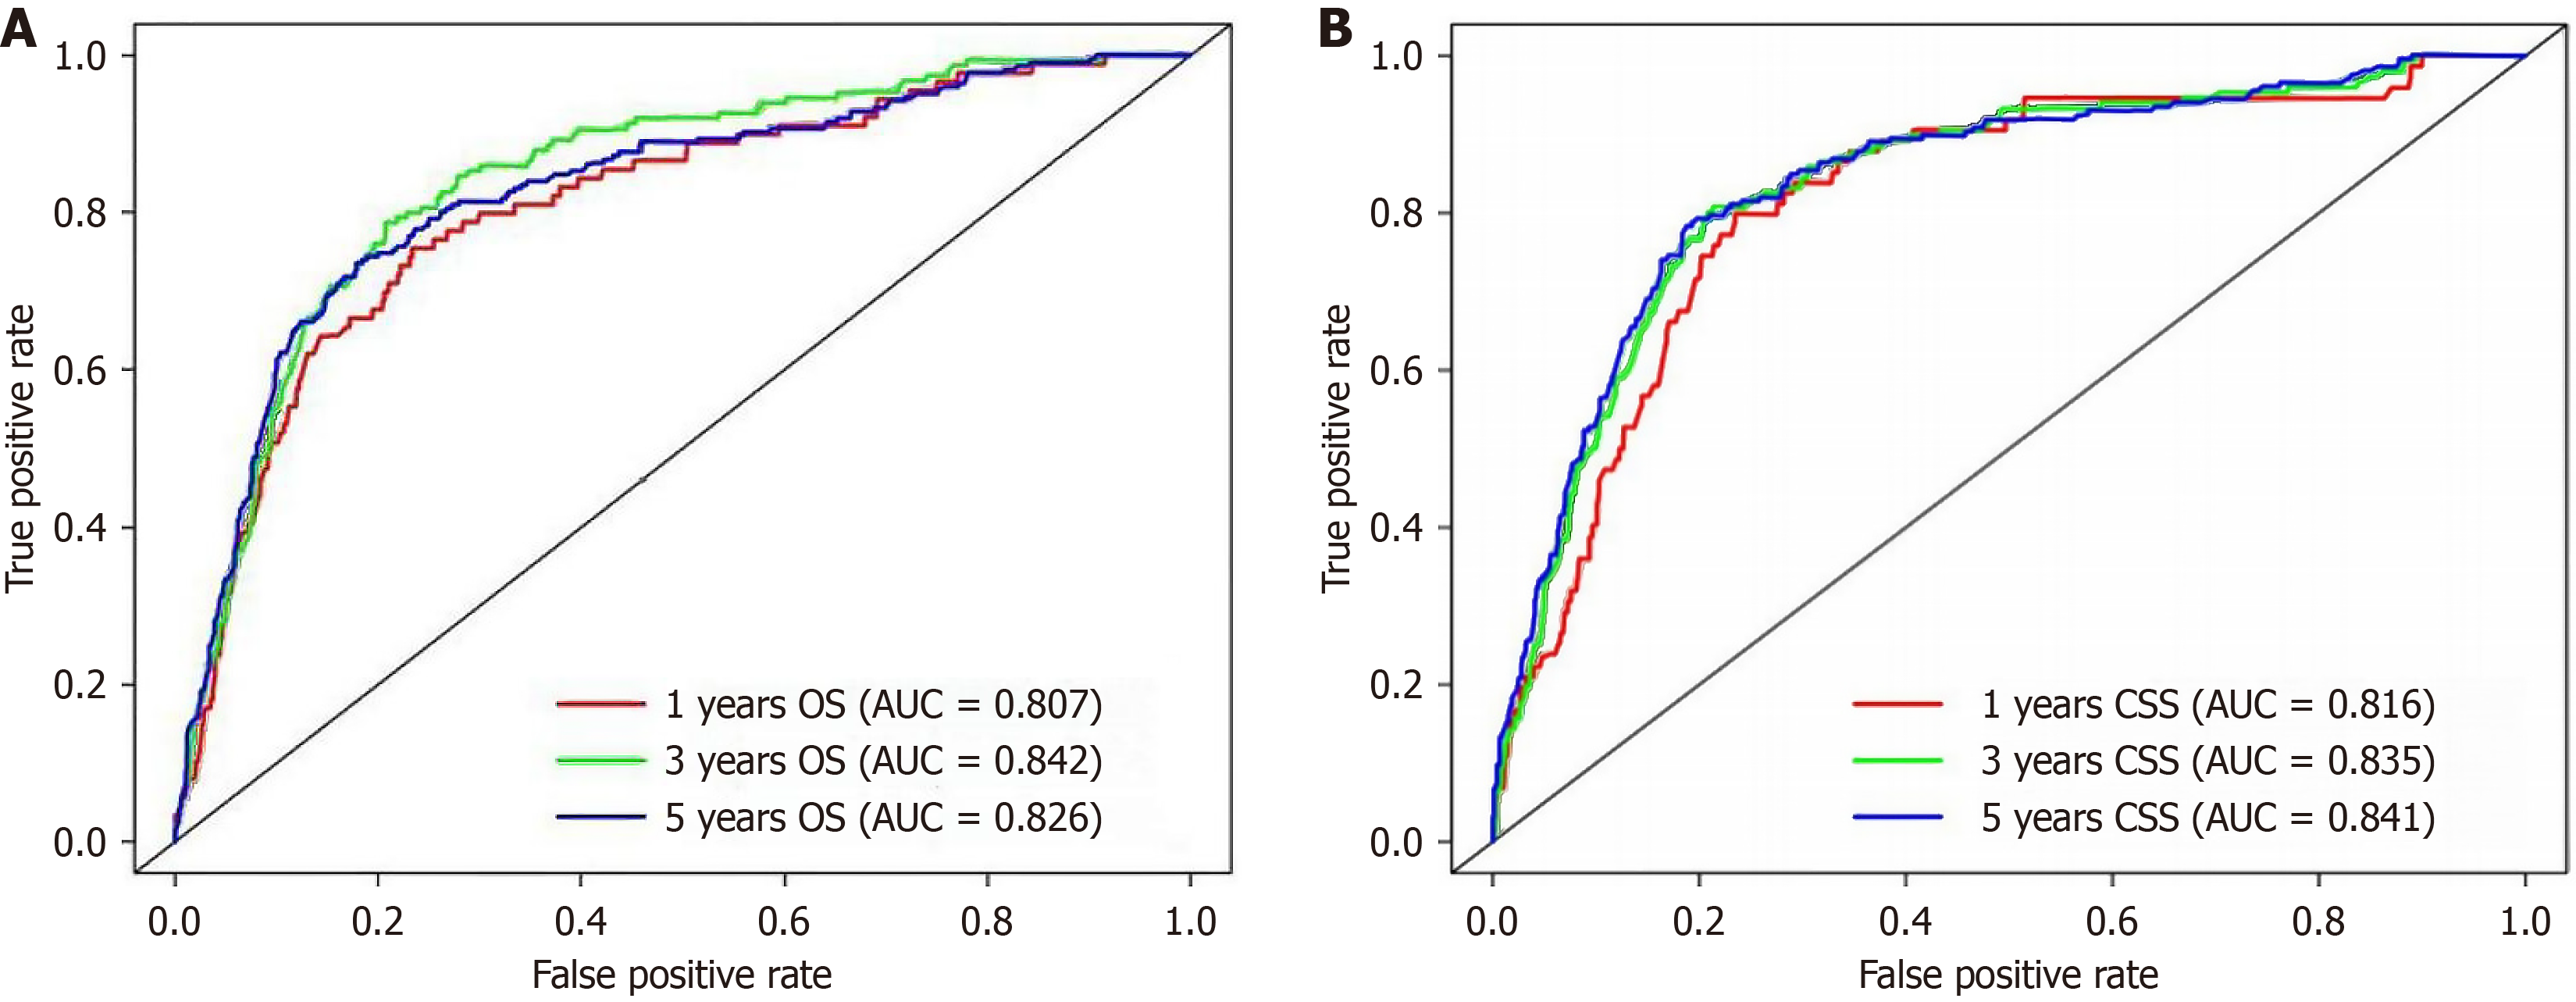
Figure 2 Receiver operating characteristic curves and respective areas of the prognostic model for 1-, 3-, and 5-year.
A: Overall survival in the surveillance, epidemiology, and end results training cohort; B: Cancer-specific survival in the surveillance, epidemiology, and end results training cohort. AUC: Area under the curve; OS: Overall survival; CSS: Cancer-specific survival.
Figure 3 Calibration curves of the prognostic model for 1-, 3-, and 5-year overall survival and cancer-specific survival in the surveillance, epidemiology, and end results training cohort.
A-C: Calibration curves of the prognostic model for 1-, 3-, and 5-year overall survival in the surveillance, epidemiology, and end results training cohort; D-F: Calibration curves of the prognostic model for 1-, 3-, and 5-year cancer-specific survival in the surveillance, epidemiology, and end results training cohort. OS: Overall survival; CSS: Cancer-specific survival.
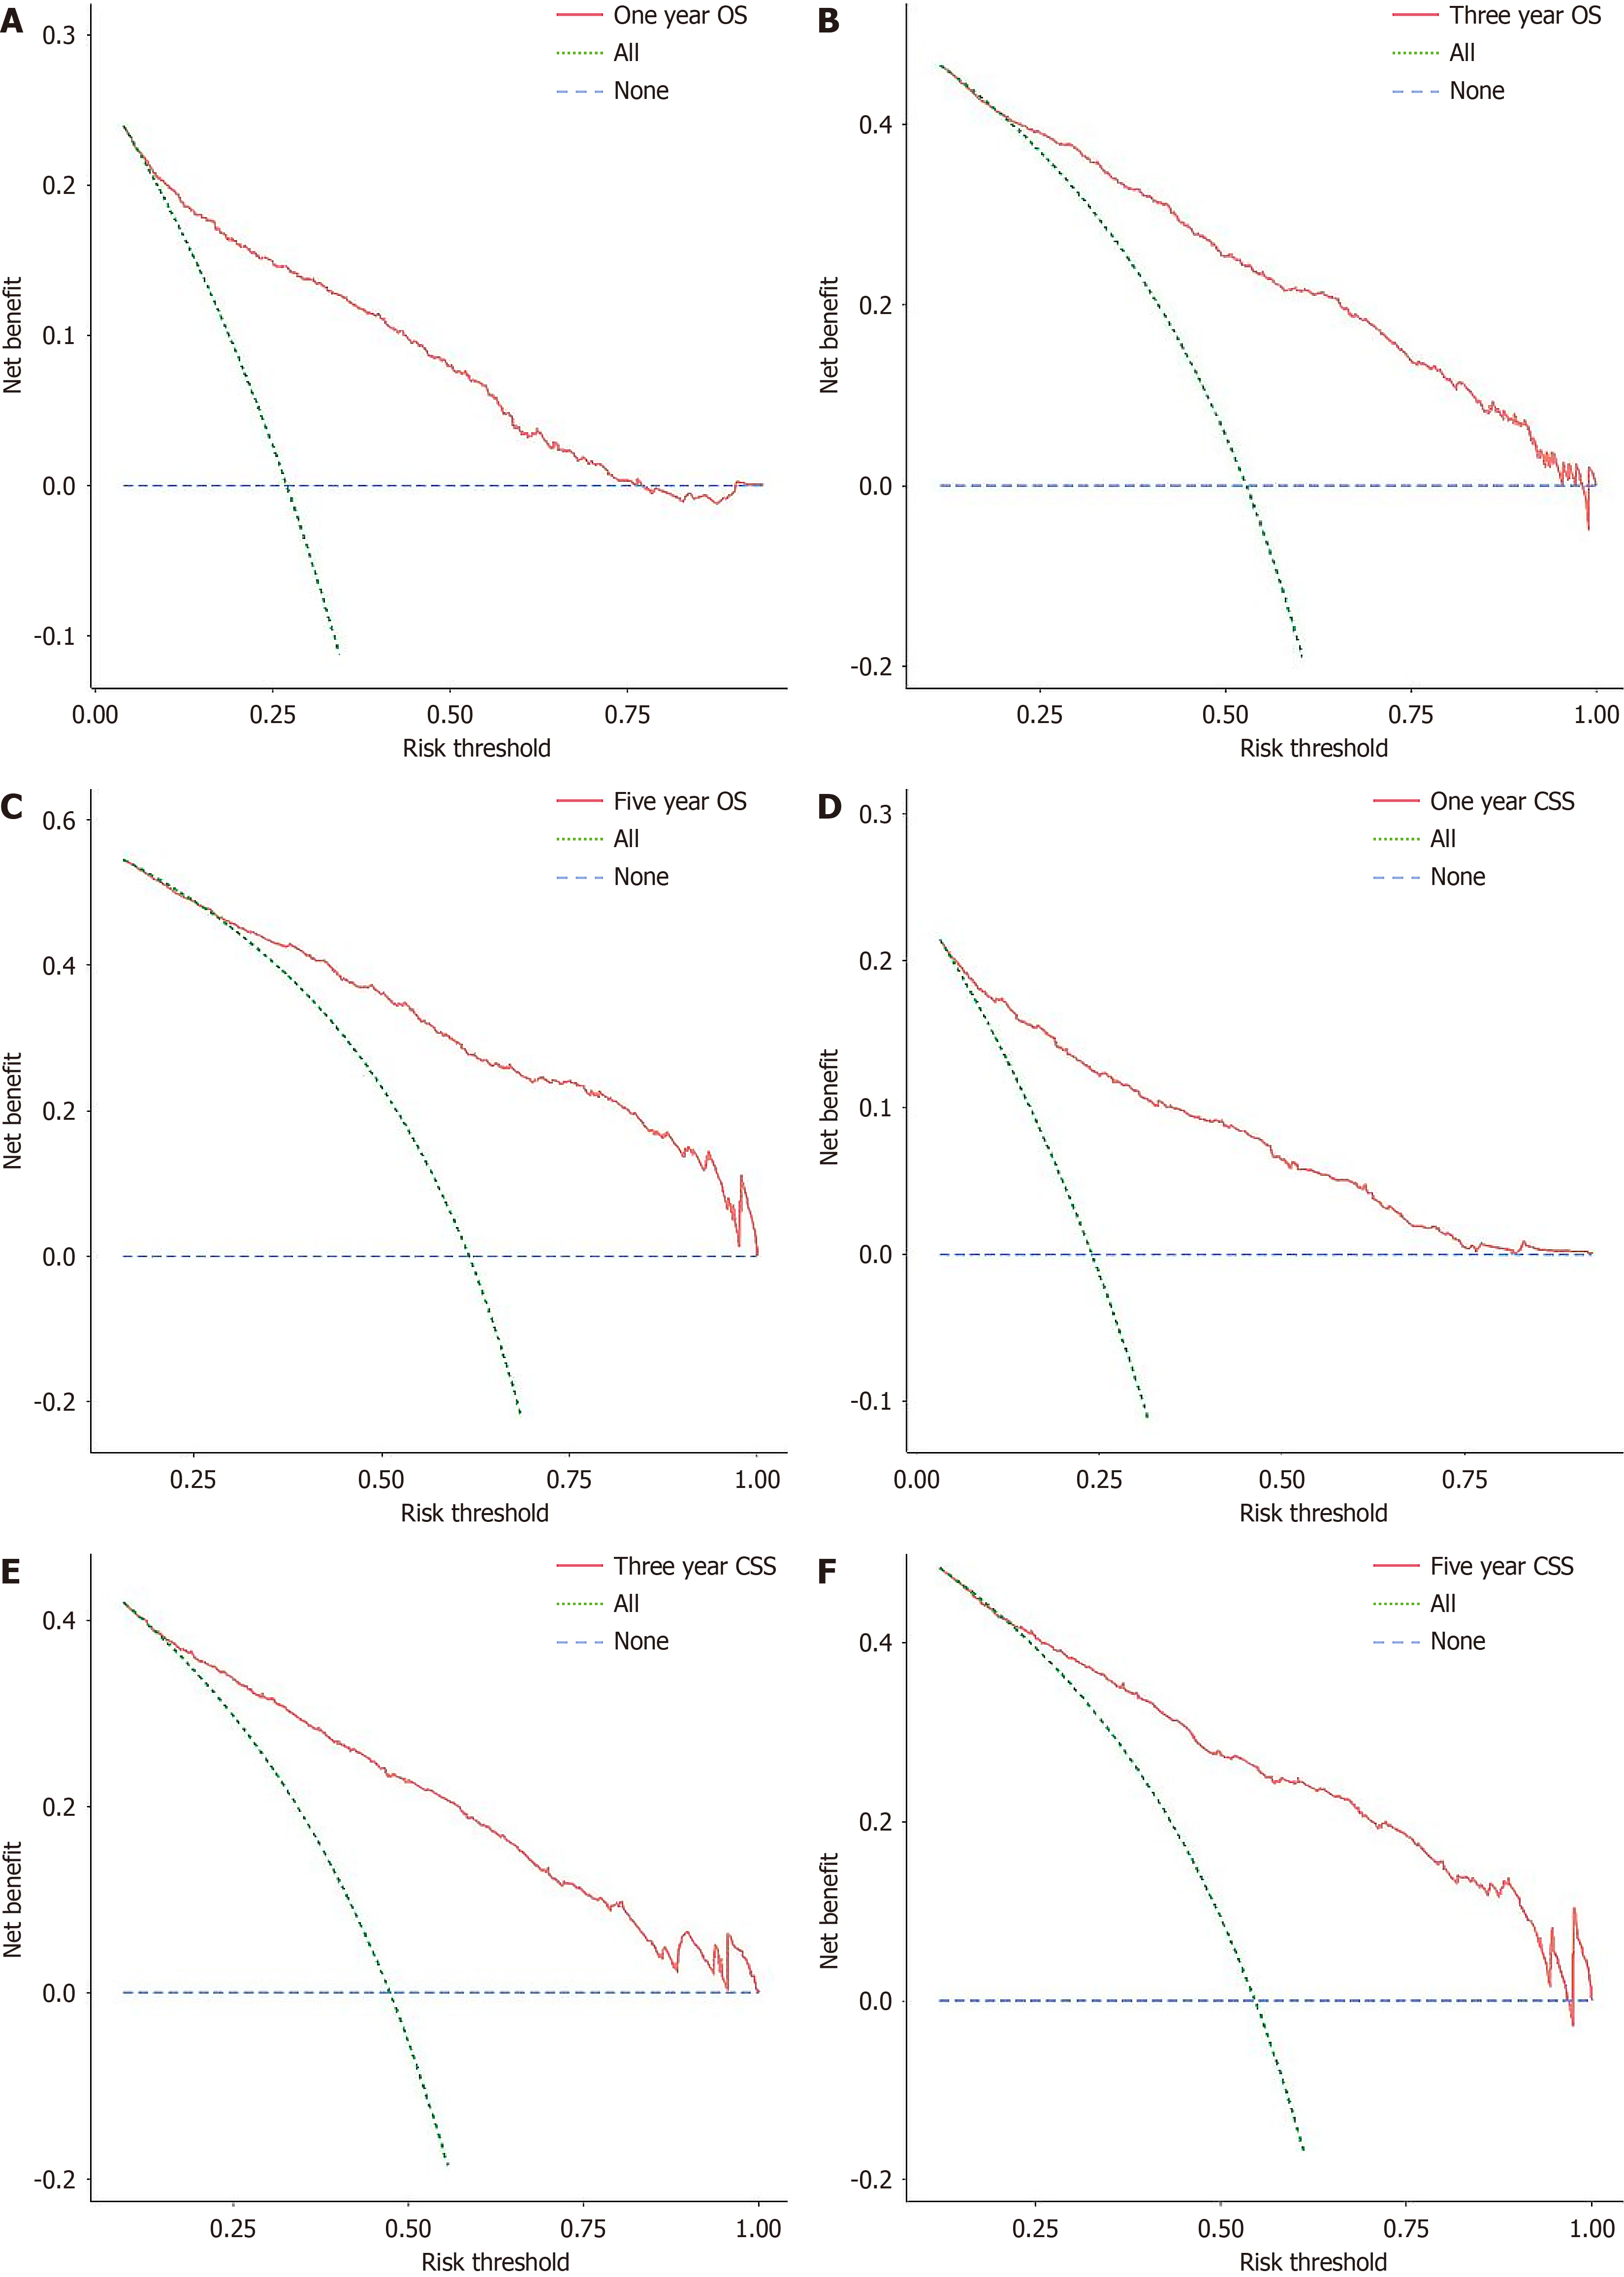
Figure 4 Clinical decision curves of the prognostic model for 1-, 3-, and 5-year overall survival and cancer-specific survival in the surveillance, epidemiology, and end results training cohort.
A-C: Clinical decision curves of the prognostic model for 1-, 3-, and 5-year overall survival in the surveillance, epidemiology, and end results training cohort; D-F: Clinical decision curves of the prognostic model for 1-, 3-, and 5-year cancer-specific survival in the surveillance, epidemiology, and end results training cohort. OS: Overall survival; CSS: Cancer-specific survival.
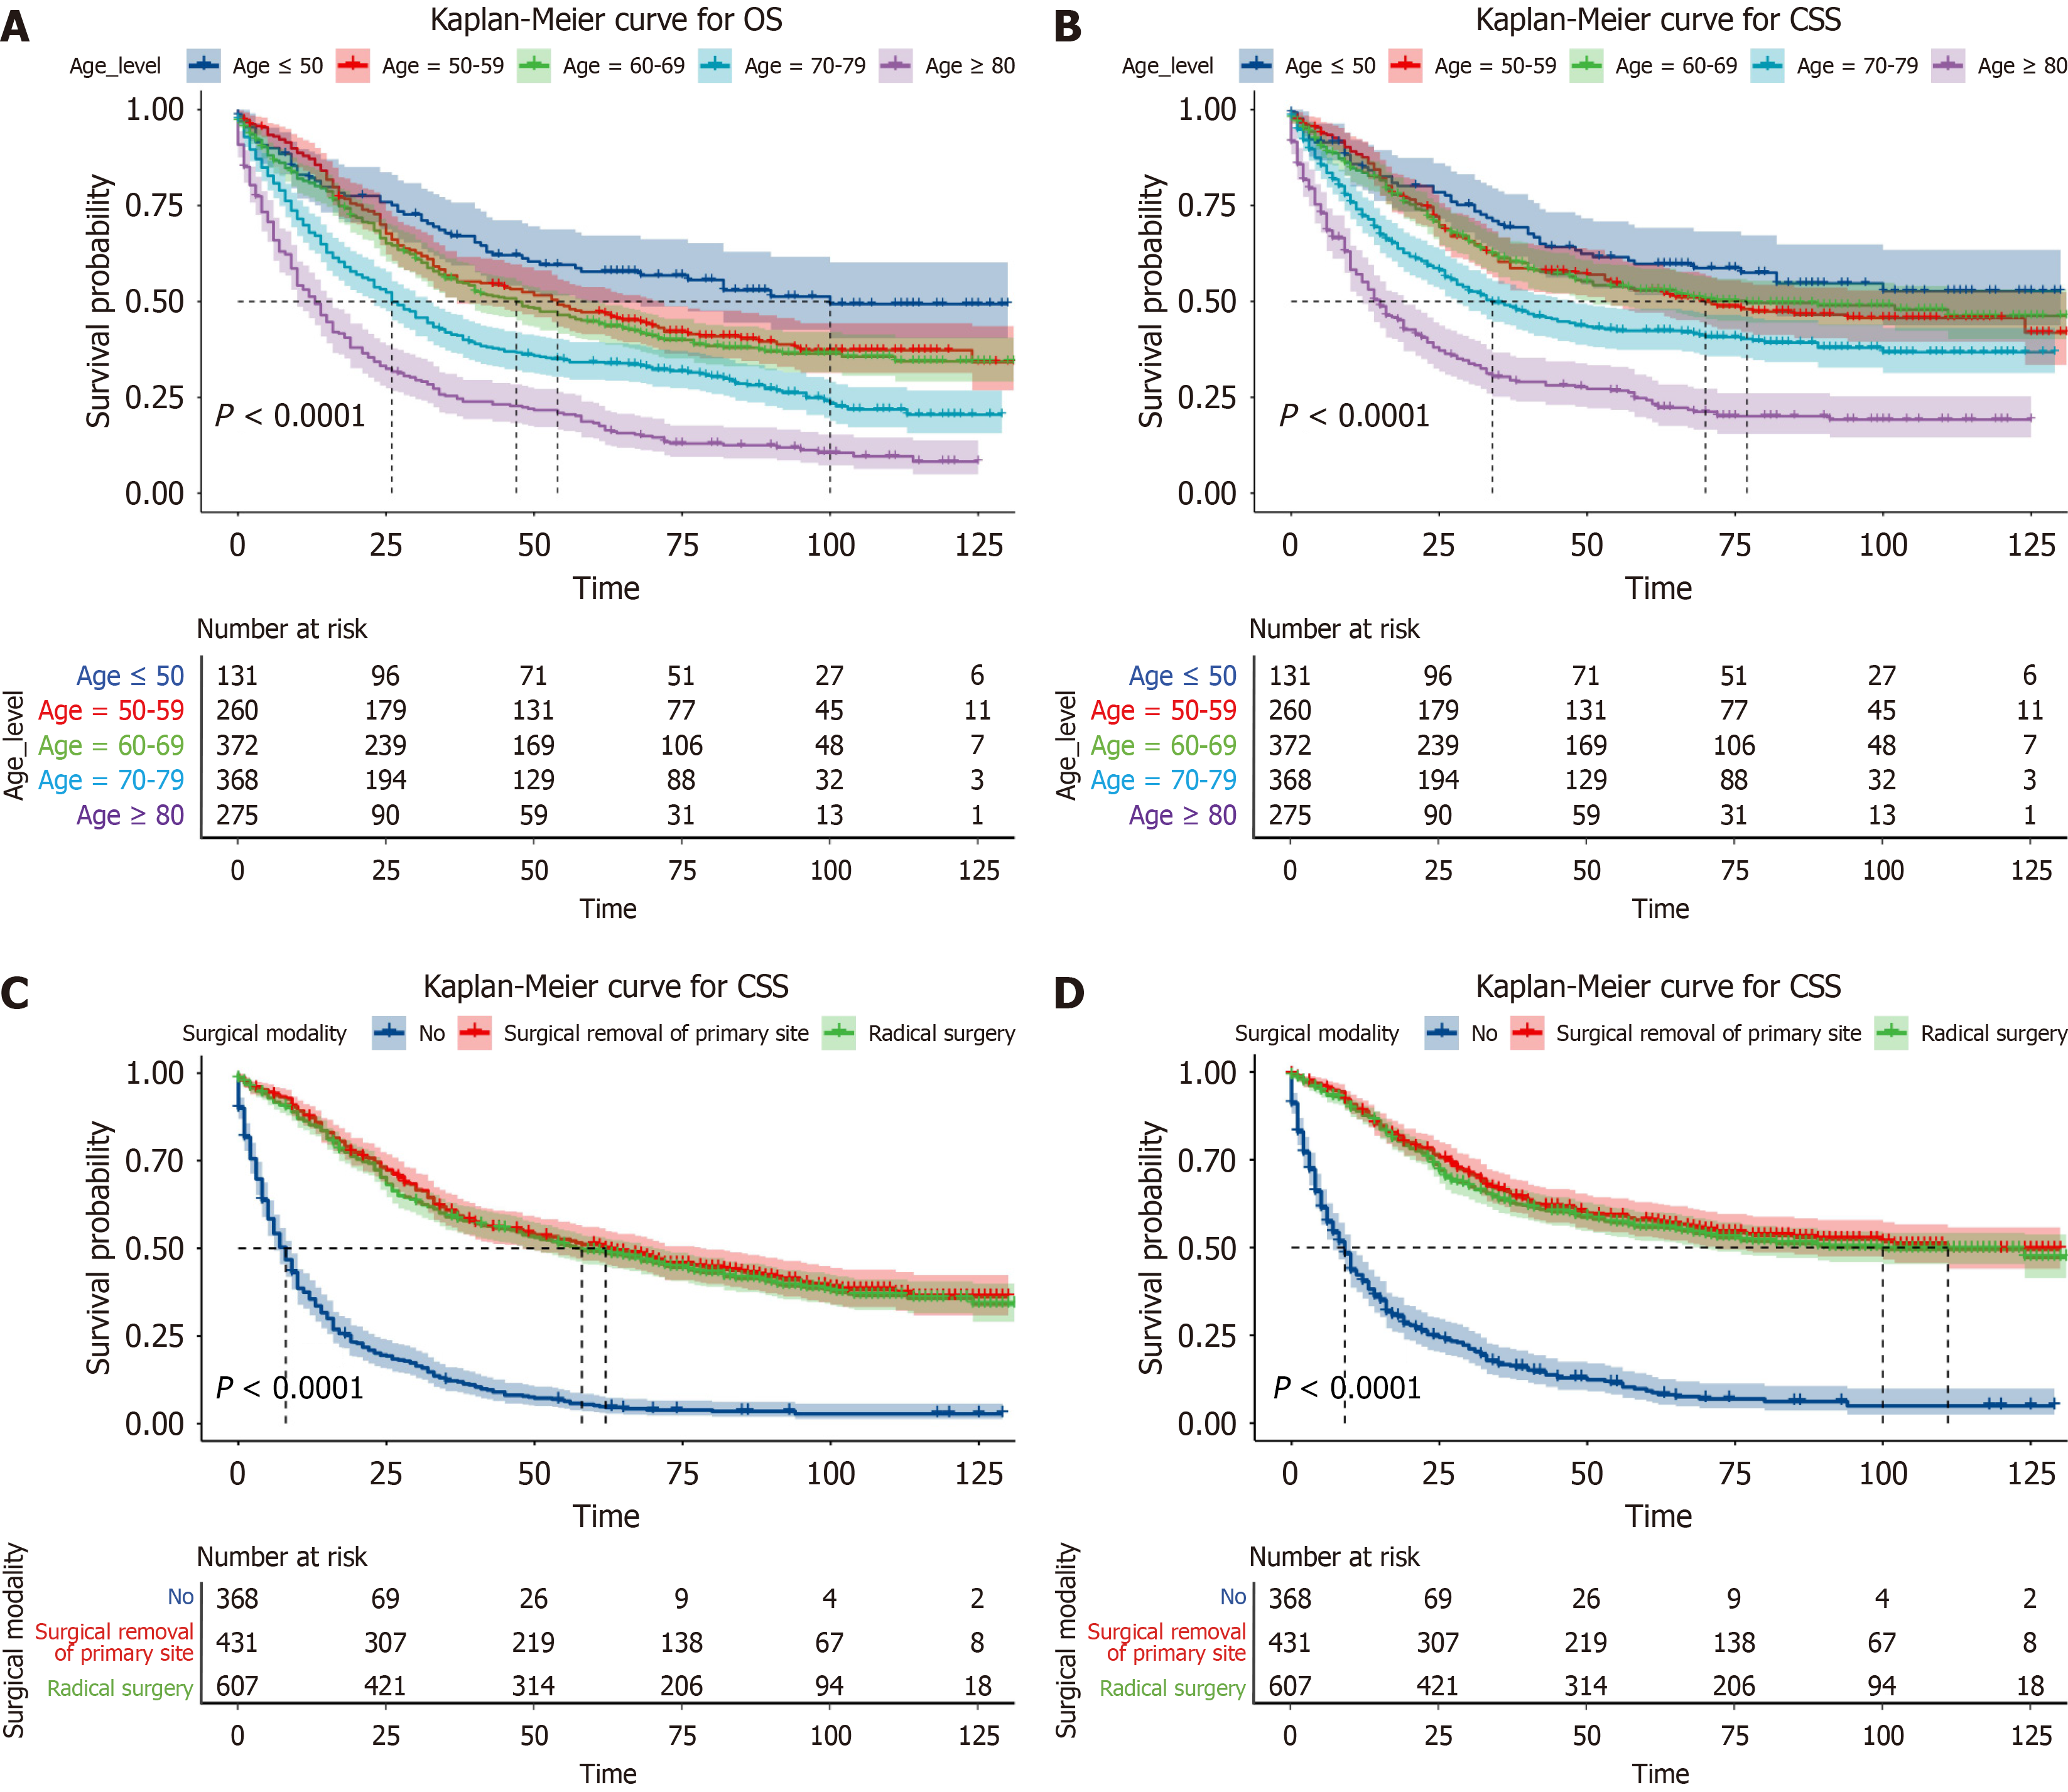
Figure 5 Kaplan-Meyer survival curve stratified by age and surgical modality.
A and B: Kaplan-Meyer survival curve stratified by age; C and D: Kaplan-Meyer survival curve stratified by surgical modality. OS: Overall survival; CSS: Cancer-specific survival.
- Citation: Yang J, Wang ZY, Chen J, Zhang Y, Chen L. Nomogram for overall survival in ampullary adenocarcinoma using the surveillance, epidemiology, and end results database and external validation. World J Clin Oncol 2025; 16(2): 95910
- URL: https://www.wjgnet.com/2218-4333/full/v16/i2/95910.htm
- DOI: https://dx.doi.org/10.5306/wjco.v16.i2.95910


