Copyright
©The Author(s) 2024.
World J Clin Oncol. Jan 24, 2024; 15(1): 62-88
Published online Jan 24, 2024. doi: 10.5306/wjco.v15.i1.62
Published online Jan 24, 2024. doi: 10.5306/wjco.v15.i1.62
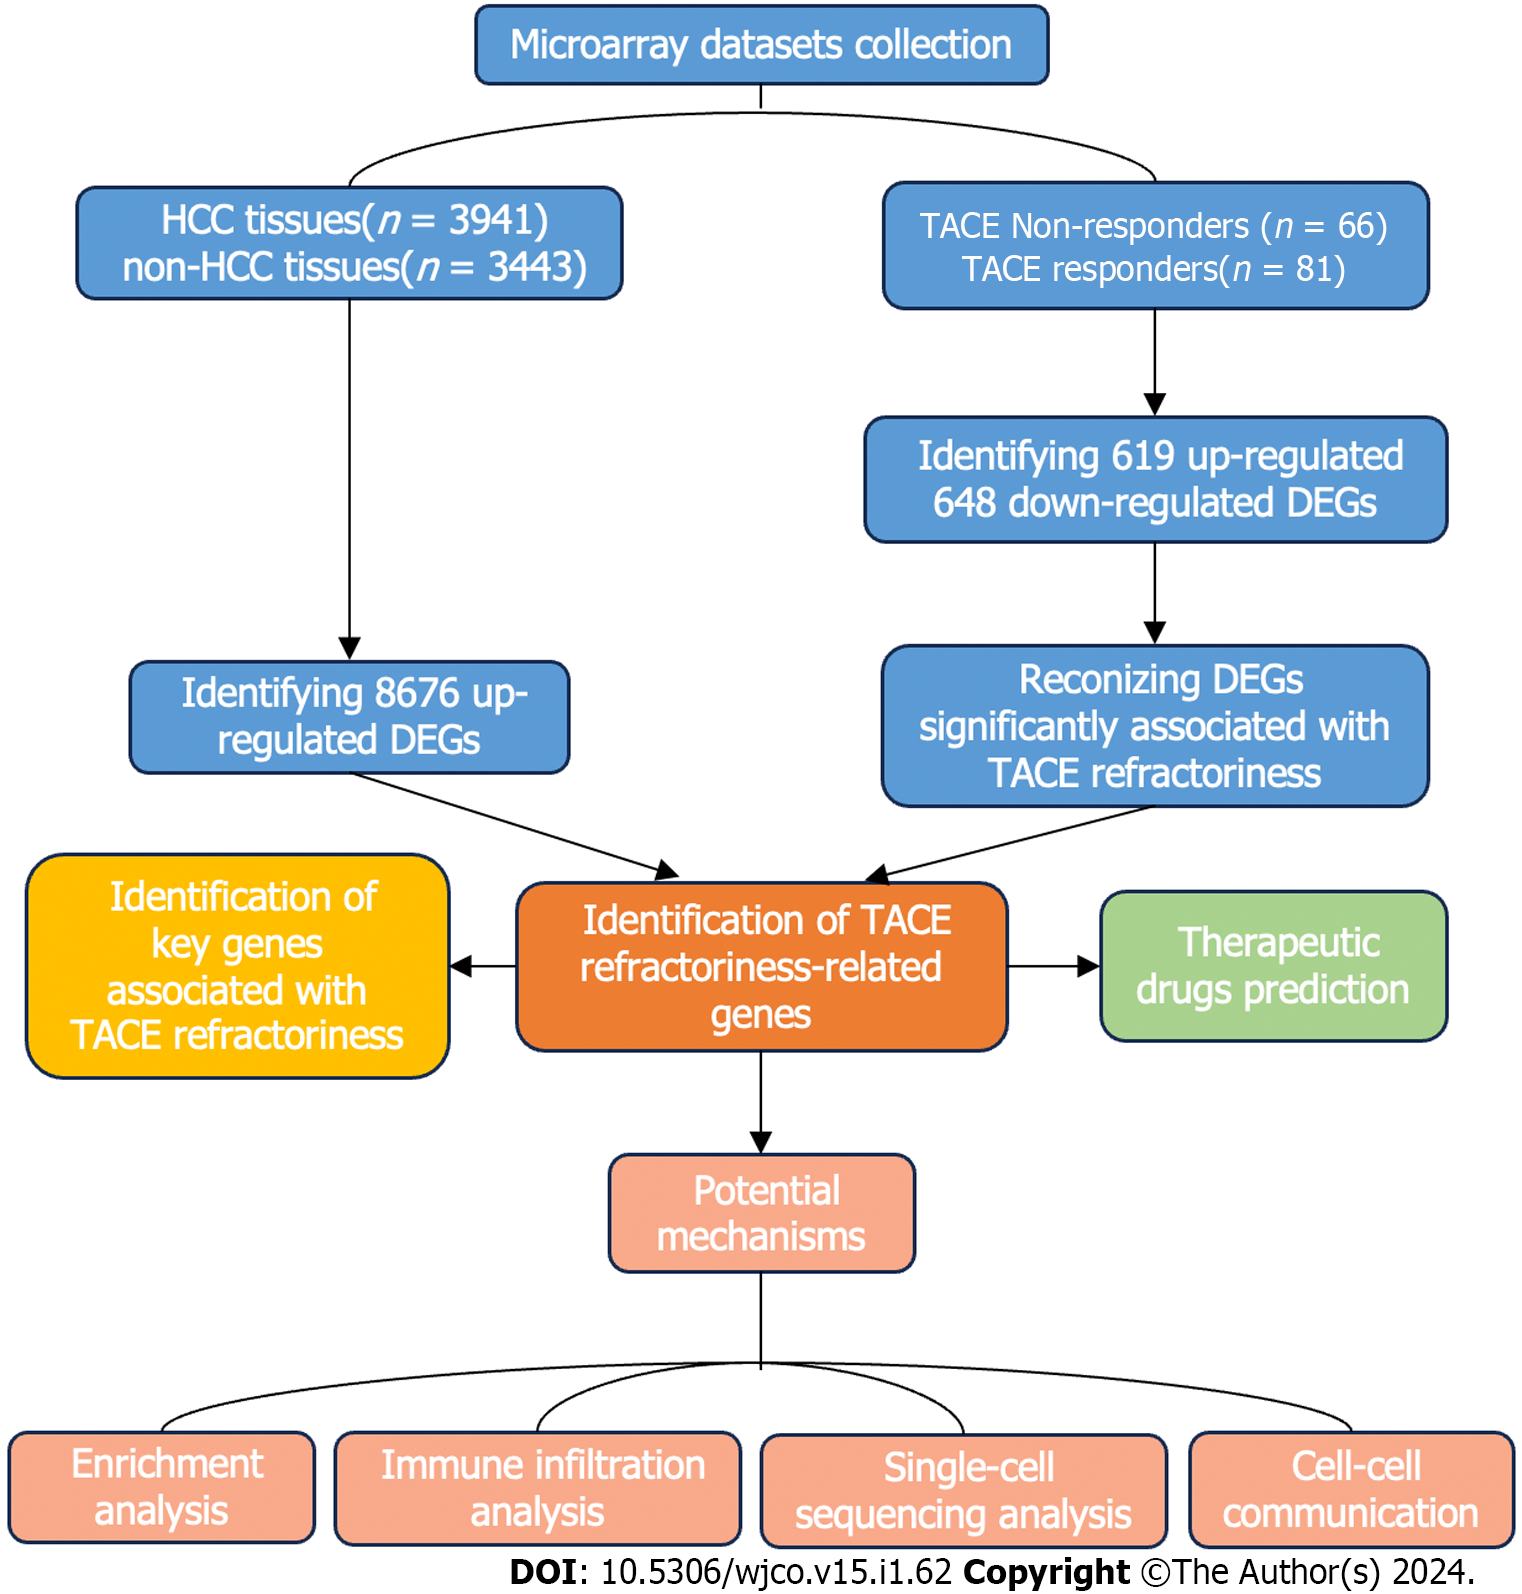
Figure 1 The flow chart of the present study.
HCC: Hepatocellular carcinoma; DEGs: Differentially expressed genes; TACE: Transcatheter arterial chemoembolisation; WGCNA analysis: Weighted gene co-expression network analysis.
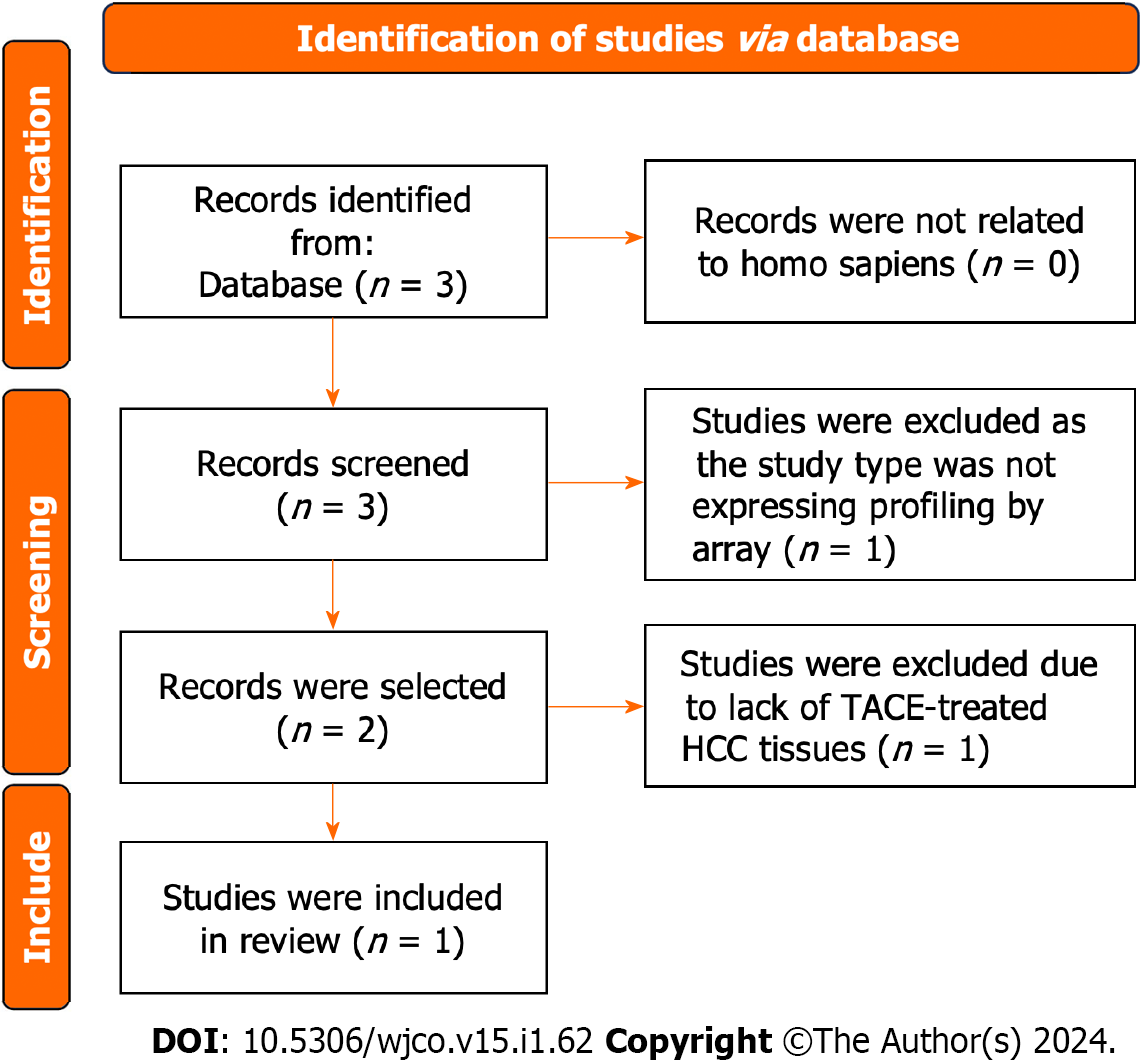
Figure 2 Flow chart showing the collection of the transcatheter arterial embolisation-treated hepatocellular carcinoma samples.
Finally, one study was included. HCC: Hepatocellular carcinoma; TACE: Transcatheter arterial chemoembolization.
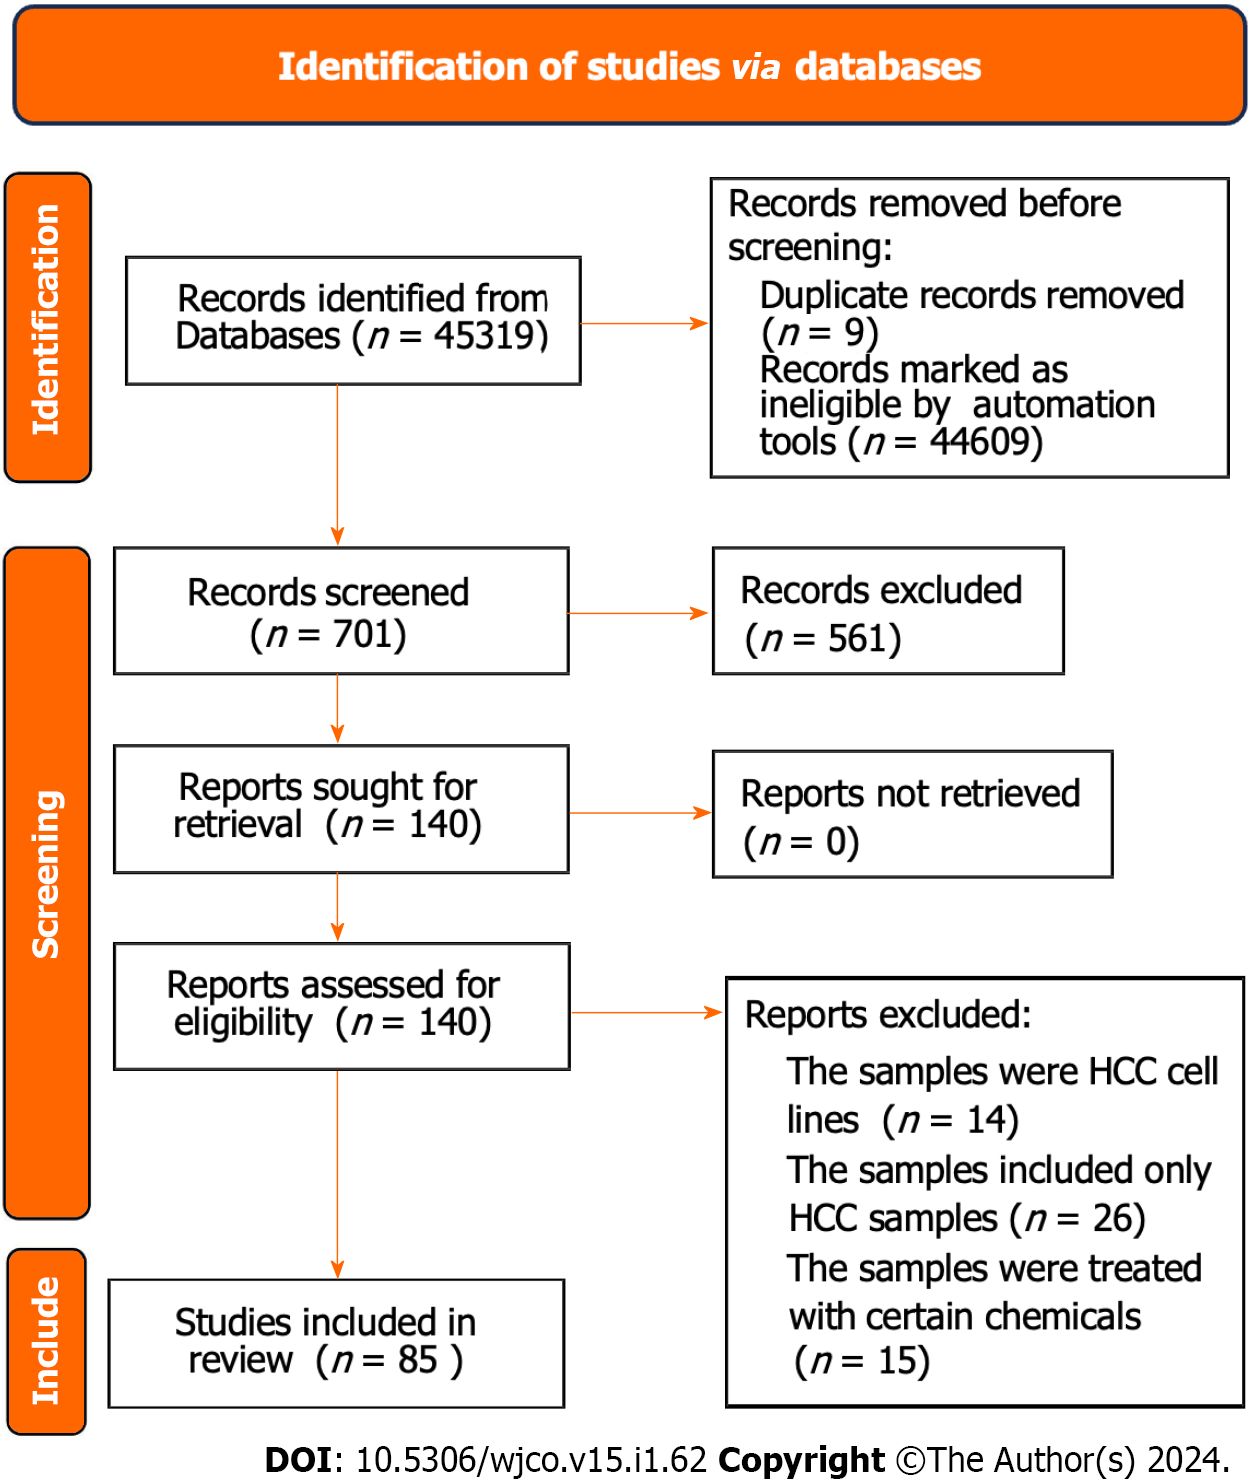
Figure 3 Flow chart of the acquisition of hepatocellular carcinoma and non- hepatocellular carcinoma samples via database.
The information from 85 studies is displayed in Supplementary Table 1. HCC: Hepatocellular carcinoma.
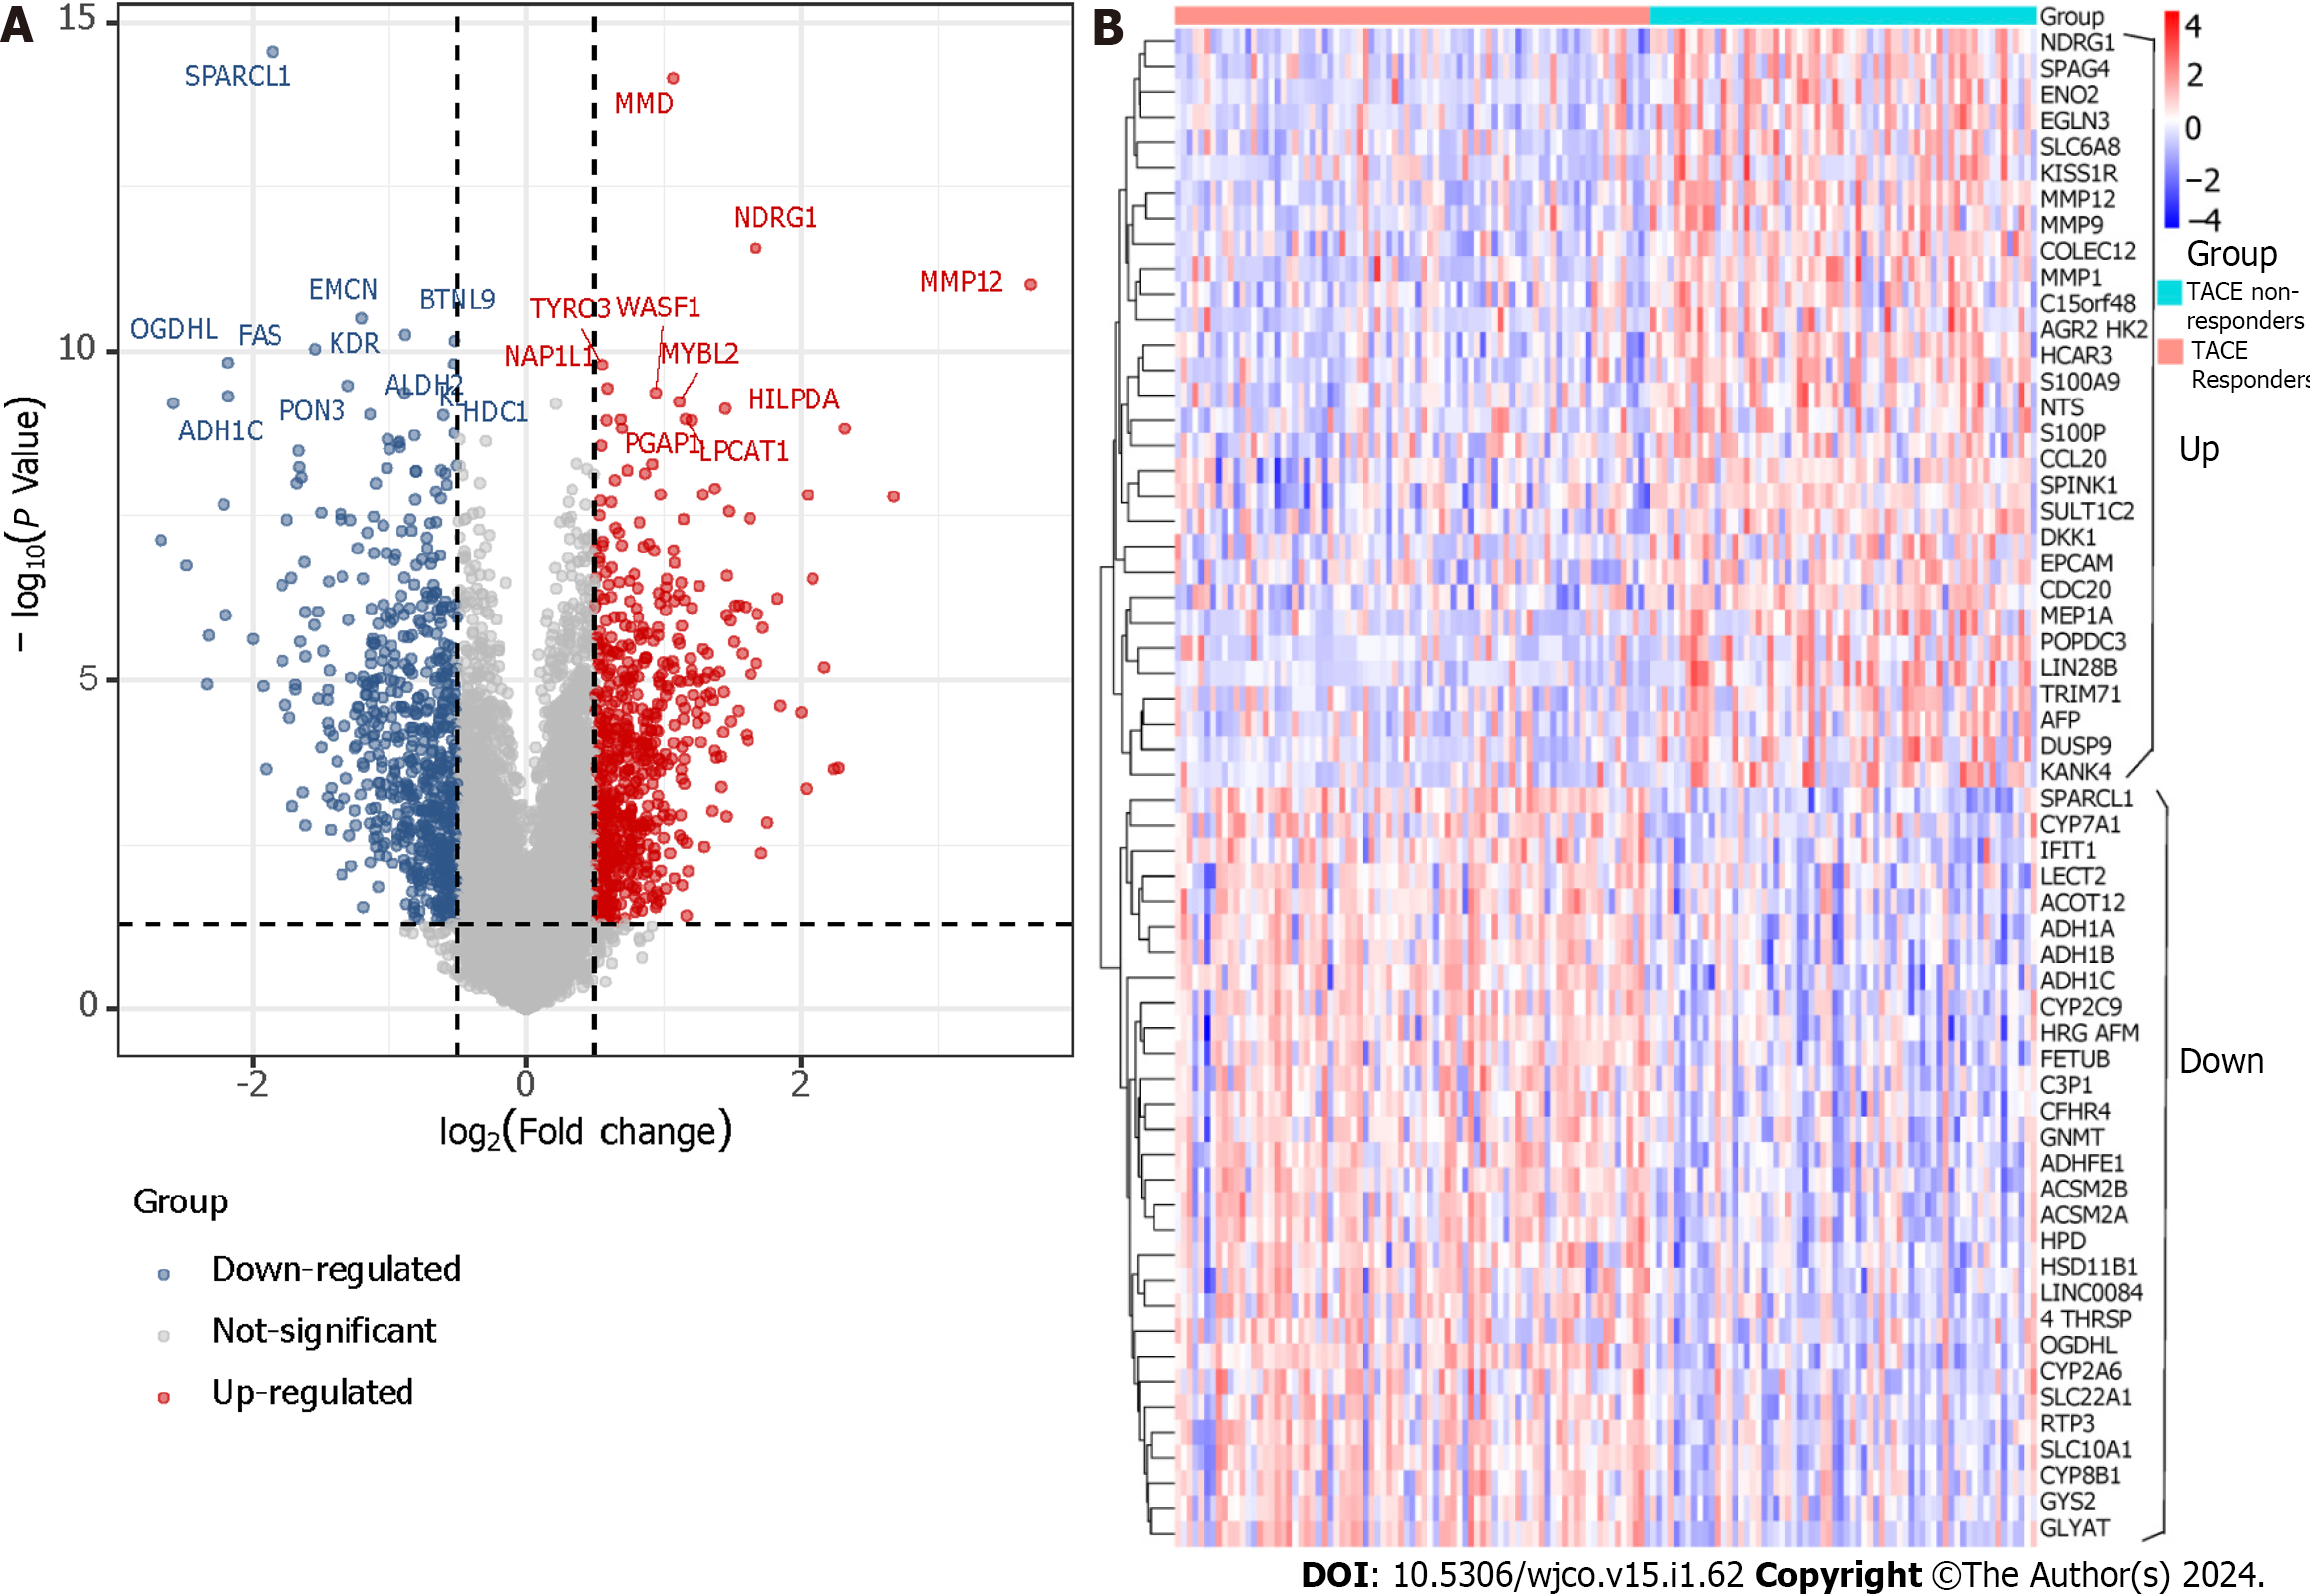
Figure 4 Differentially expressed genes screening.
A: The screening of differentially expressed genes (DEGs) between transcatheter arterial embolisation (TACE) non-responders and TACE responders (TACE-associated DEGs) in GSE104580. B: The expression level of the top-30 up-regulated and down-regulated TACE-associated DEGs.
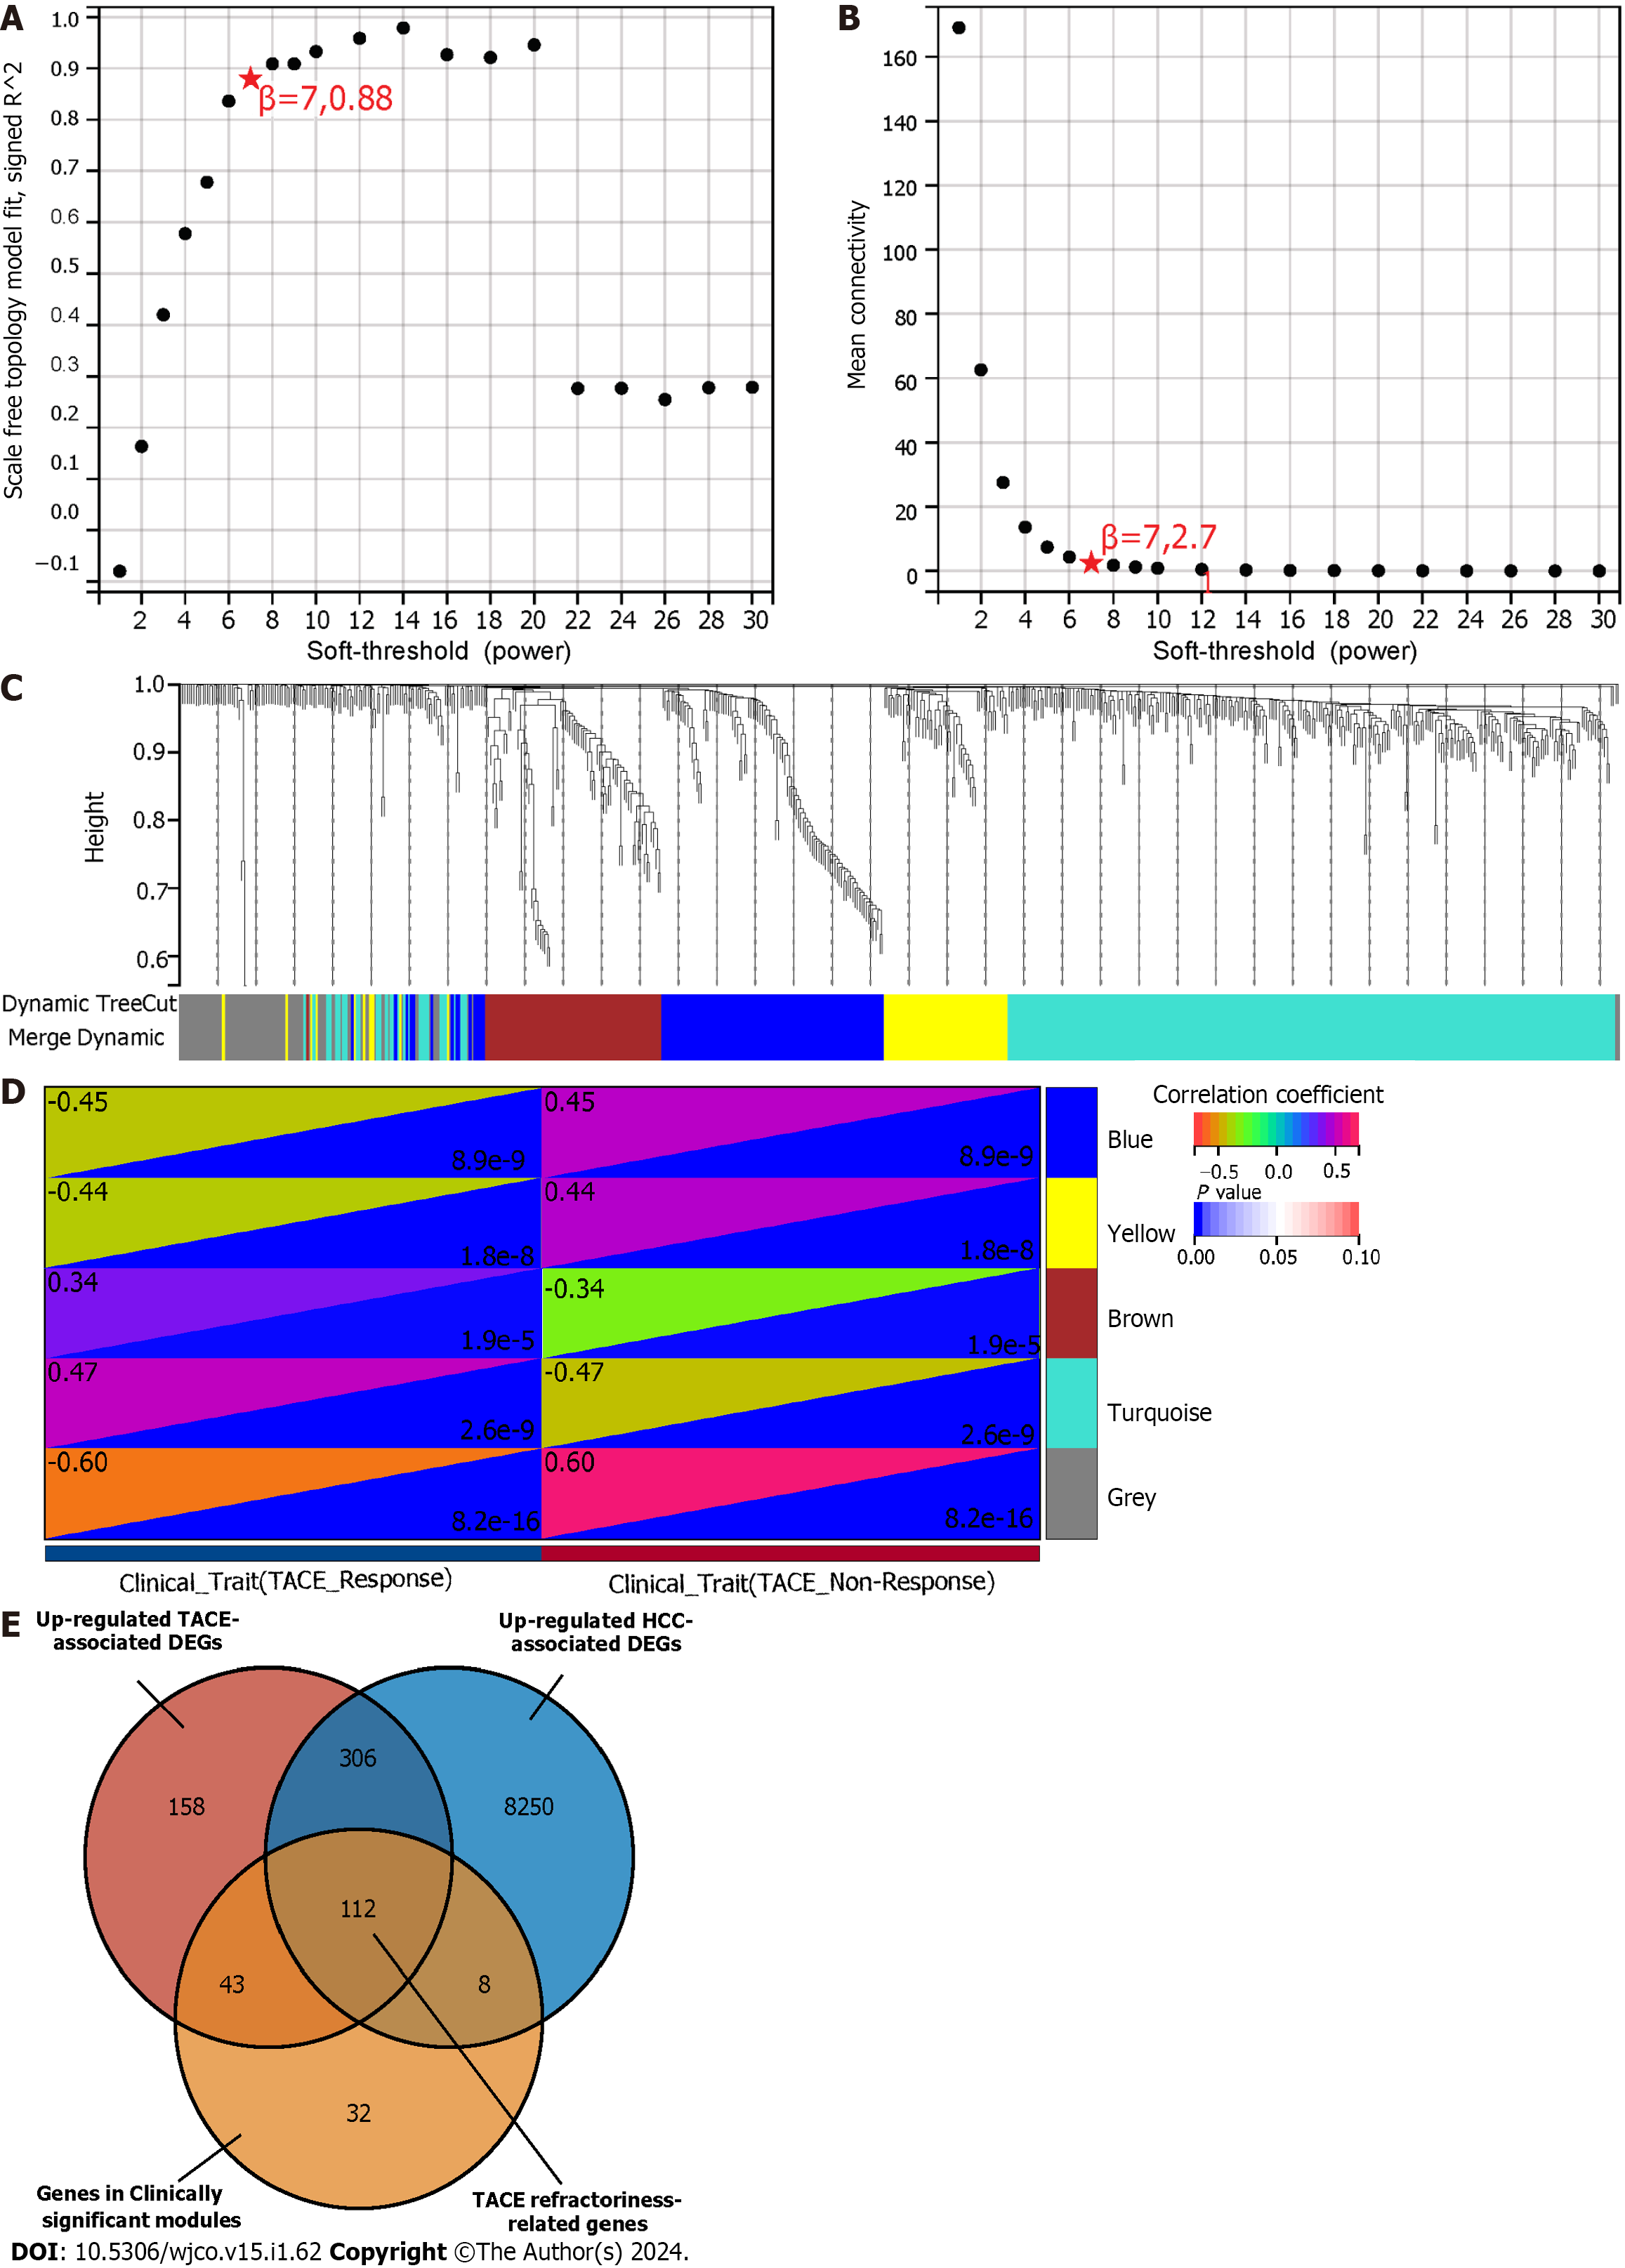
Figure 5 Weighted gene co-expression network analysis and identification of transcatheter arterial embolisation refractoriness-related genes.
A: The scale-free index for various soft-threshold powers; B: Analysis of the mean connectivity for various soft-threshold powers; C: Gene clustering dendrogram, with dissimilarity based on topological overlap, together with assigned module colours; D: Module-trait association. Blue and grey modules were identified as the clinically significant modules due to their highest coefficient correlations; E: The identification of 112 TACE refractoriness-associated genes. TACE: Transcatheter arterial embolisation.
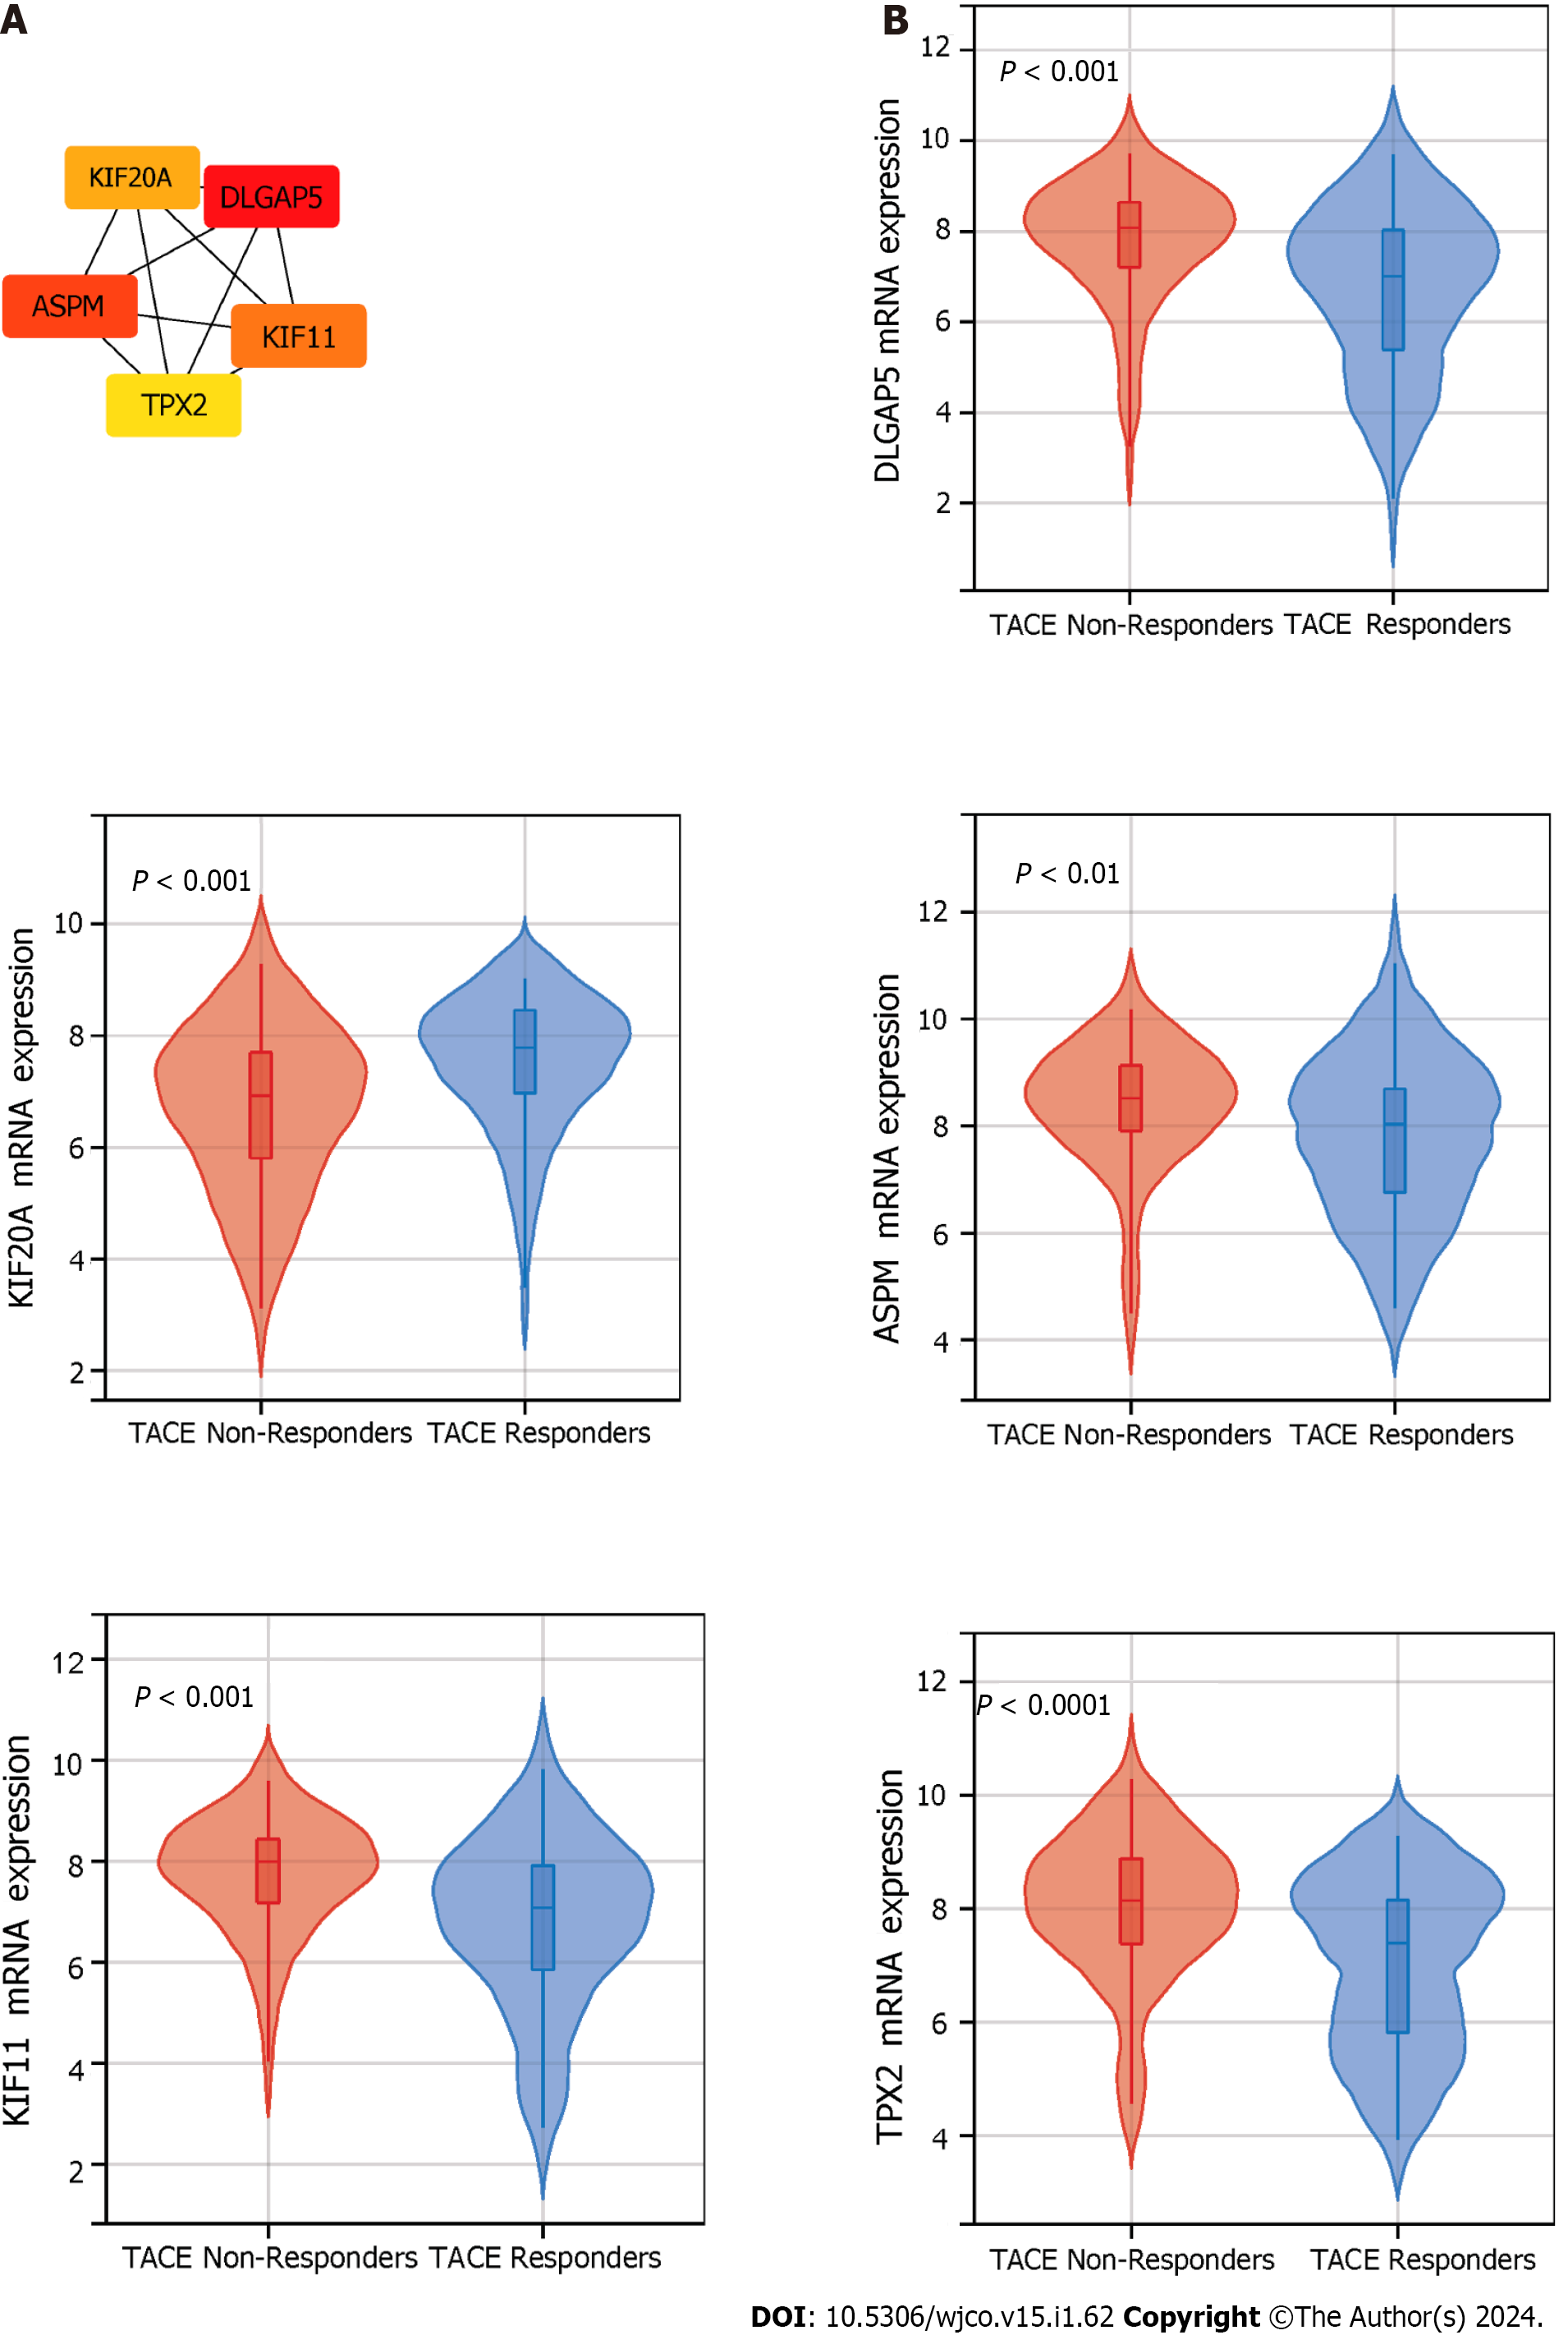
Figure 6 The identification and mRNA expression of five key genes in transcatheter arterial embolisation treated hepatocellular carcinoma.
A: Five key genes were identified using Maximal Clique Centrality method of the cytoHubba plugin. B: The mRNA expression level of the five key genes in hepatocellular carcinoma samples of transcatheter arterial embolisation (TACE) non-responders and TACE responders. DLGAP5: DLG-associated protein 5; KIF20A: Kinesin family member 20A; ASPM: Assembly factor for spindle microtubules; KIF11: Kinesin family member 11; TPX2: TPX2 microtubule nucleation factor.
Figure 7 The expression of five key genes in hepatocellular carcinoma.
A-E: The expression level of the five key genes in hepatocellular carcinoma (HCC) samples via the integration of all of the included HCC samples. DLGAP5: DLG associated protein 5; KIF20A: Kinesin family member 20A; ASPM: Assembly factor for spindle microtubules; KIF11: Kinesin family member 11; TPX2: TPX2 microtubule nucleation factor; SD: Standard deviation; SMD: Standard mean difference; CI: Confidence interval.
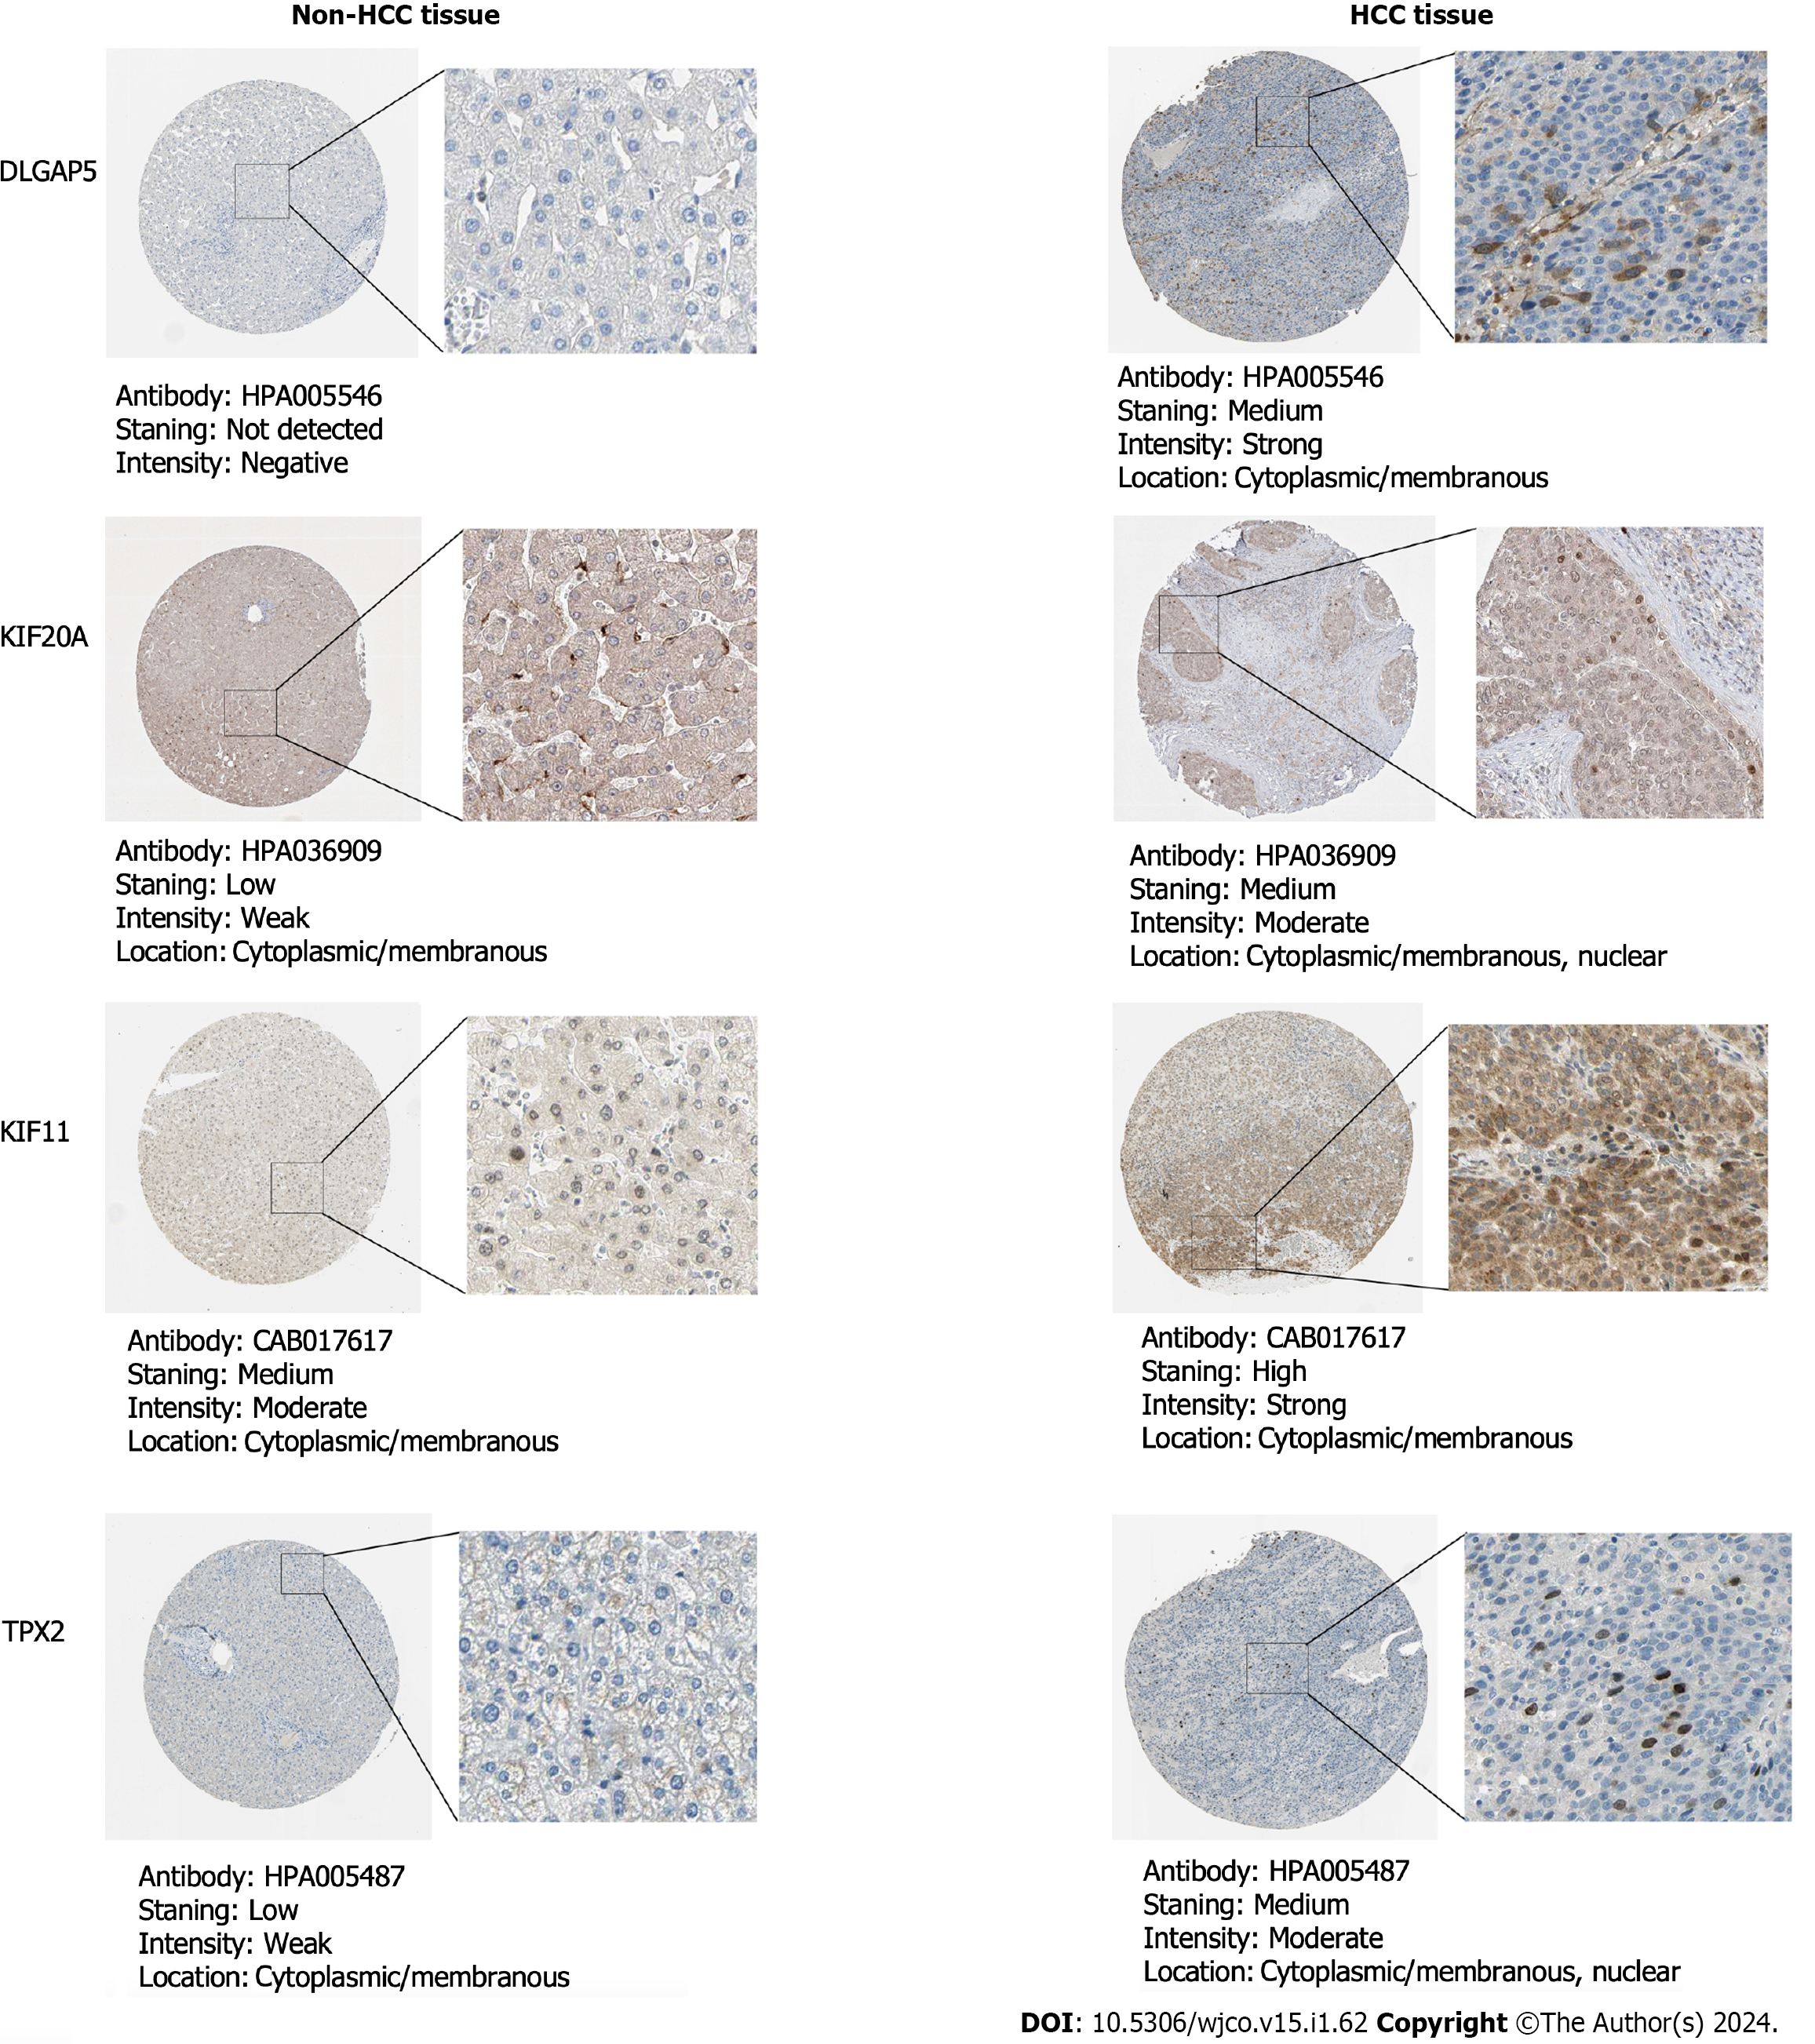
Figure 8 The protein expression of the key genes in non-hepatocellular carcinoma and hepatocellular carcinoma tissues via immuno
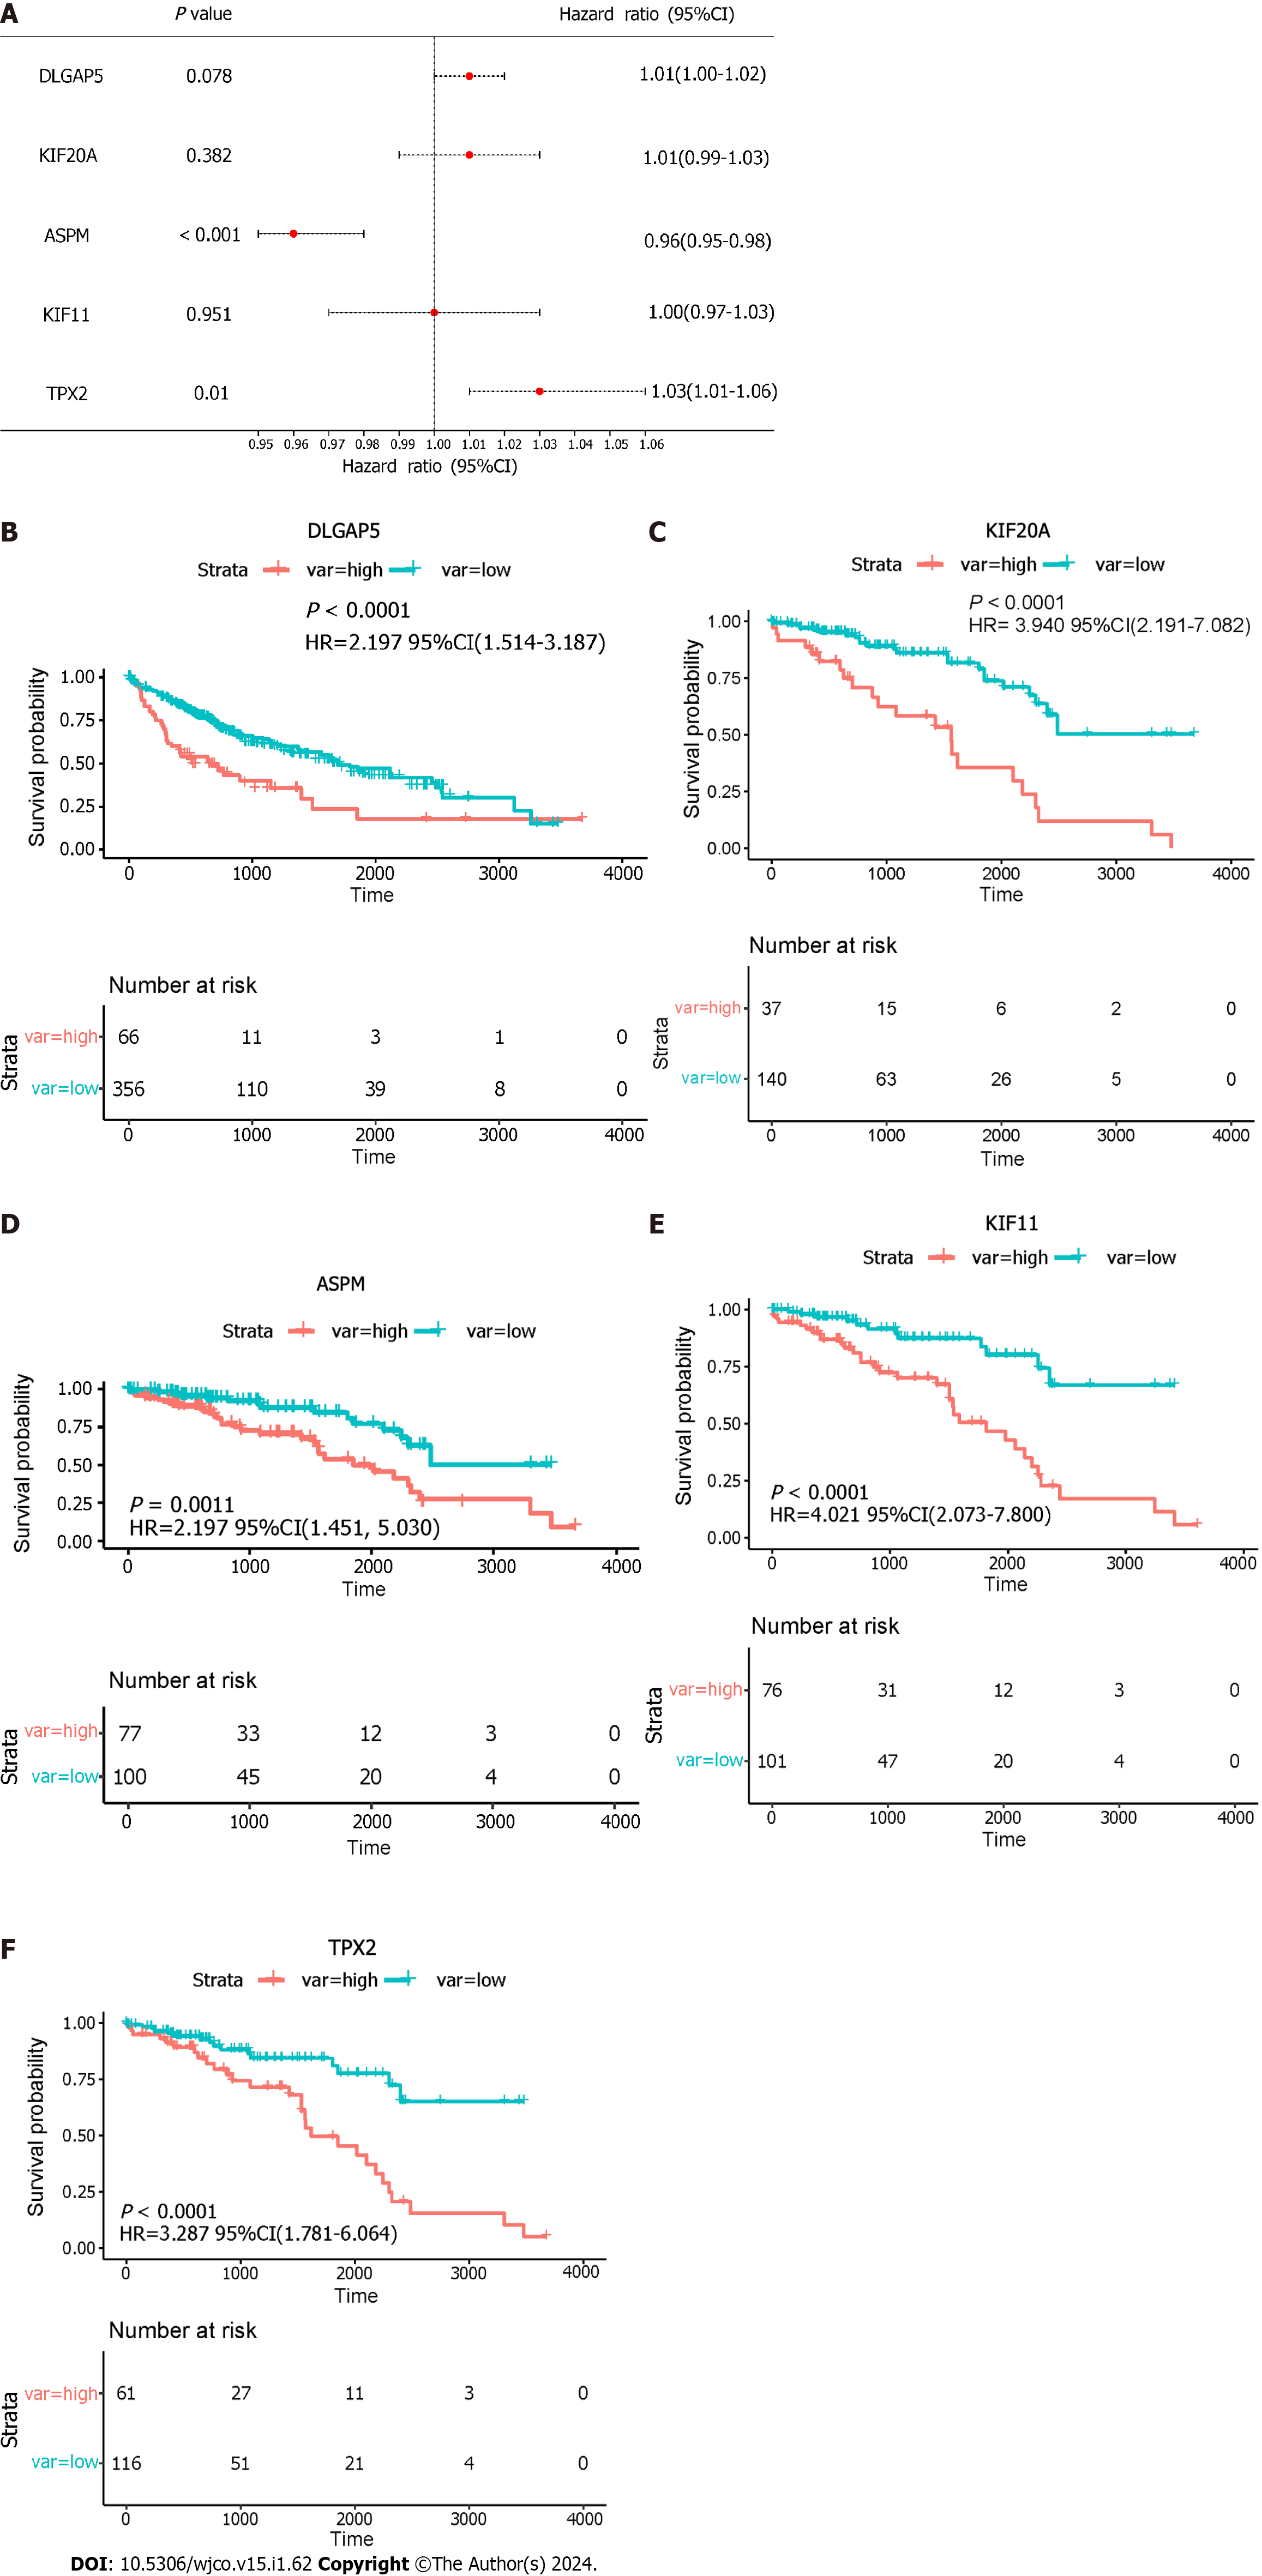
Figure 9 The Kaplan-Meier curve analysis.
A: The multivariate analysis of five key genes; B–F: Survival curves for the five key genes. DLGAP5: DLG associated protein 5; KIF20A: kinesin family member 20A; ASPM: Assembly factor for spindle microtubules; KIF11: Kinesin family member 11; TPX2: TPX2 microtubule nucleation factor; HR: Hazard ratio; CI: Confidence interval.
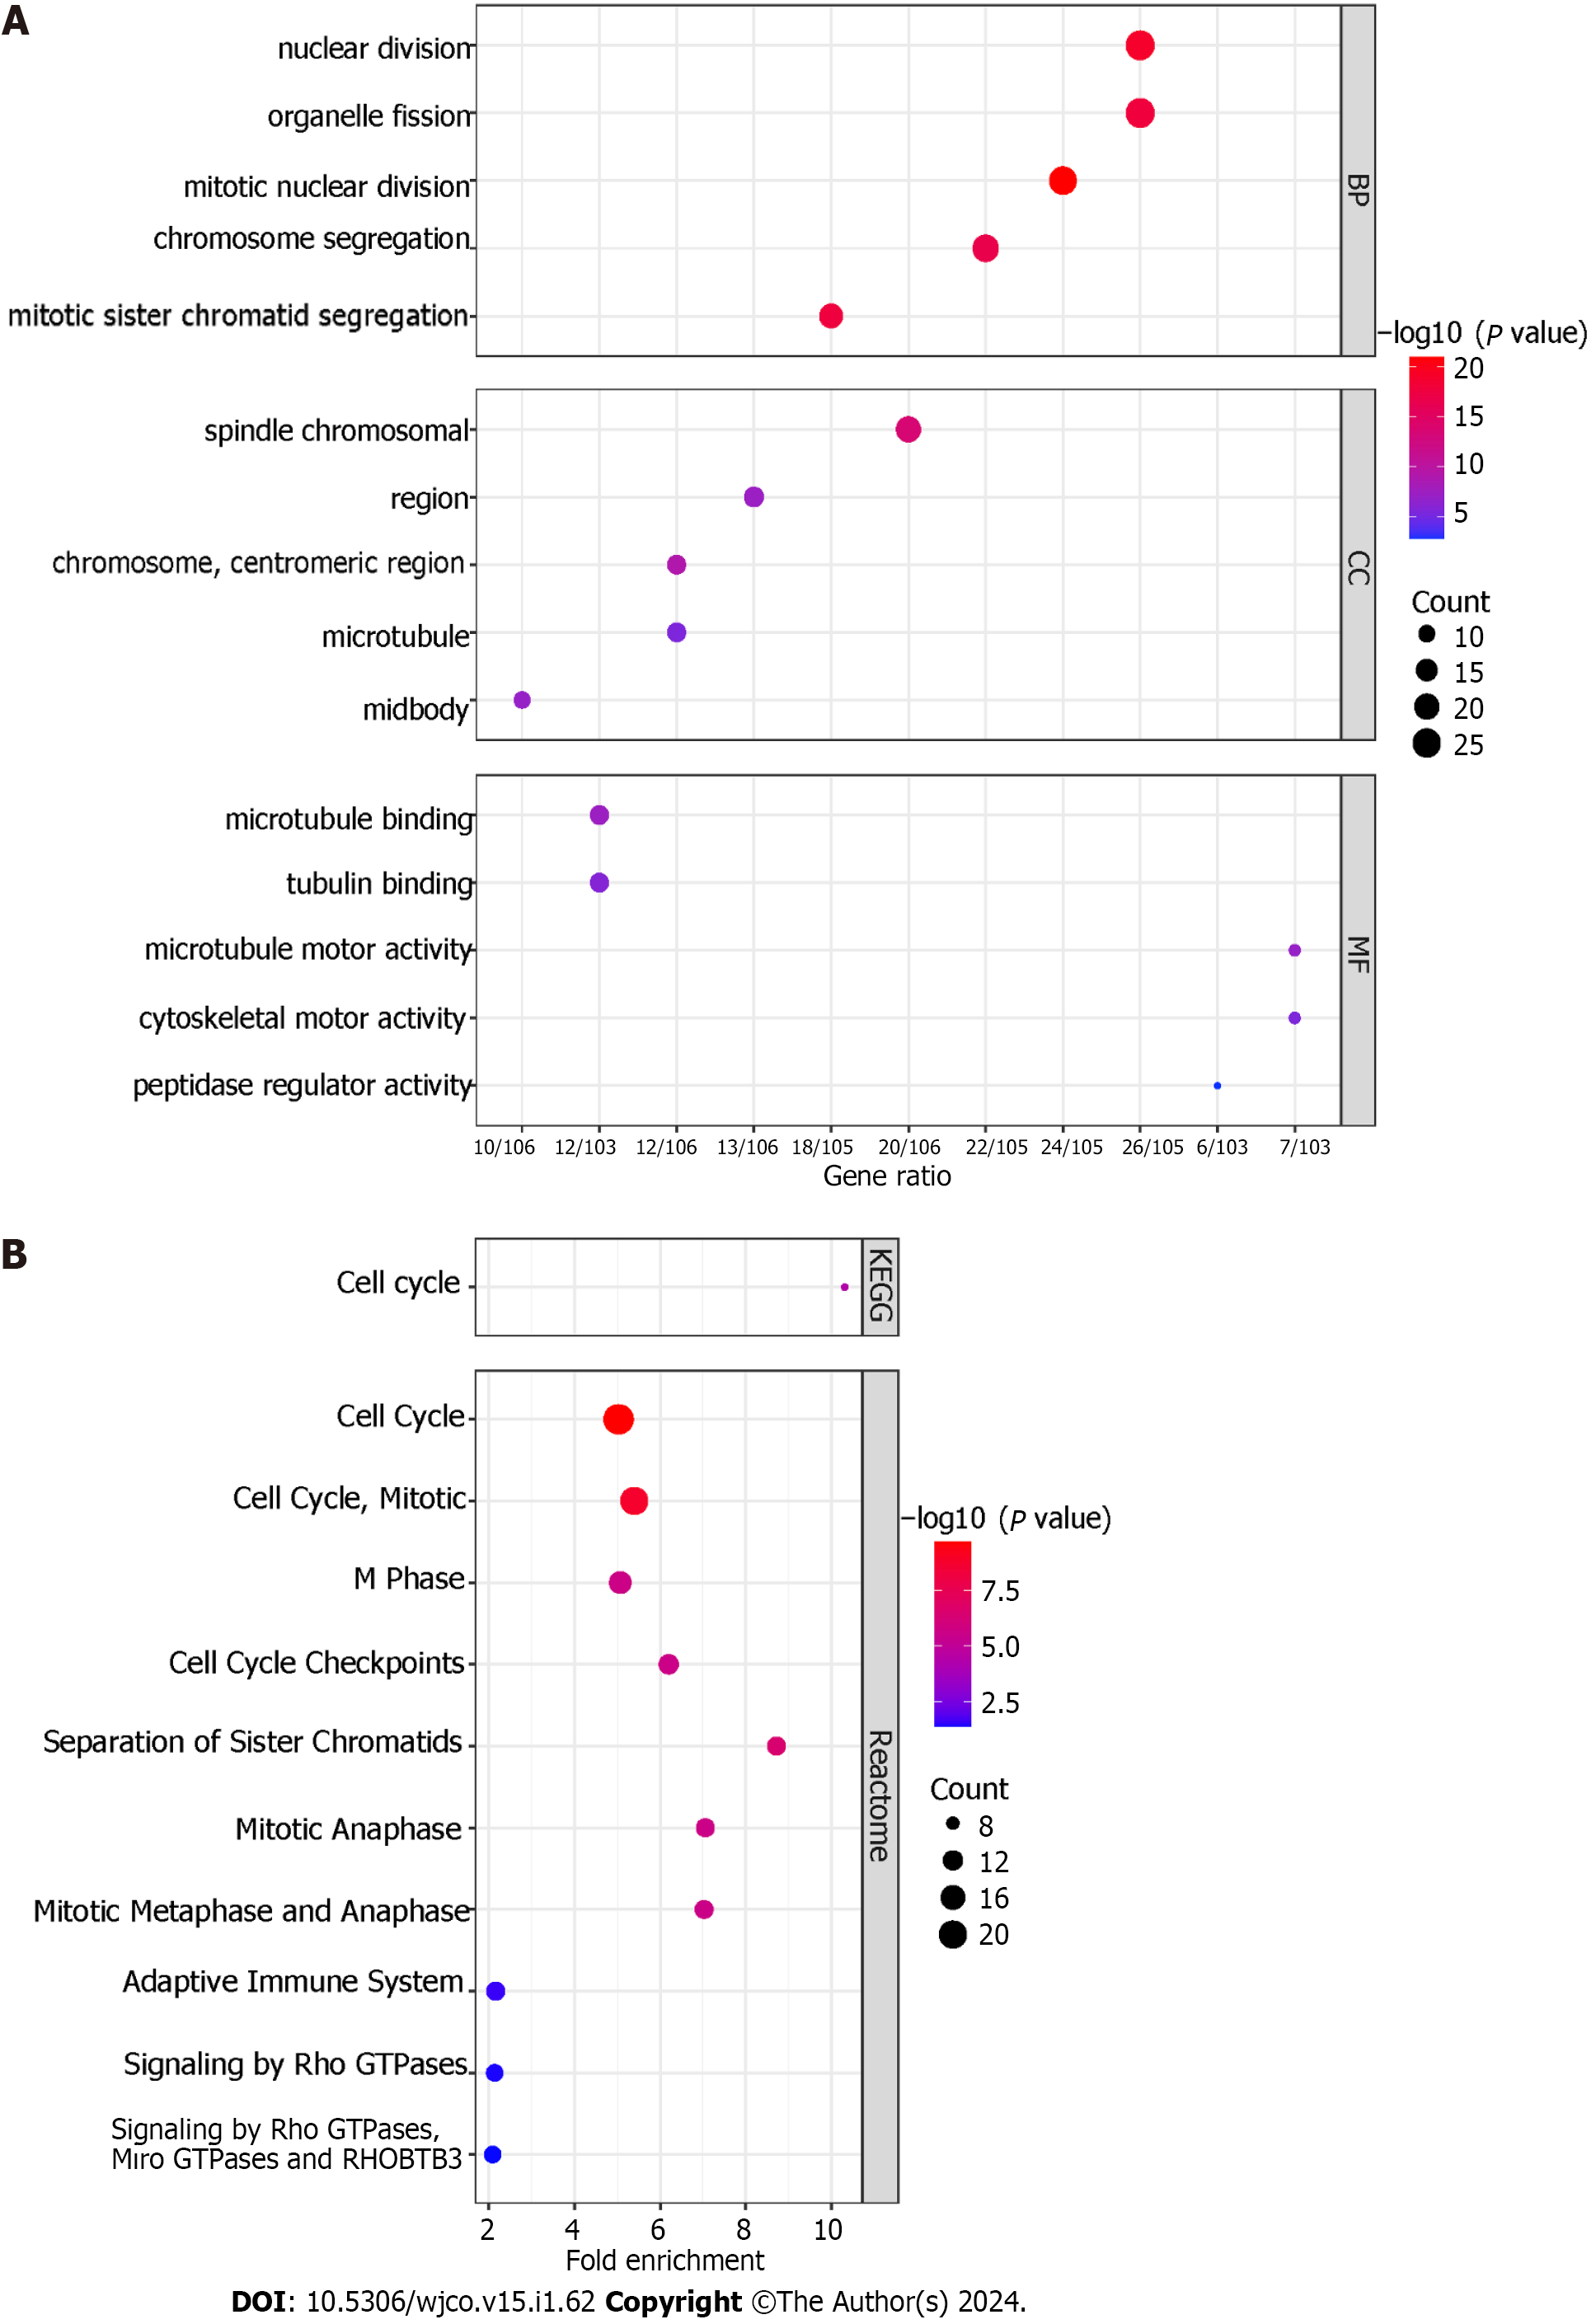
Figure 10 Enrichment analysis.
A: Gene Ontology analysis of transcatheter arterial chemoembolisation (TACE) refractoriness-related genes. The top-five biological processes, the top-five cellular components, and the top-five molecular functions are shown; B: The Kyoto Encyclopaedia of Genes and Genomes and Reactome pathways of TACE refractoriness-related genes.
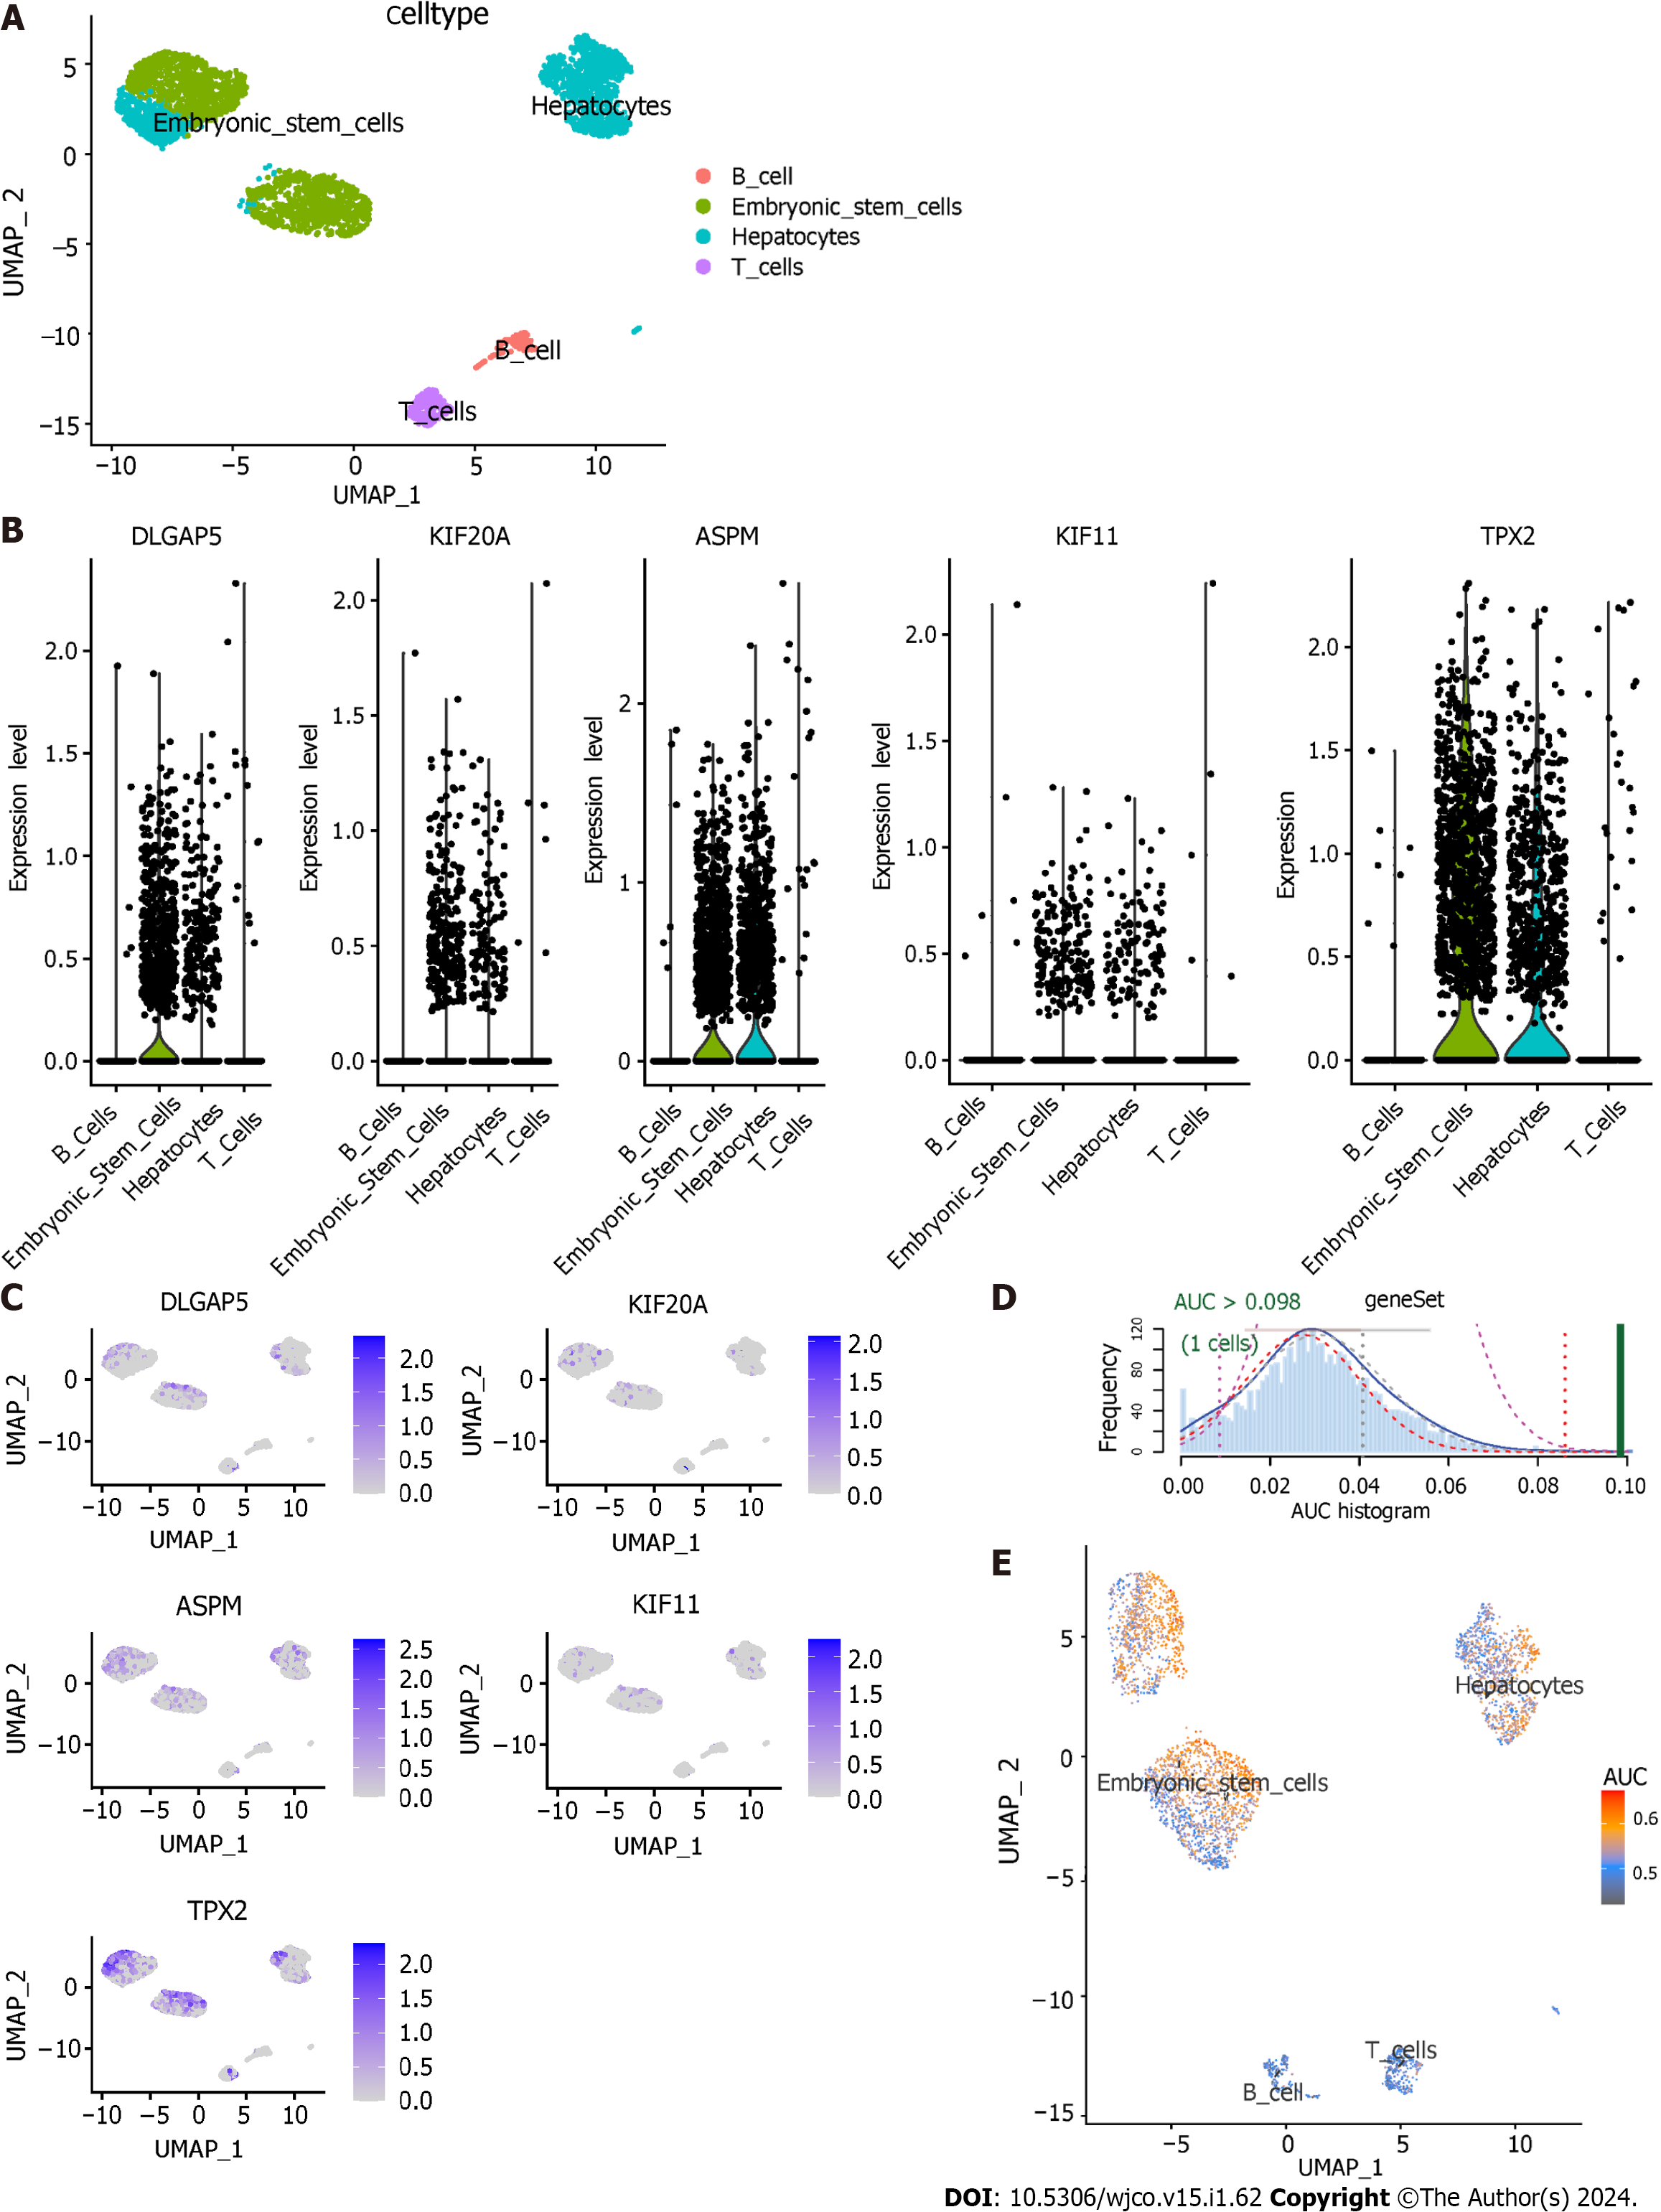
Figure 11 Single-cell RNA sequencing analysis and AUCell.
A: Uniform manifold approximation and projection (UMAP) plot showing four cell types in hepatocellular carcinoma samples; B: Violin plots showing the expression level of five key genes in four cell types. C: Expression level of five key genes in four cell types were drawn on UMAP; D: AUCell score distribution curves of 112 transcatheter arterial chemoembolisation (TACE) refractoriness-related genes; E: Scatter plot showing the distribution of AUCell scores in 112 TACE refractoriness-related genes. DLGAP5: DLG associated protein 5; KIF20A: Kinesin family member 20A; ASPM: Assembly factor for spindle microtubules; KIF11: Kinesin family member 11; TPX2: TPX2 microtubule nucleation factor; AUC: Area under the curve.
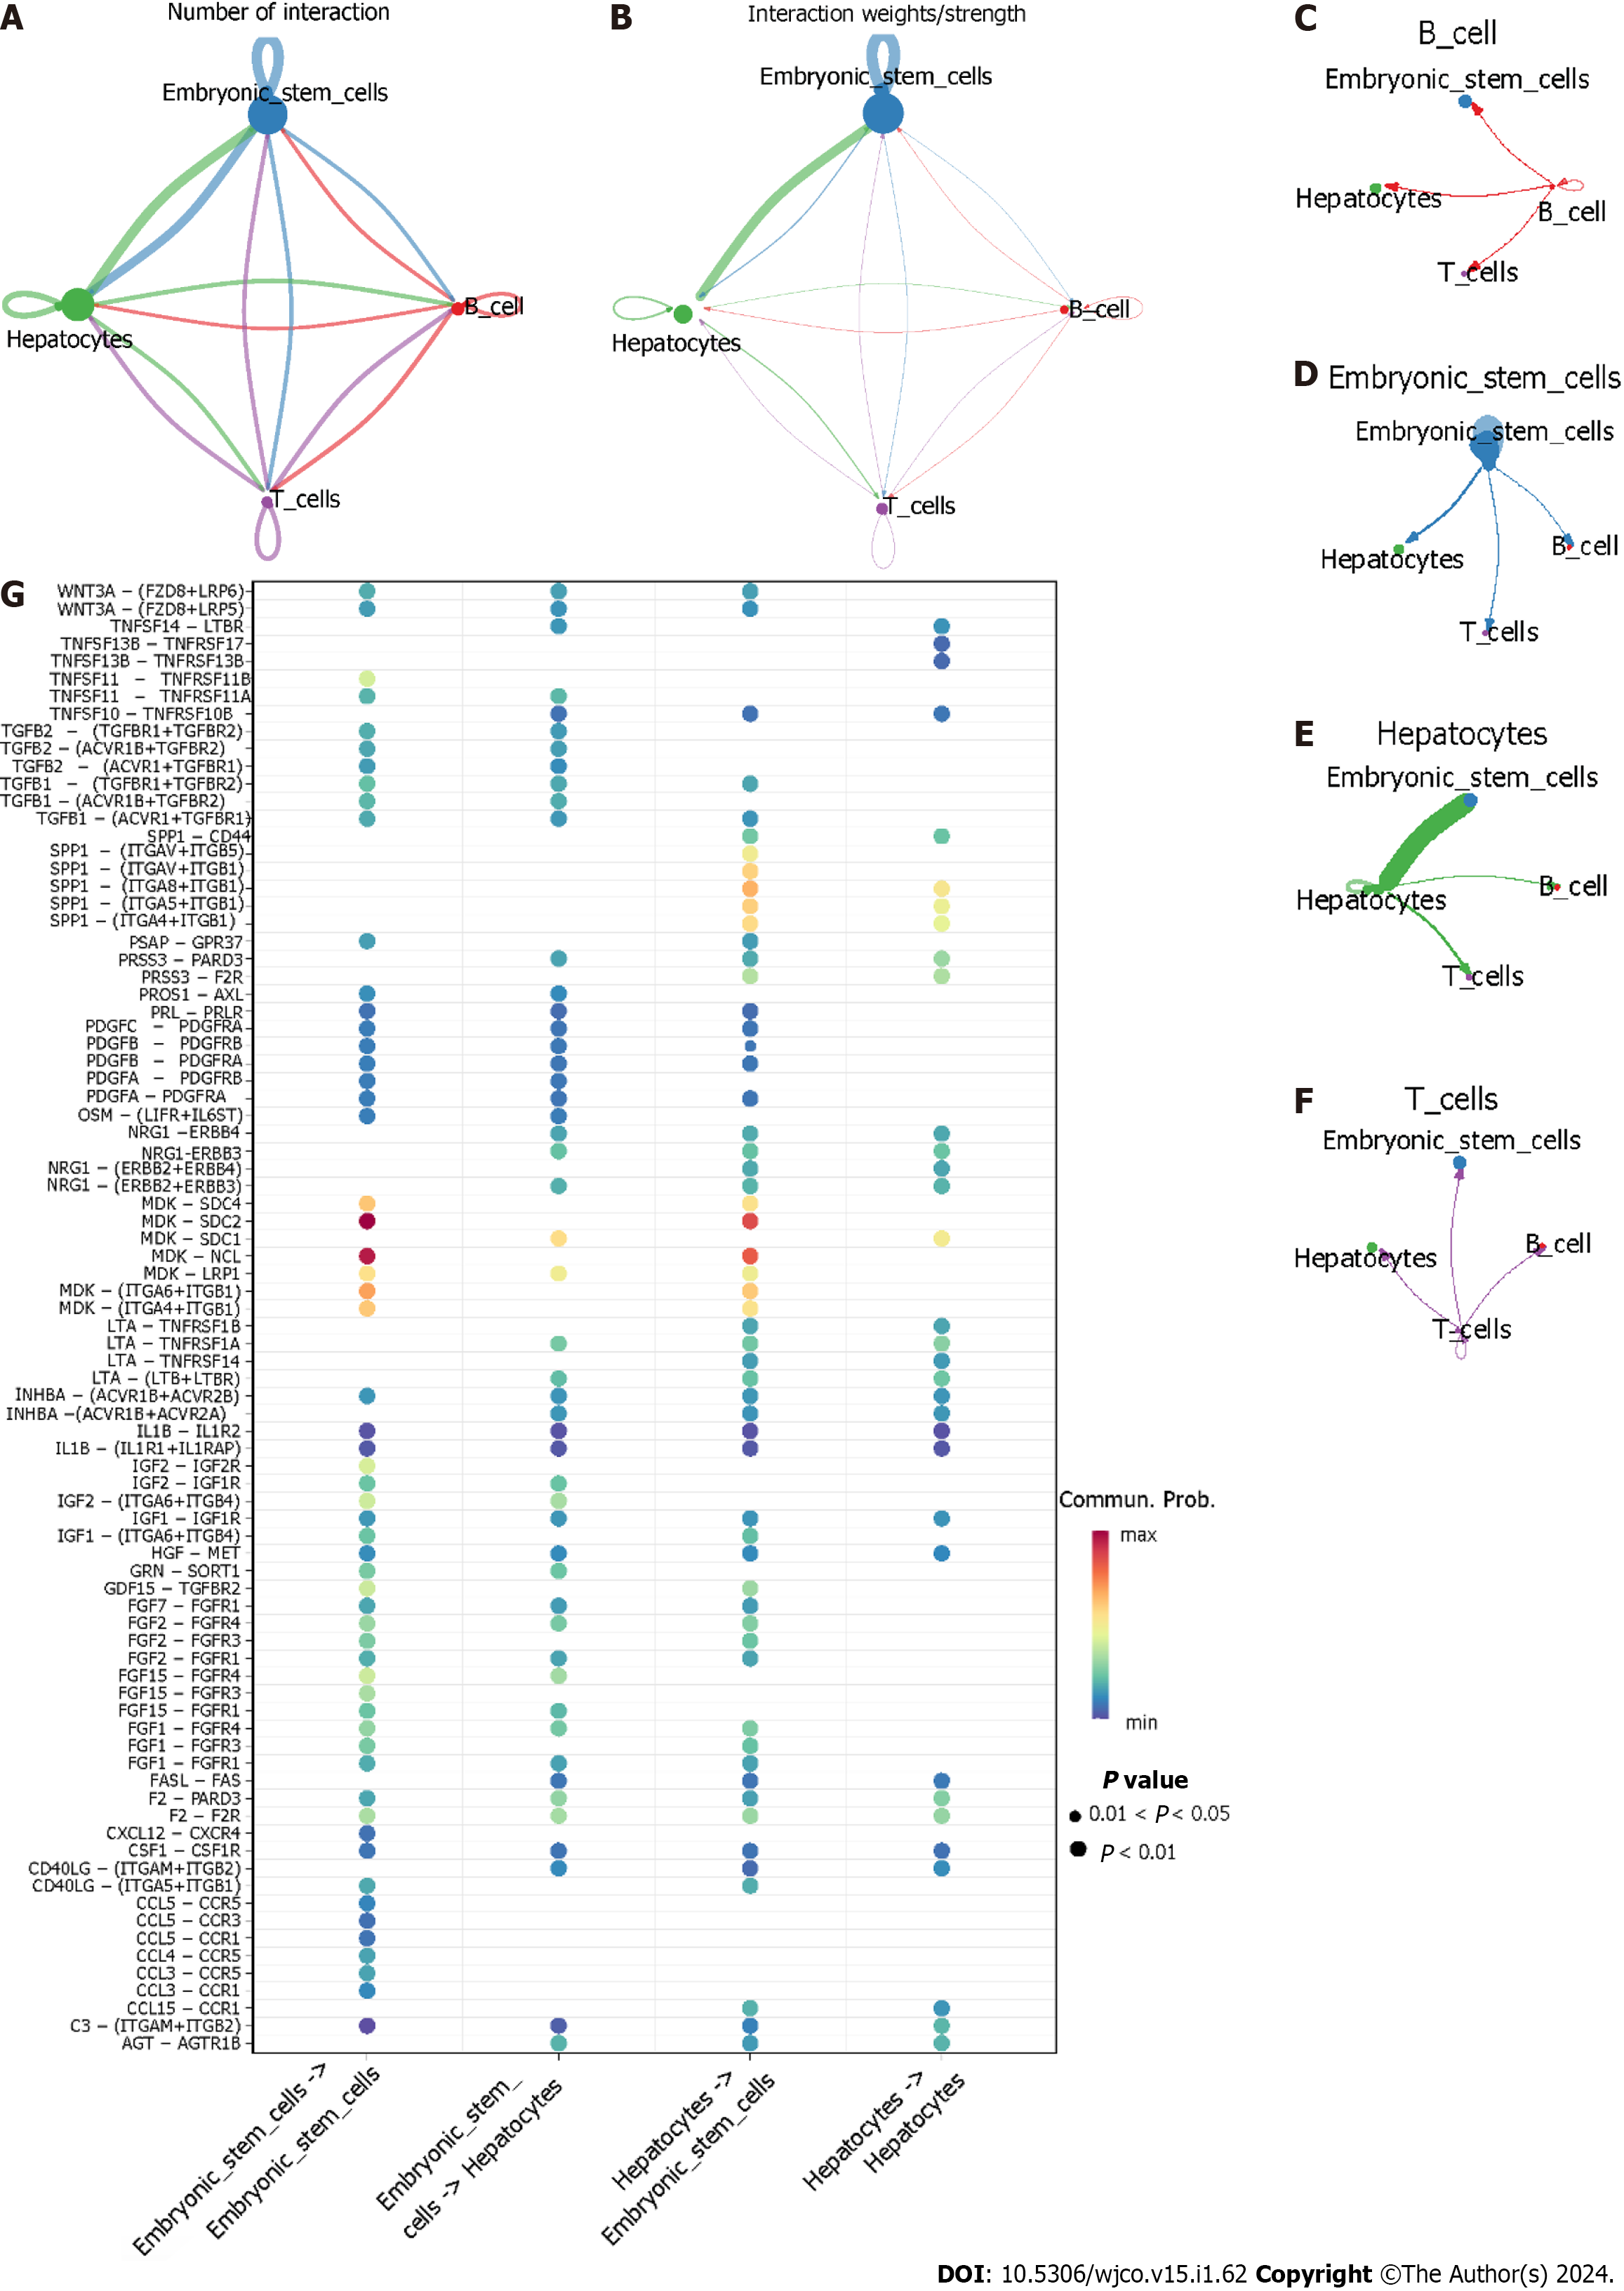
Figure 12 Cell–cell communication.
A and B: The aggregated intercellular communication between any two cell groups. The colours of the periphery circle referred to one cell group and the vertex of periphery circle represented the numbers of cells. The cells in the starting site of edge expressed ligand and the cells the arrow pointed in expressed receptor. The thickness of the line signified the numbers of ligand-receptor pairs, and the thicker the line meant more ligand-receptor pairs; B: The thickness of edge represented the interaction strength of any two cell groups. The thicker the edge was, the bigger the interaction strength; C–F: The intercellular communication of each cell group. Hepatocytes providing ligands had strongest communication with embryonic stem cells that expressed receptors; G: The identification of ligand-receptor pairs between hepatocytes and embryonic stem cells. (Ligands provider)→(receptors provider).
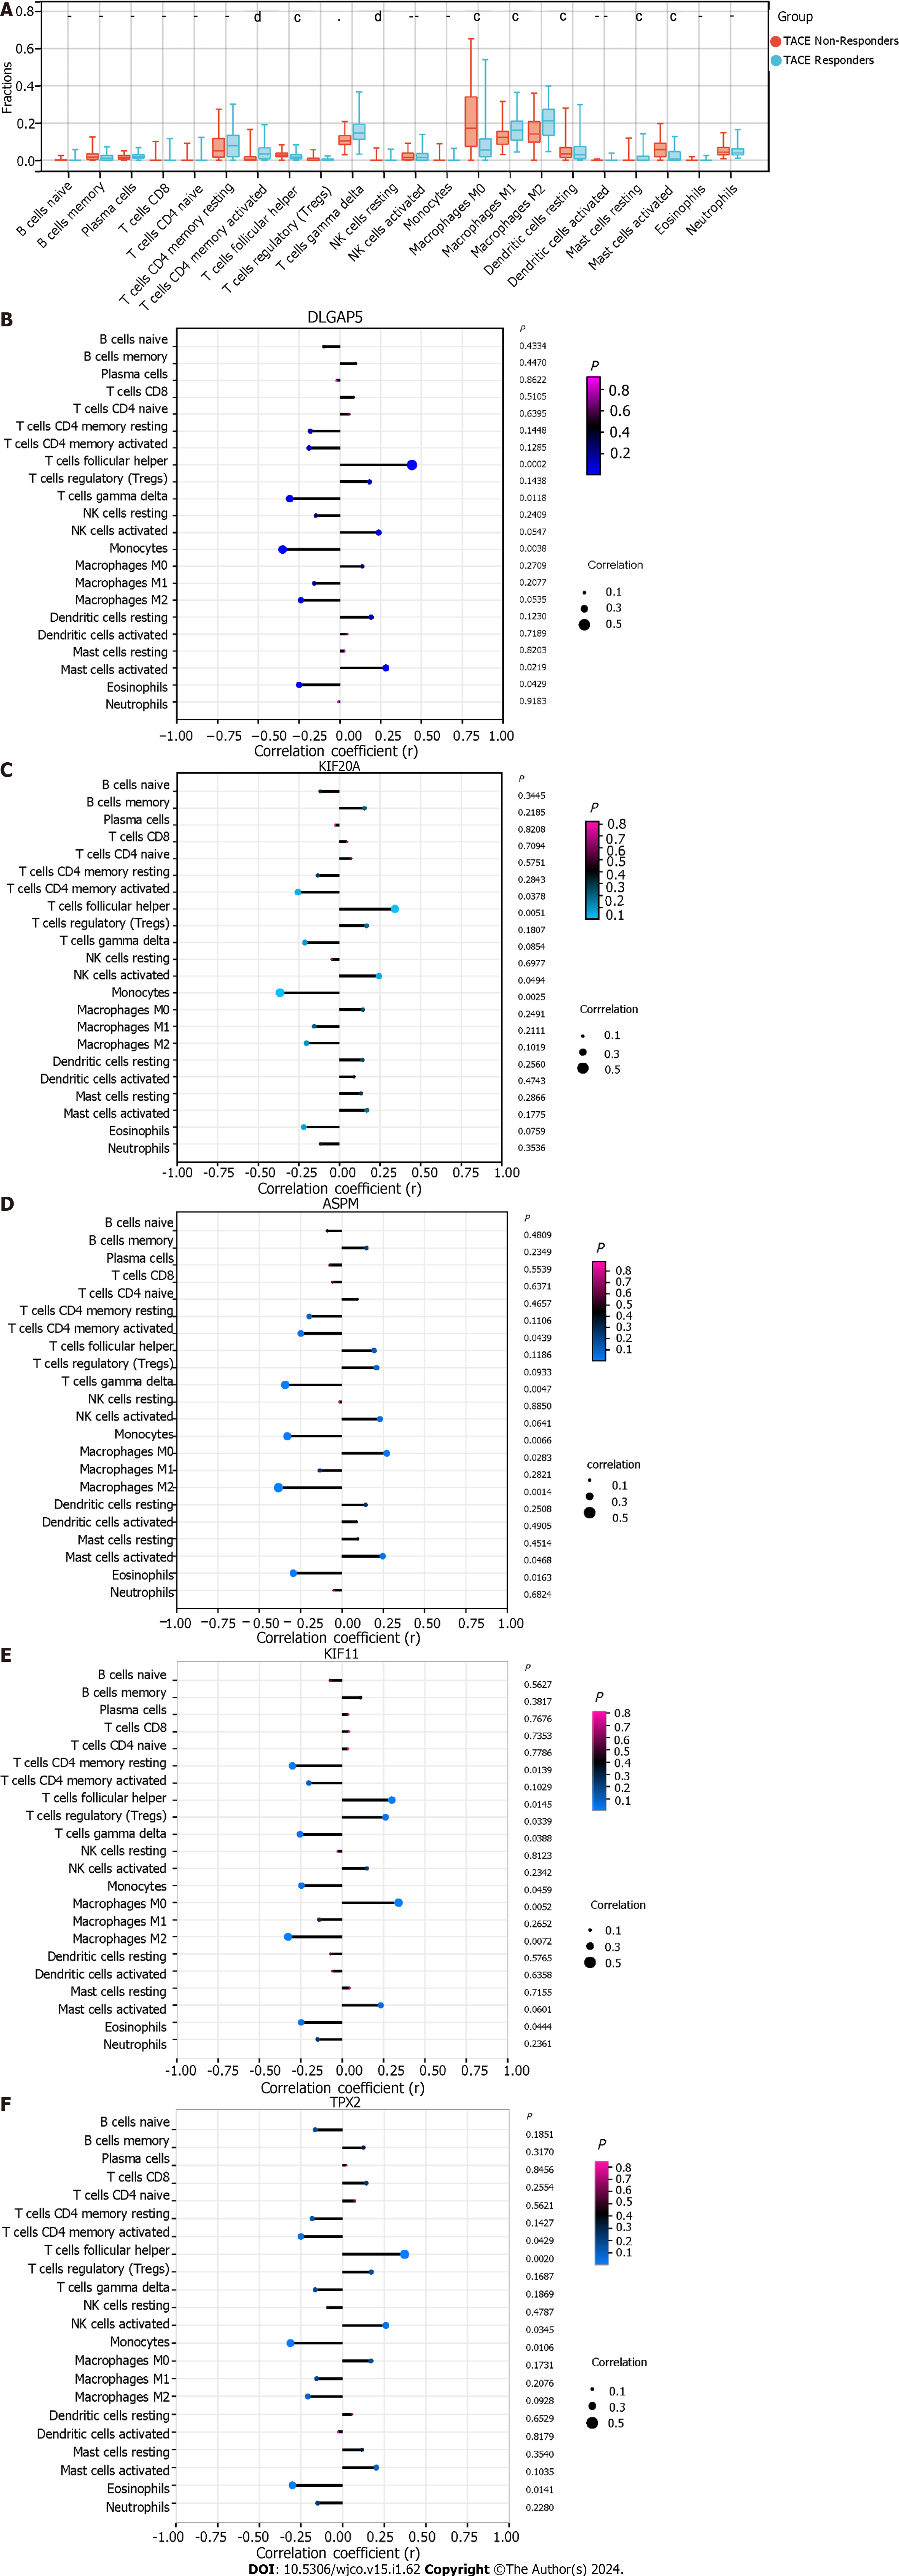
Figure 13 Immune infiltration analysis.
A: The immune landscape of 22 kinds of immune cells between transcatheter arterial chemoembolisation (TACE) non-responders and TACE responders using CIBERSORT algorithm. (aP < 0.05, bP < 0.01, cP < 0.001, dP < 0.0001); B-F: The relationship between expression of five key genes and the infiltration of 22 kinds of immune cells in TACE non-responders group. DLGAP5: DLG associated protein 5; KIF20A: Kinesin family member 20A; ASPM: Assembly factor for spindle microtubules; KIF11: Kinesin family member 11; TPX2: TPX2 microtubule nucleation factor; AUC: Area under the curve.
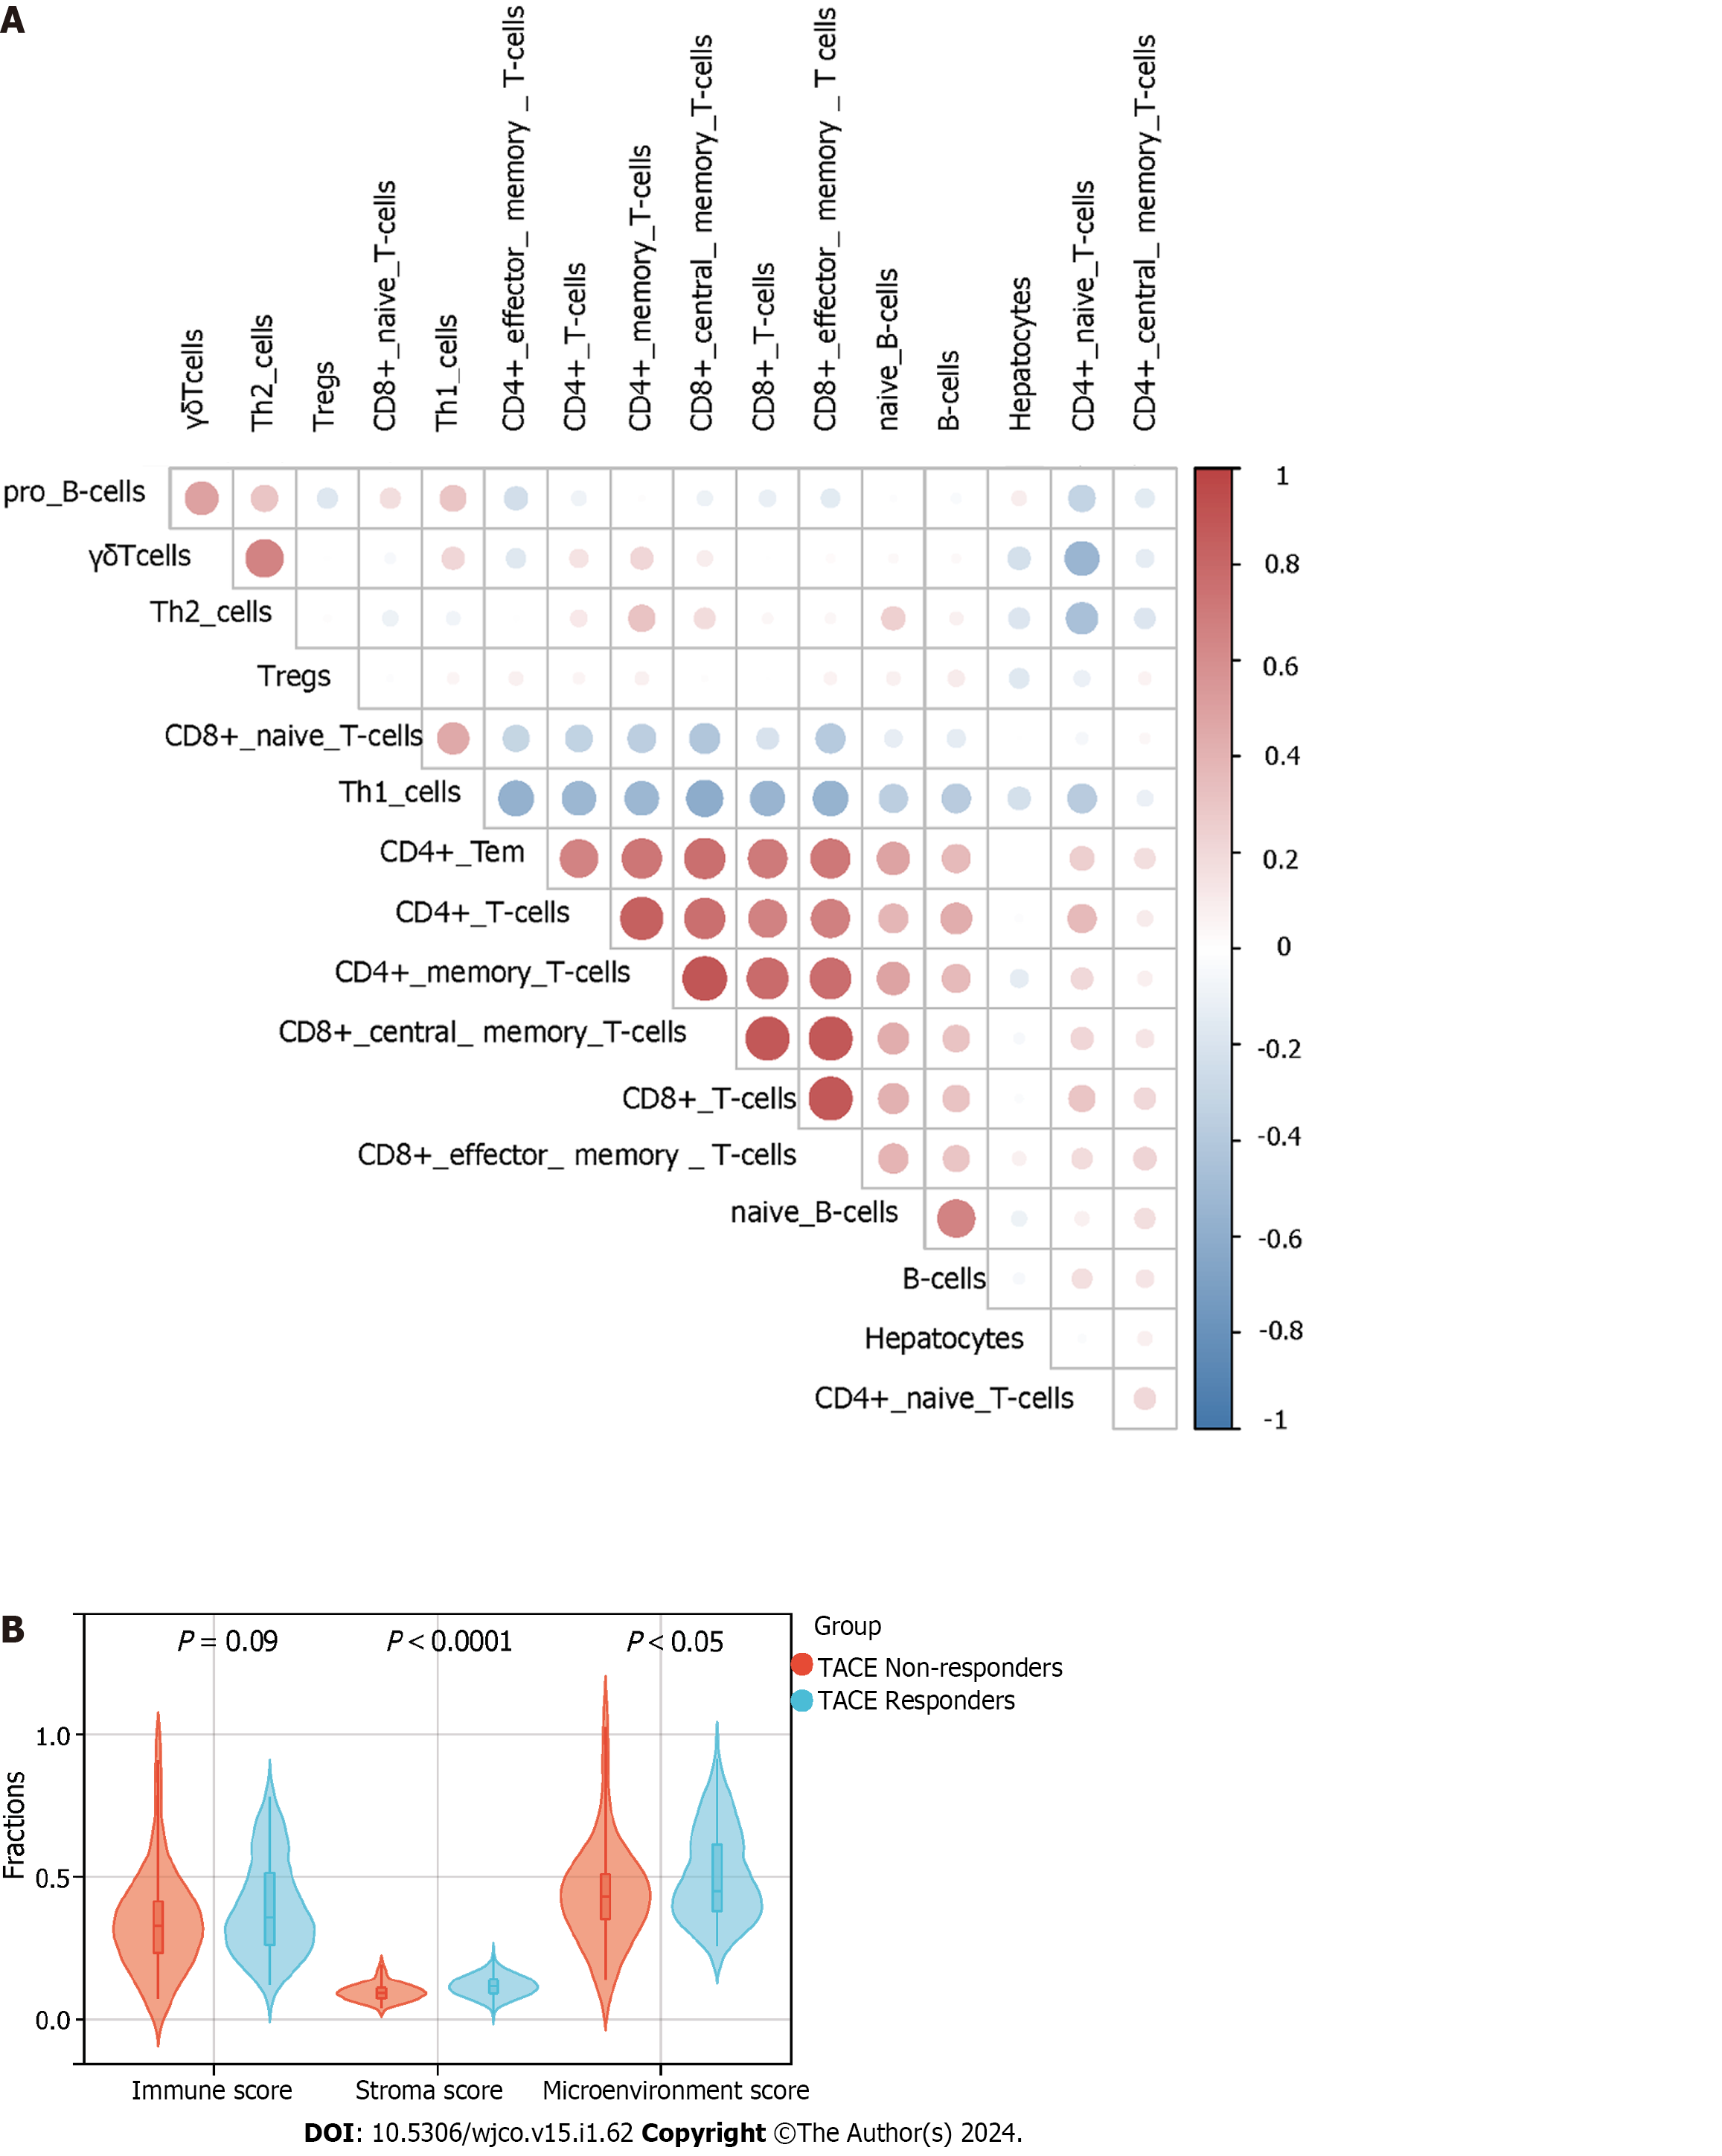
Figure 14 xCell immune infiltration analysis.
A: The correlation between hepatocytes, phenotypes of T cells and phenotypes of B cells by xCell algorithm; B: The comparison of immune, stromal and microenvironment score between transcatheter arterial chemoembolisation (TACE) non-responders and TACE responders by xCell algorithm.
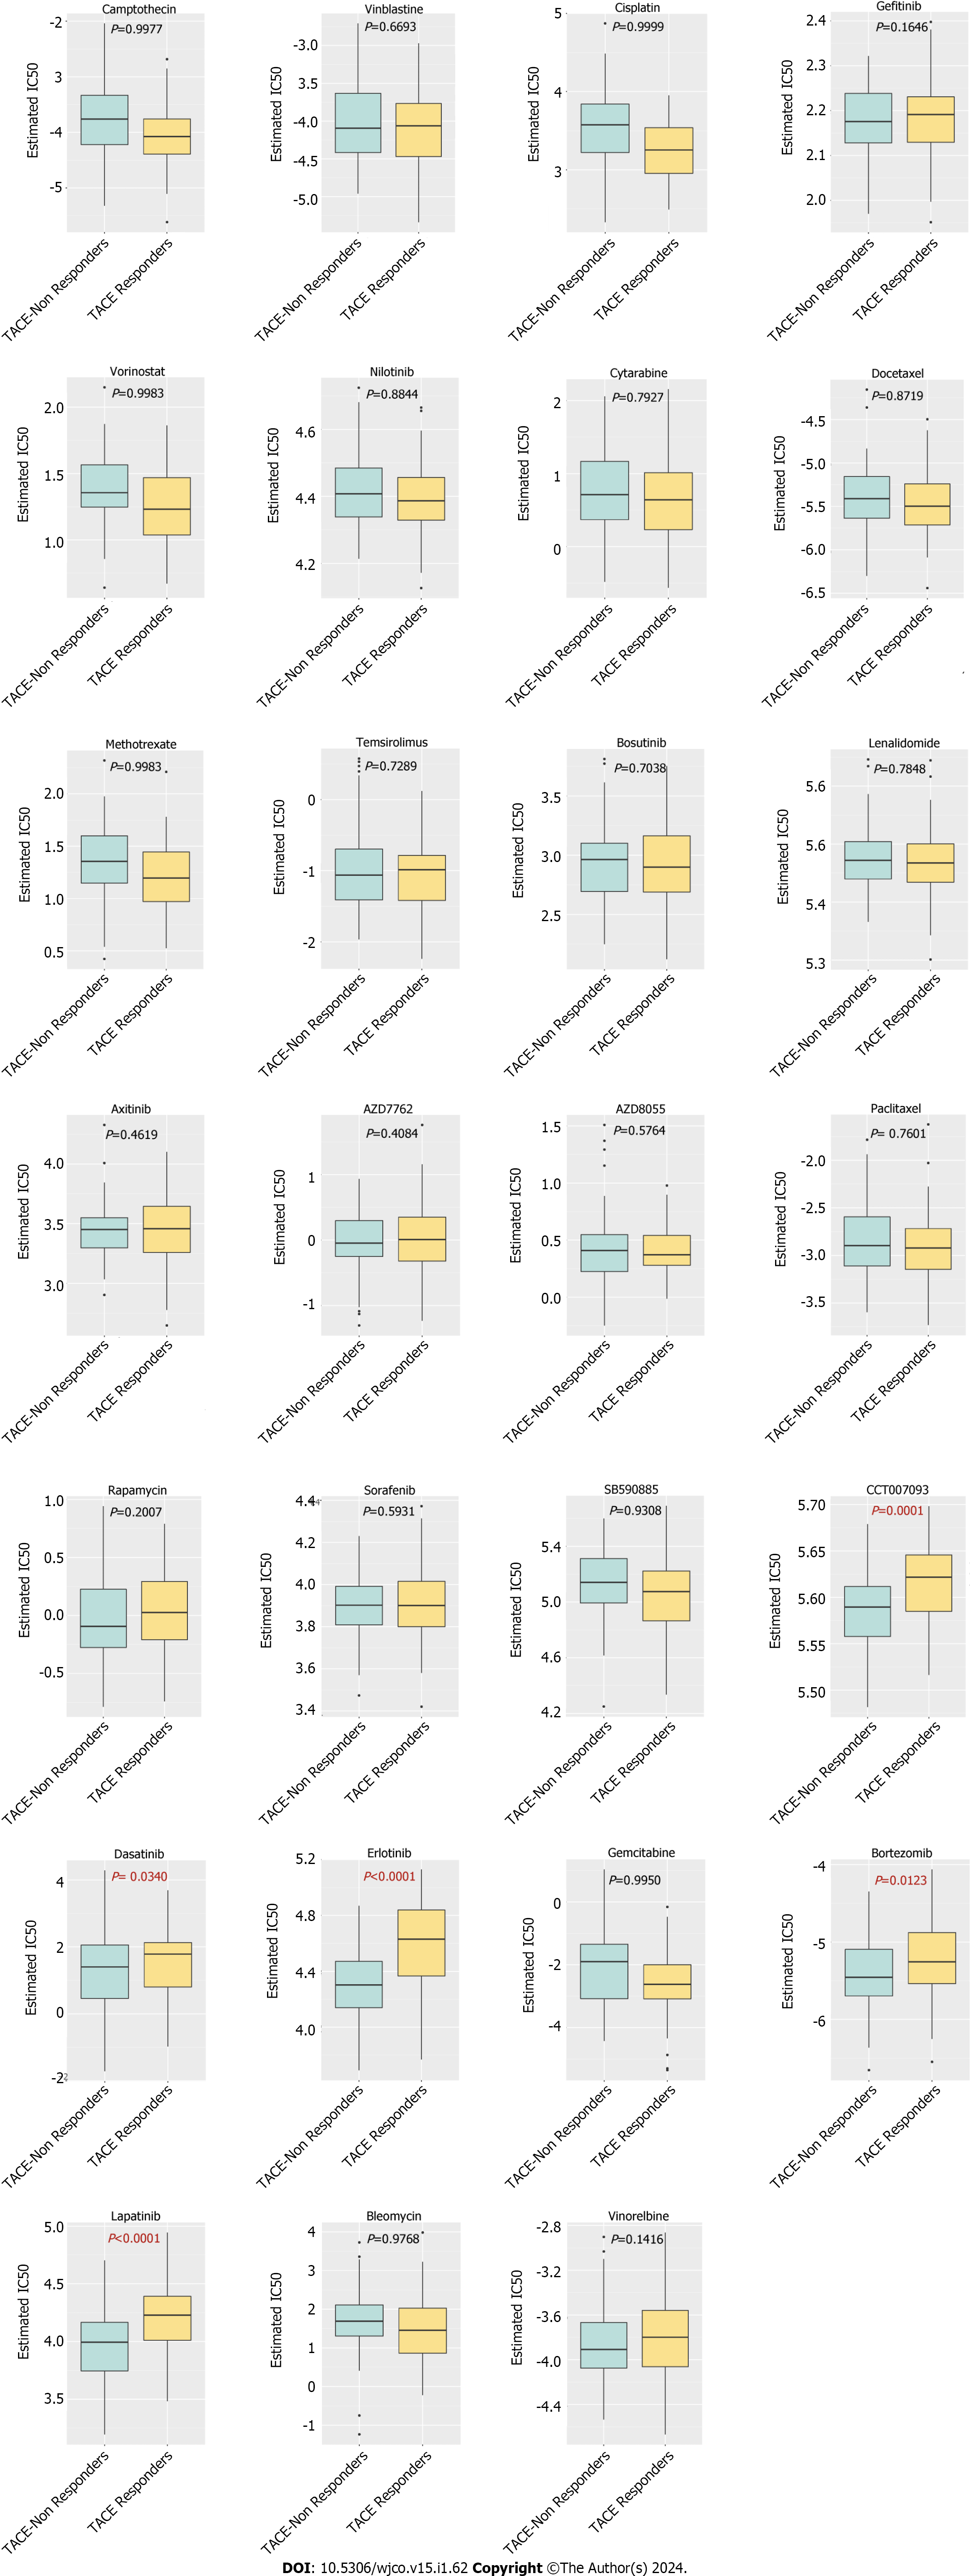
Figure 15 The prediction of potential drugs for refractory transcatheter arterial chemoembolisation treated hepatocellular carcinoma.
IC50: Half maximal inhibitory concentration.
- Citation: Huang JZ, Li JD, Chen G, He RQ. Identification of the key genes and mechanisms associated with transcatheter arterial chemoembolisation refractoriness in hepatocellular carcinoma. World J Clin Oncol 2024; 15(1): 62-88
- URL: https://www.wjgnet.com/2218-4333/full/v15/i1/62.htm
- DOI: https://dx.doi.org/10.5306/wjco.v15.i1.62


