Copyright
©The Author(s) 2023.
World J Clin Oncol. Nov 24, 2023; 14(11): 518-534
Published online Nov 24, 2023. doi: 10.5306/wjco.v14.i11.518
Published online Nov 24, 2023. doi: 10.5306/wjco.v14.i11.518
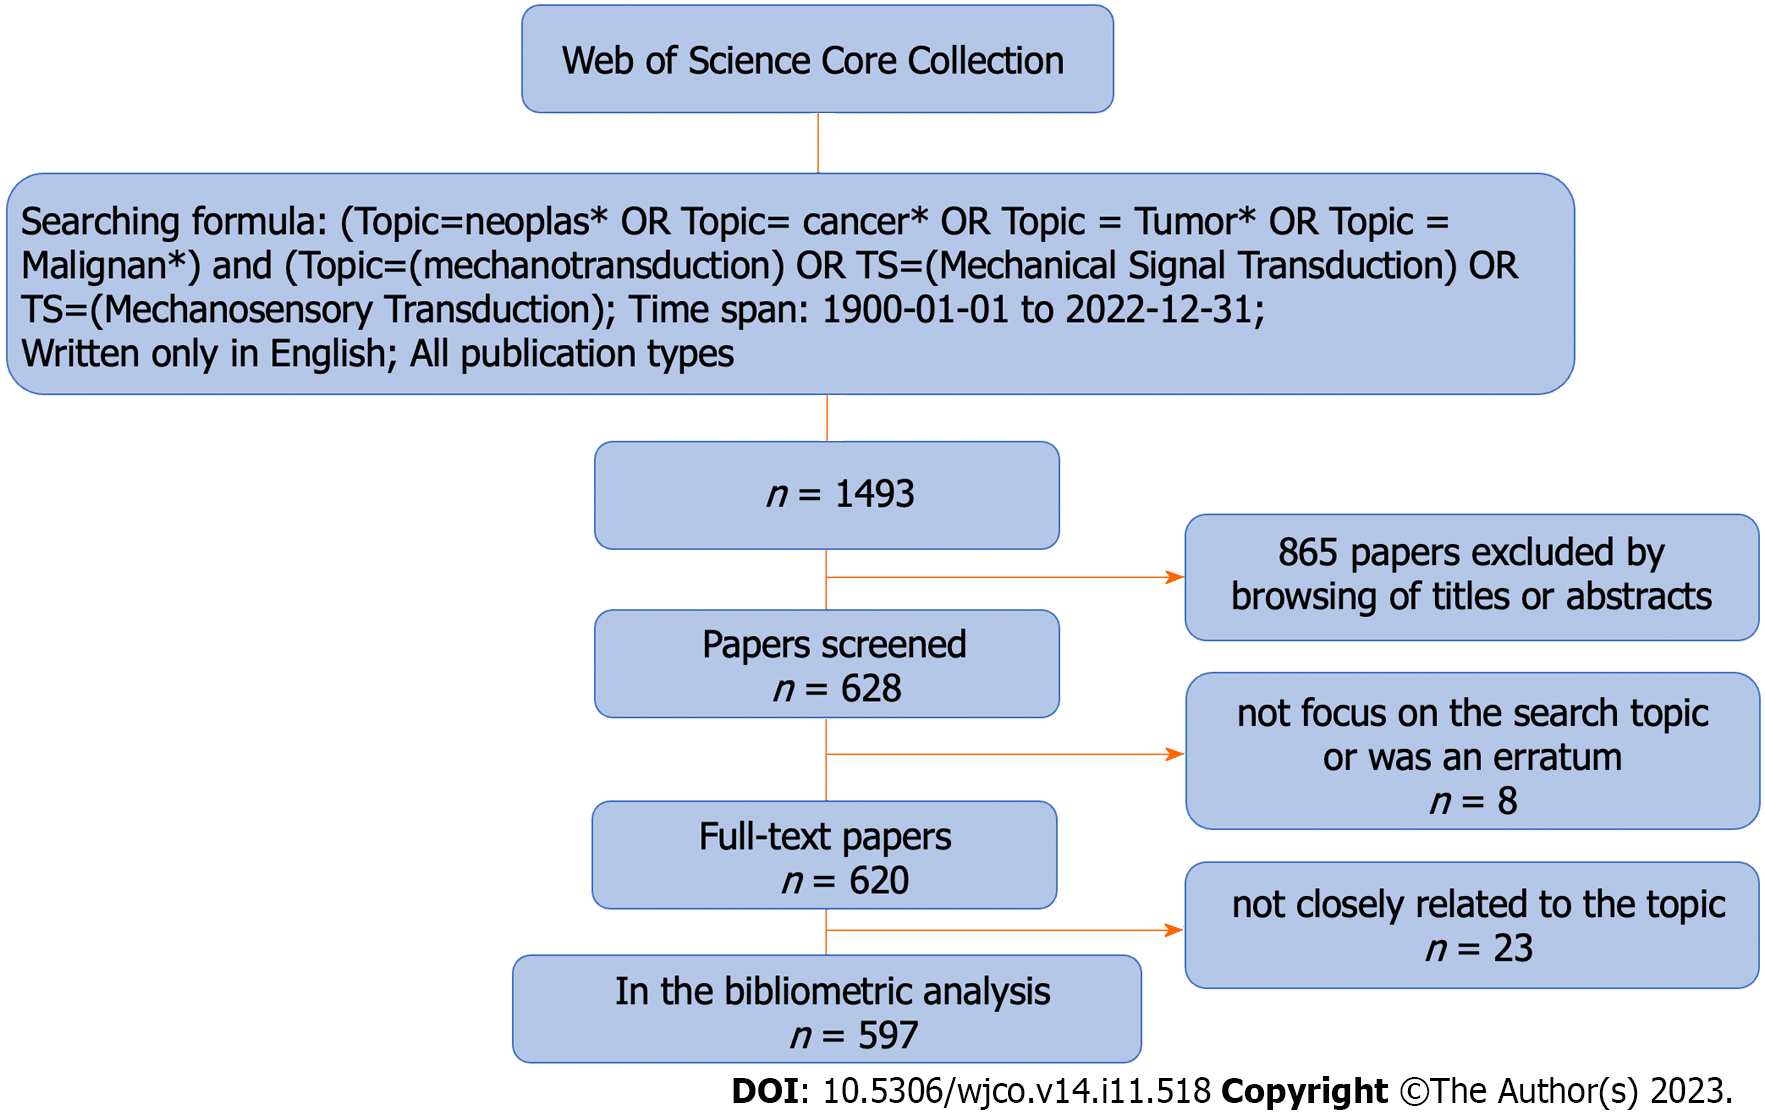
Figure 1 The strategy we used to search for publications about mechanotransduction in cancer.
597 publications closely correlated with mechanotransduction in cancer were extracted based on this strategy.
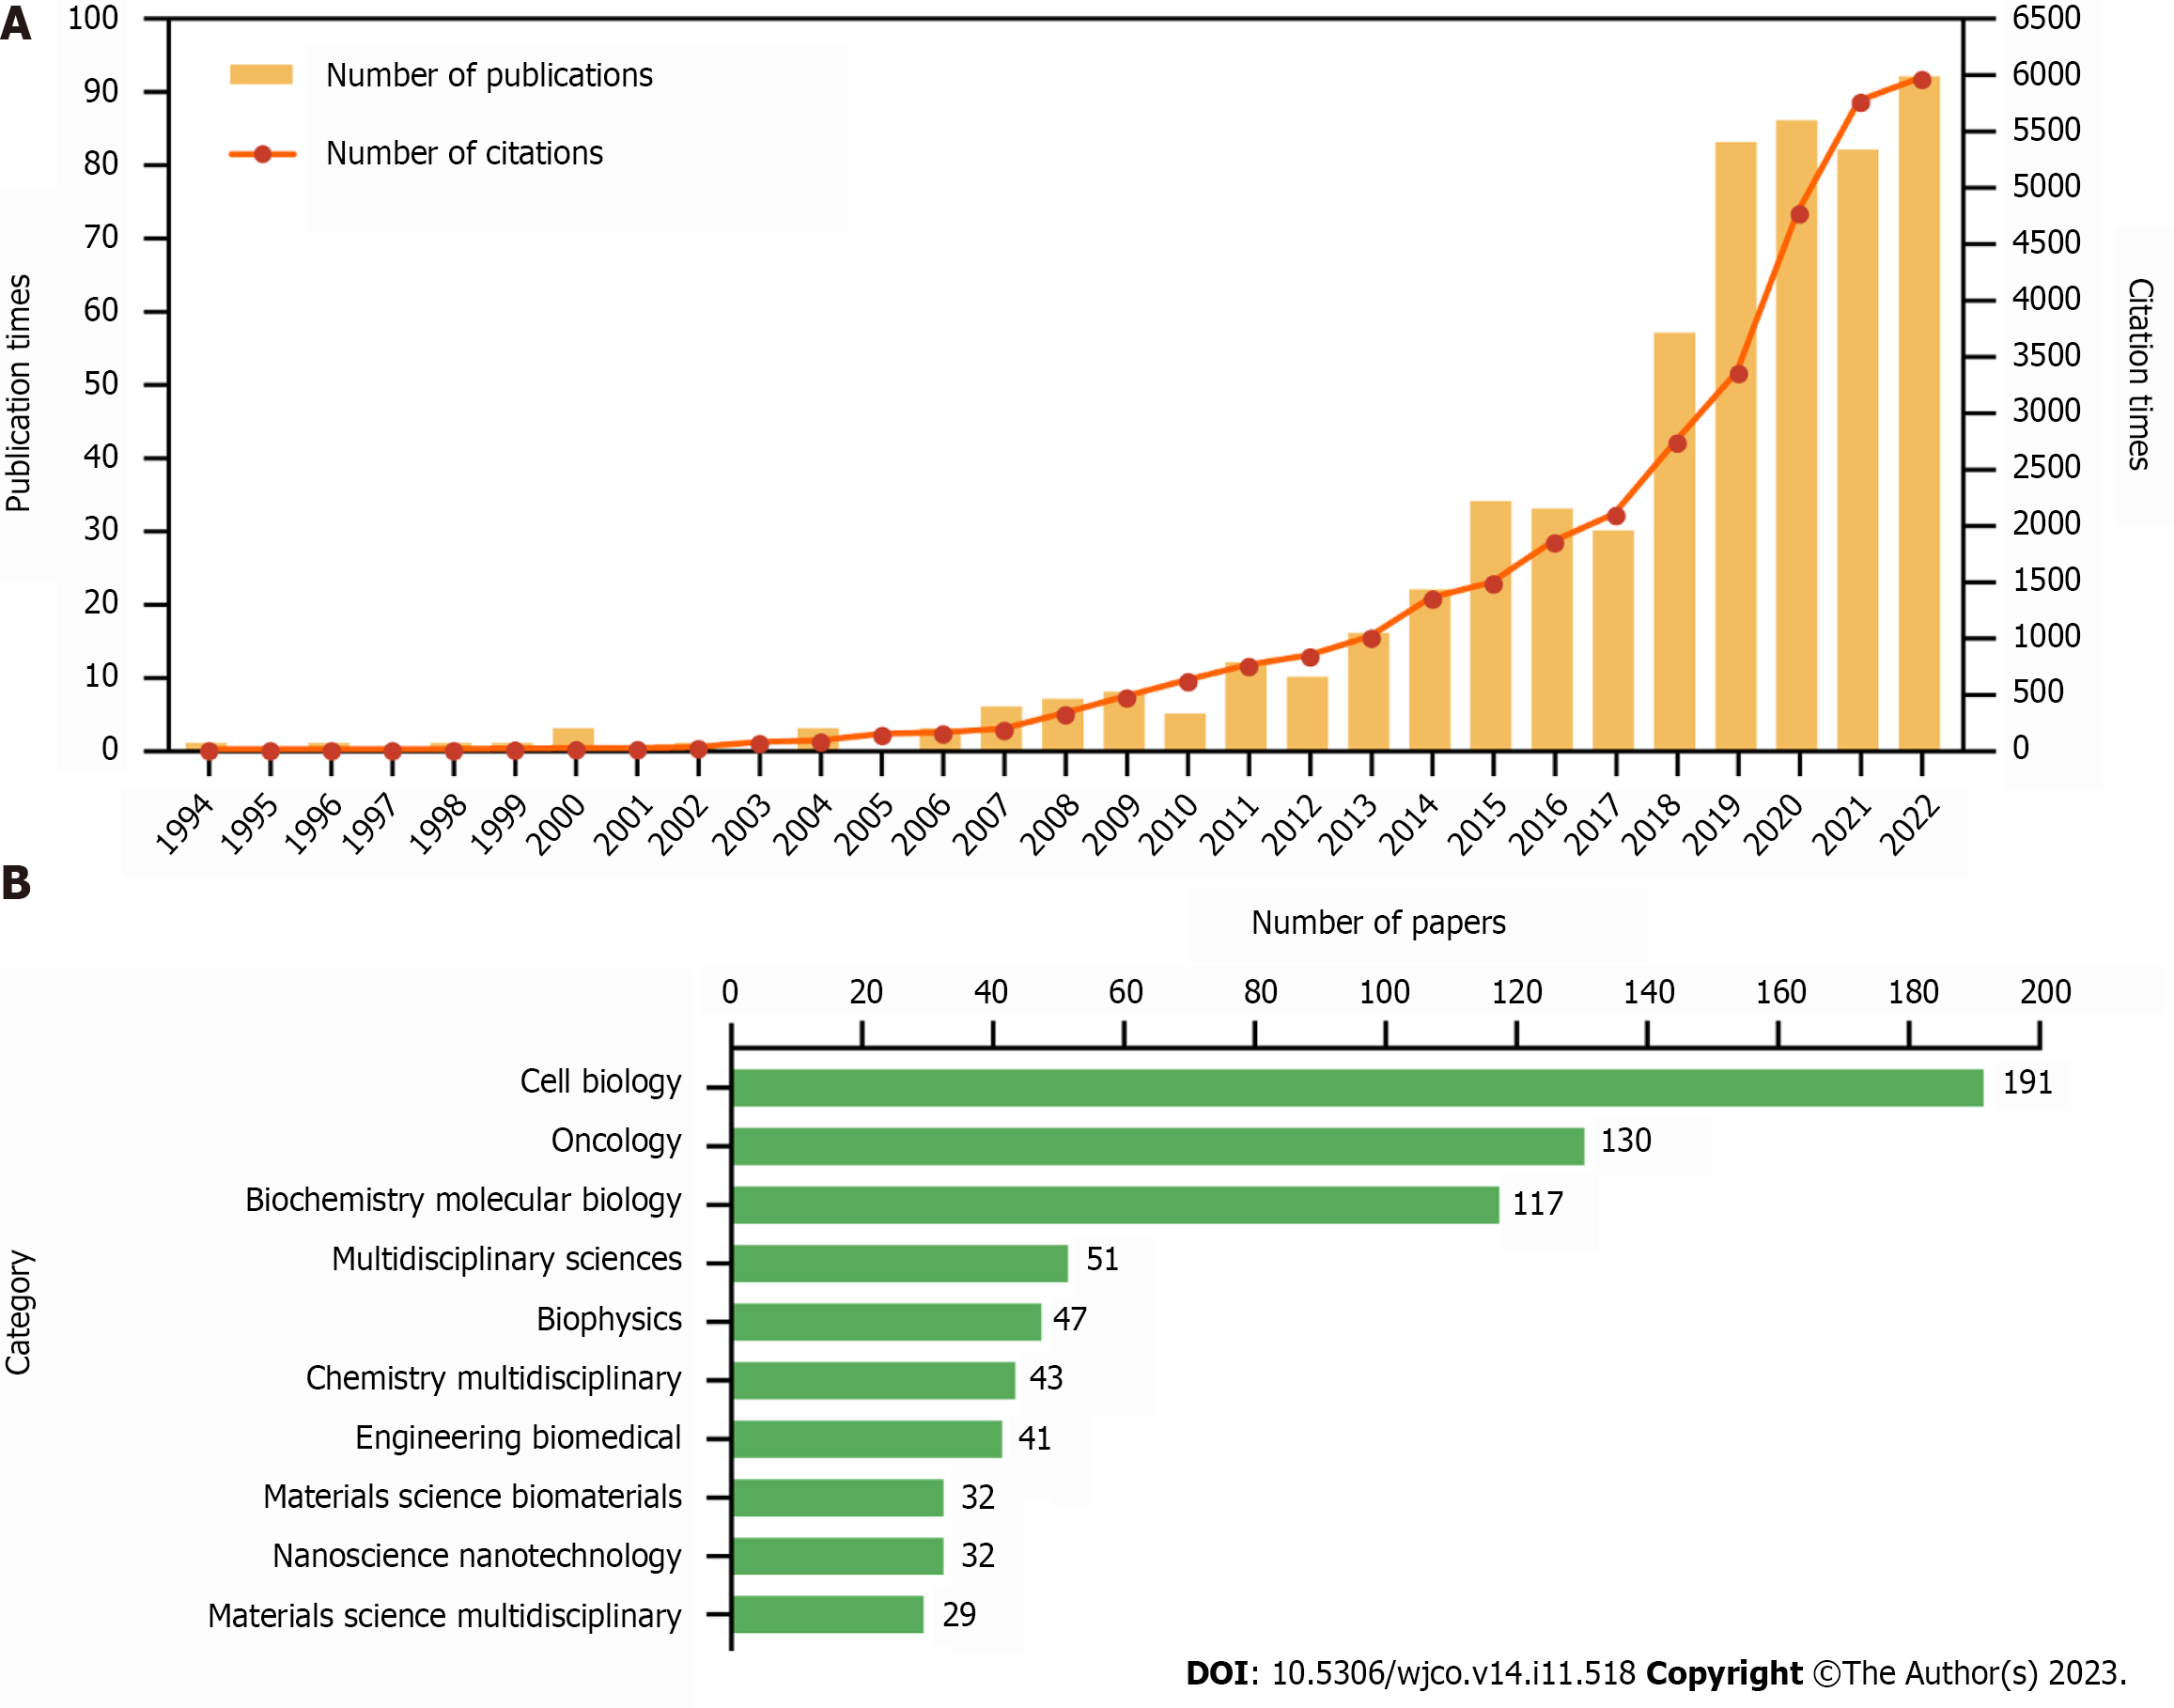
Figure 2 Trends and categories of publications about mechanotransduction in cancer.
A: The annual number of publications and citations from 1994 to 2022; B: The research categories of publications related to mechanotransduction in cancer.
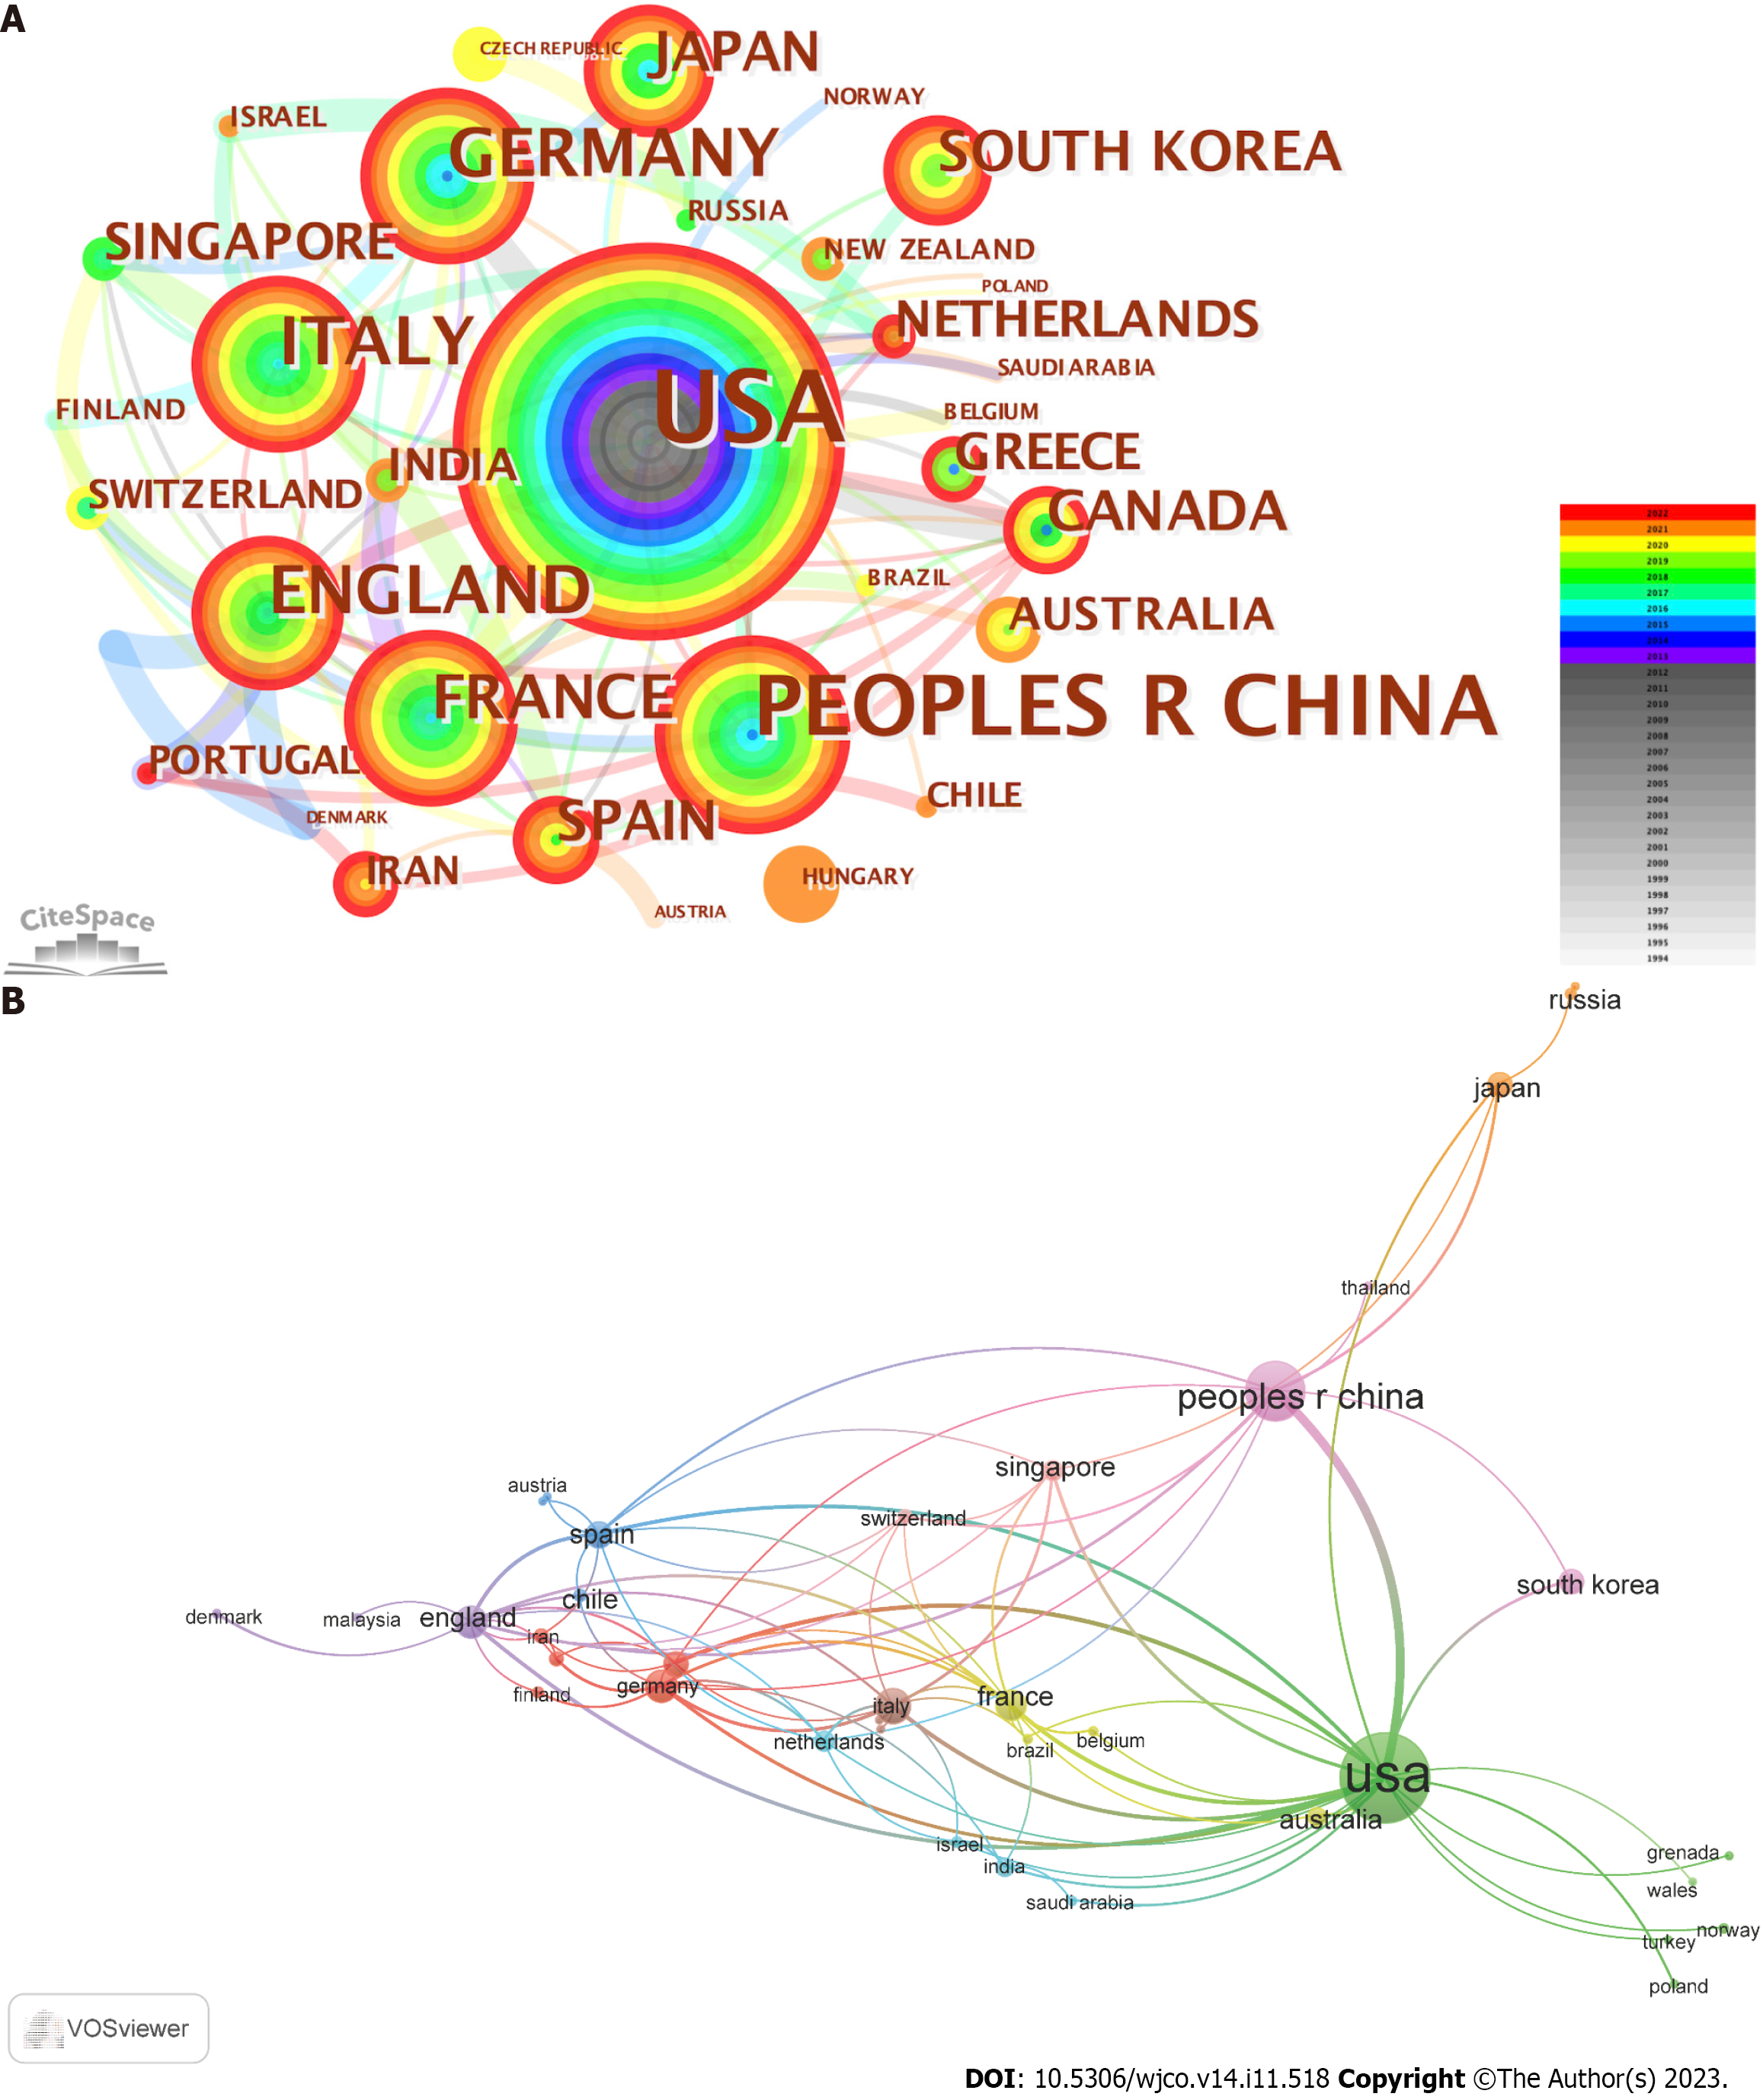
Figure 3 Analysis of countries working on mechanotransduction in cancer.
A: CiteSpace was used to conduct the cooperation network between countries. The number of publications is represented by the node size and the different publication years are indicated by the different colors; B: VOSviewer was used to visualize the cooperation between country network. The number of publications is represented by the size of the node and the connection strength is indicated by the line thickness.
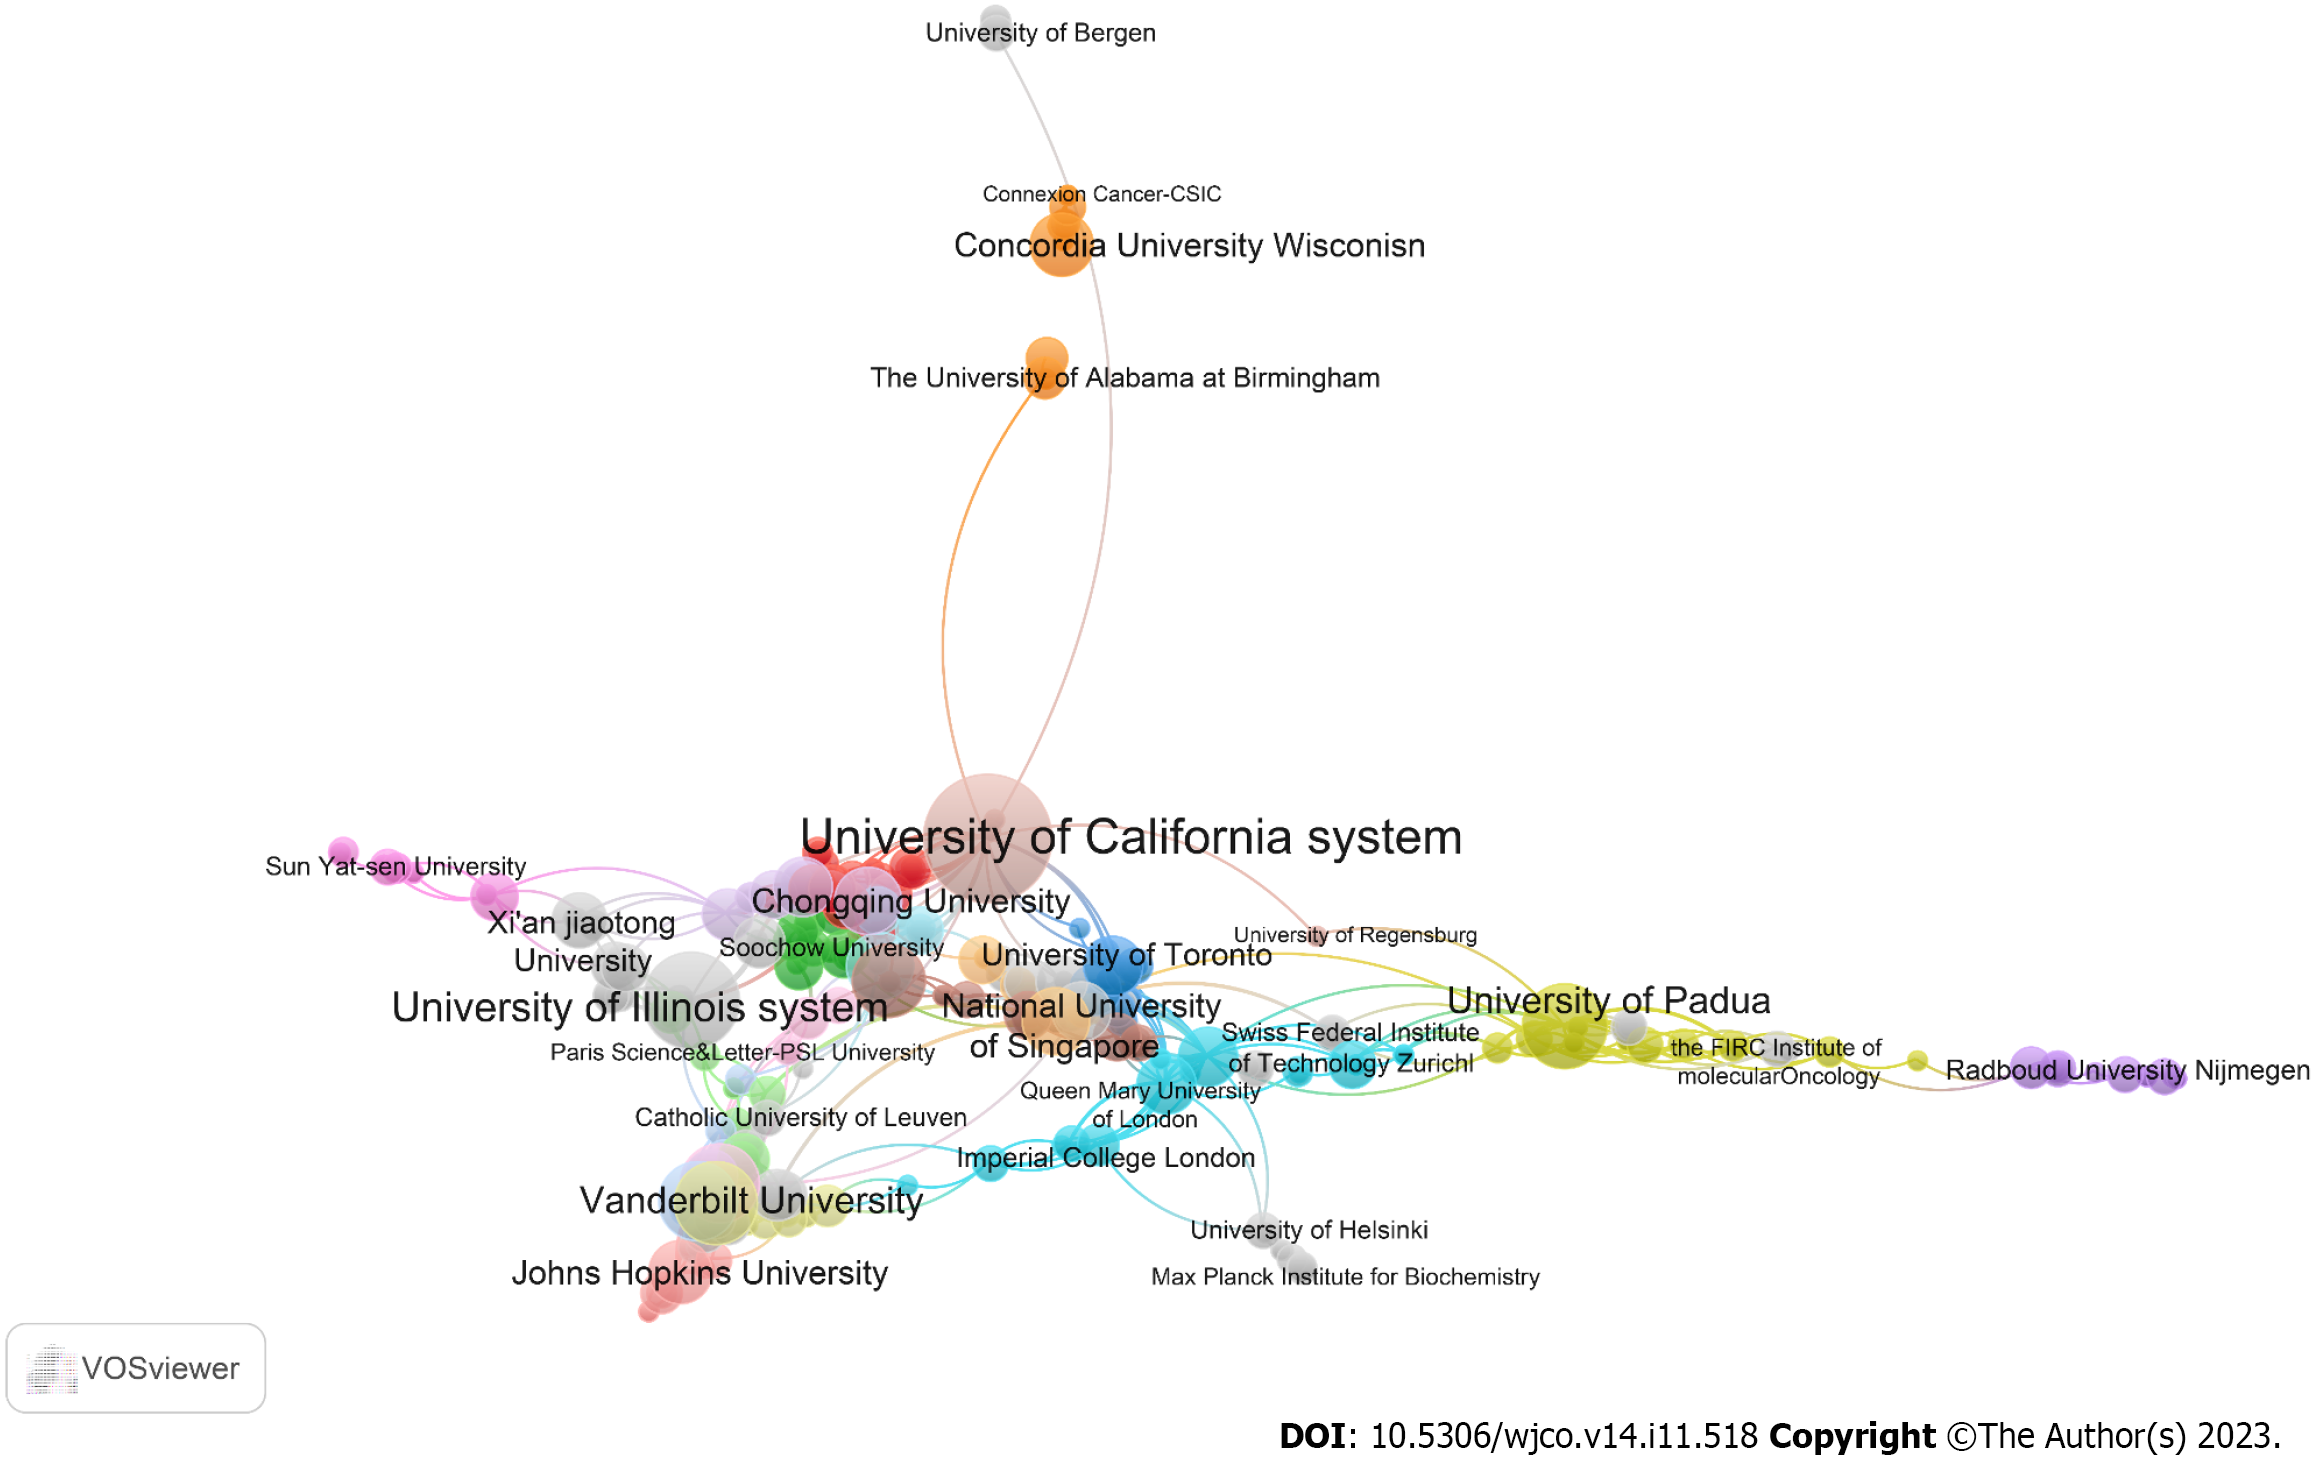
Figure 4 Network analysis of organizations.
The collaboration between organizations was analysed with VOSviewer.
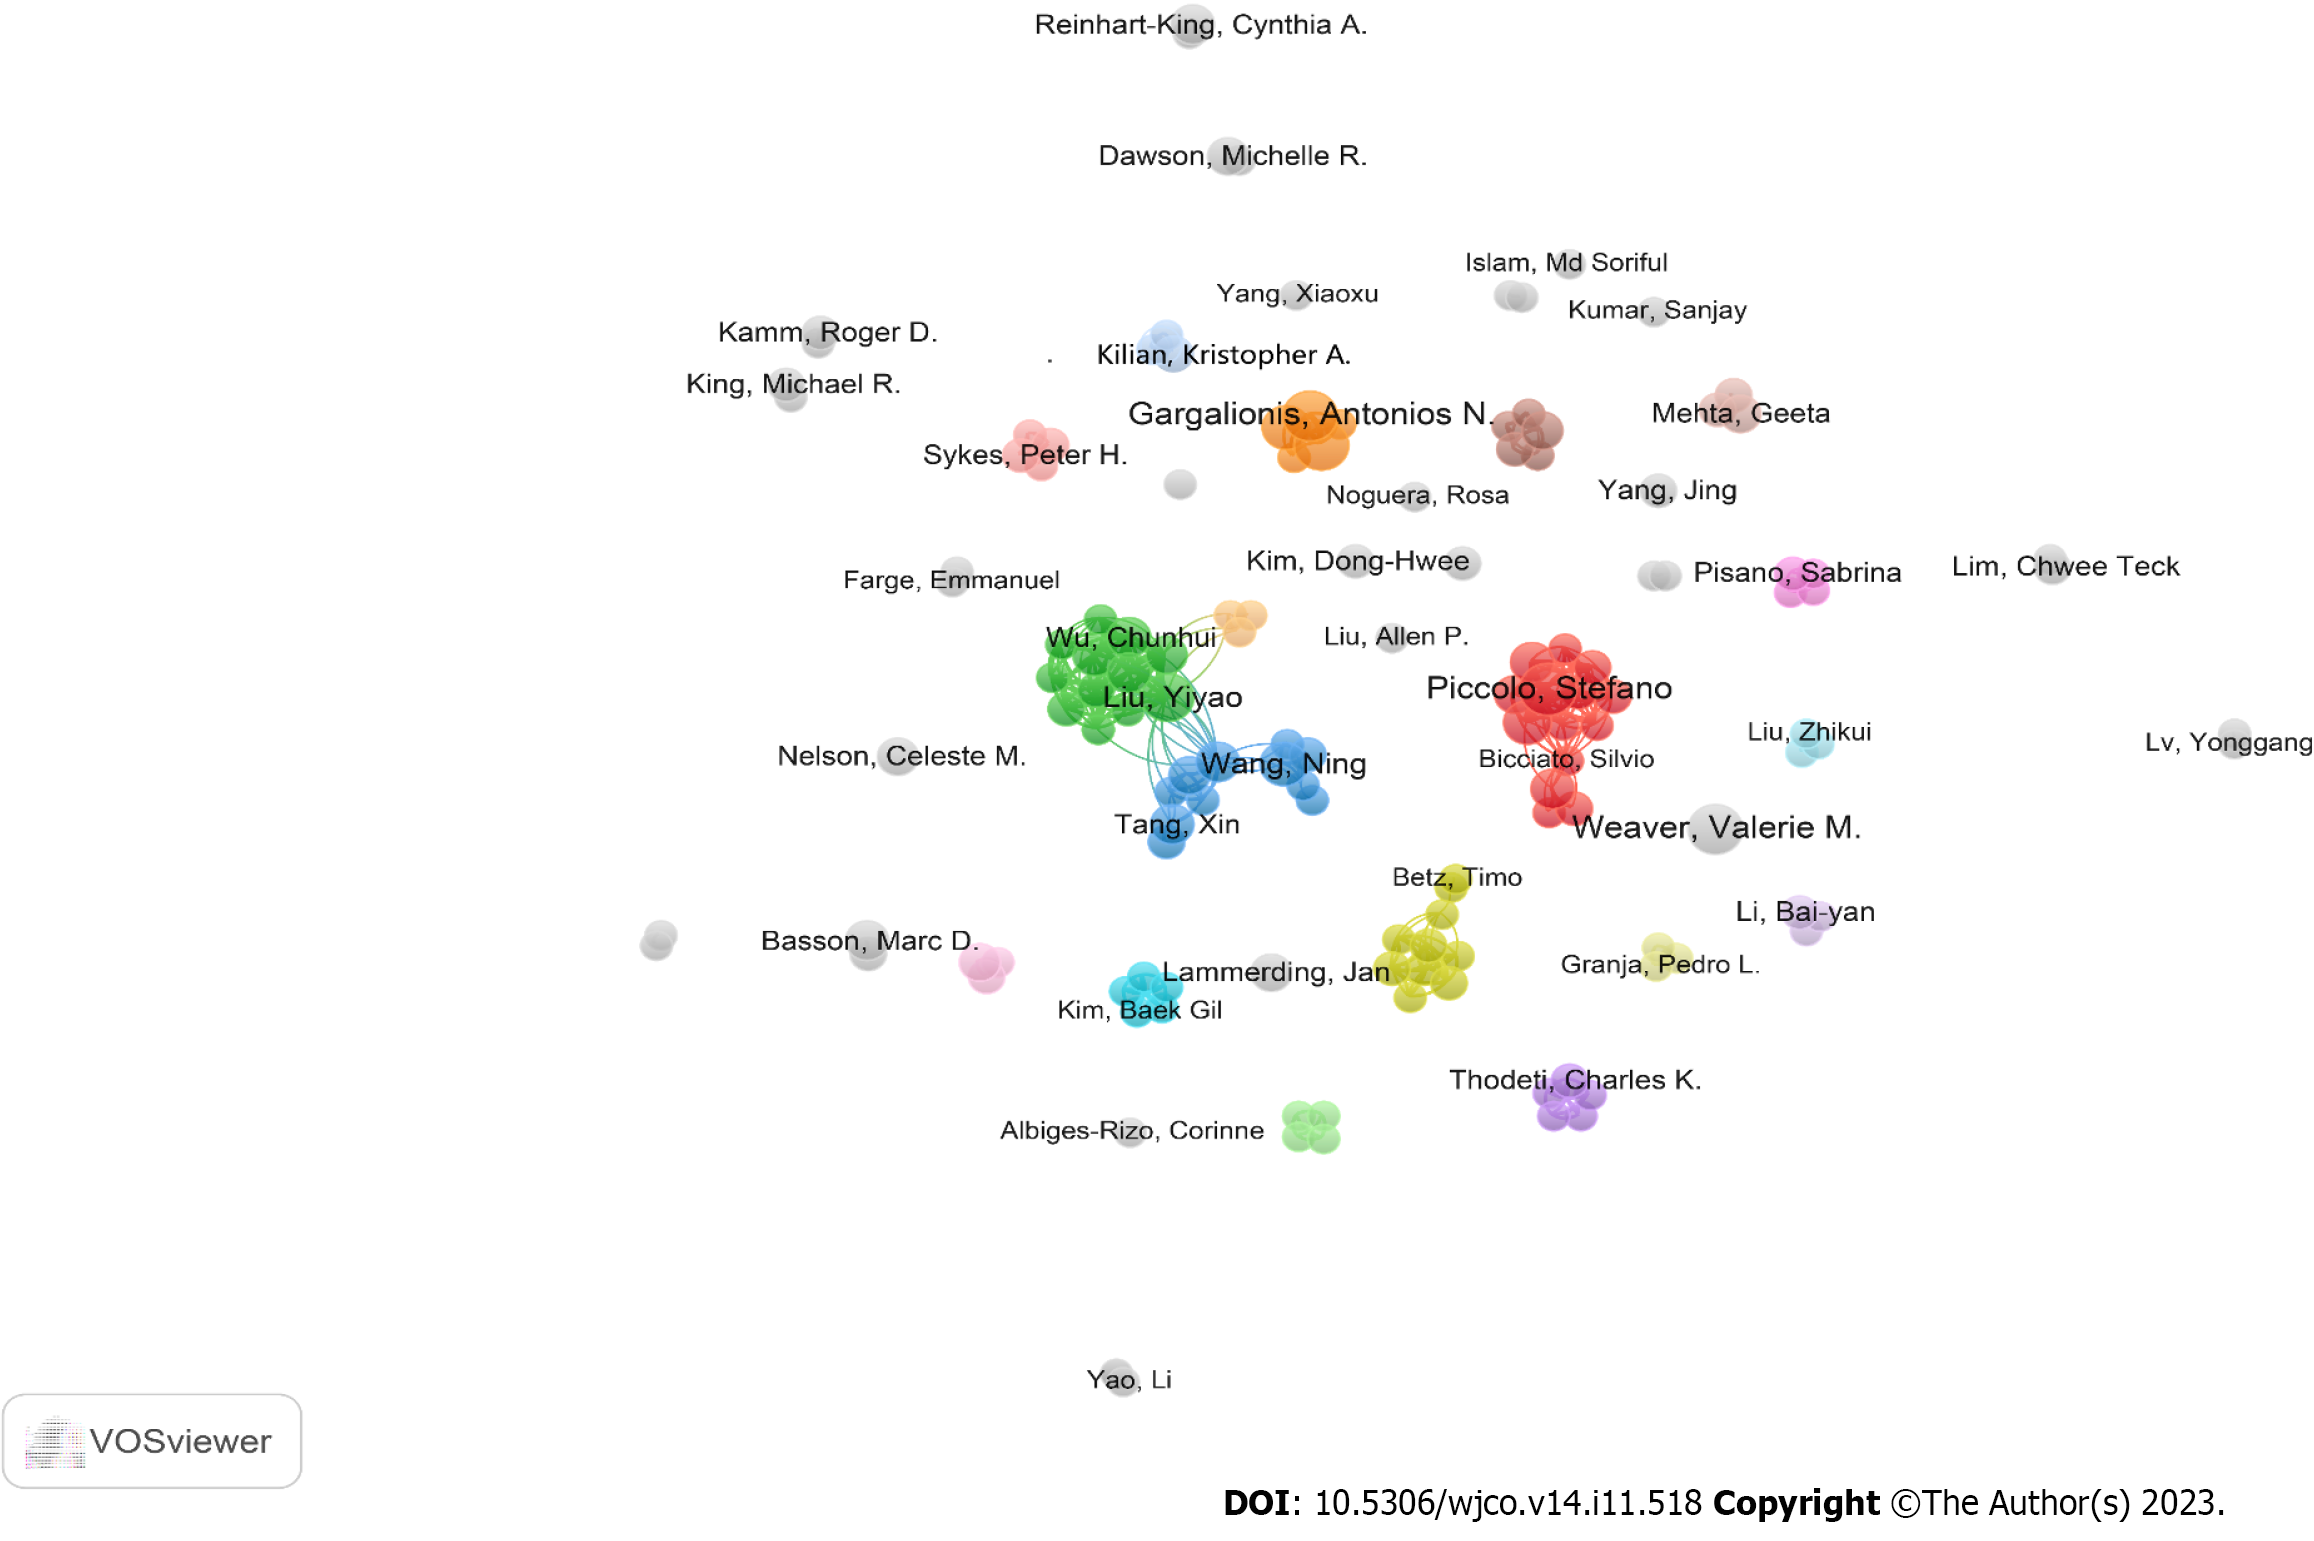
Figure 5 Visualization of author cooperation.
VOSviewer was used to visualize the co-authorship network. The clusters are indicated by the different colors and the lines represent the various collaborations between authors.
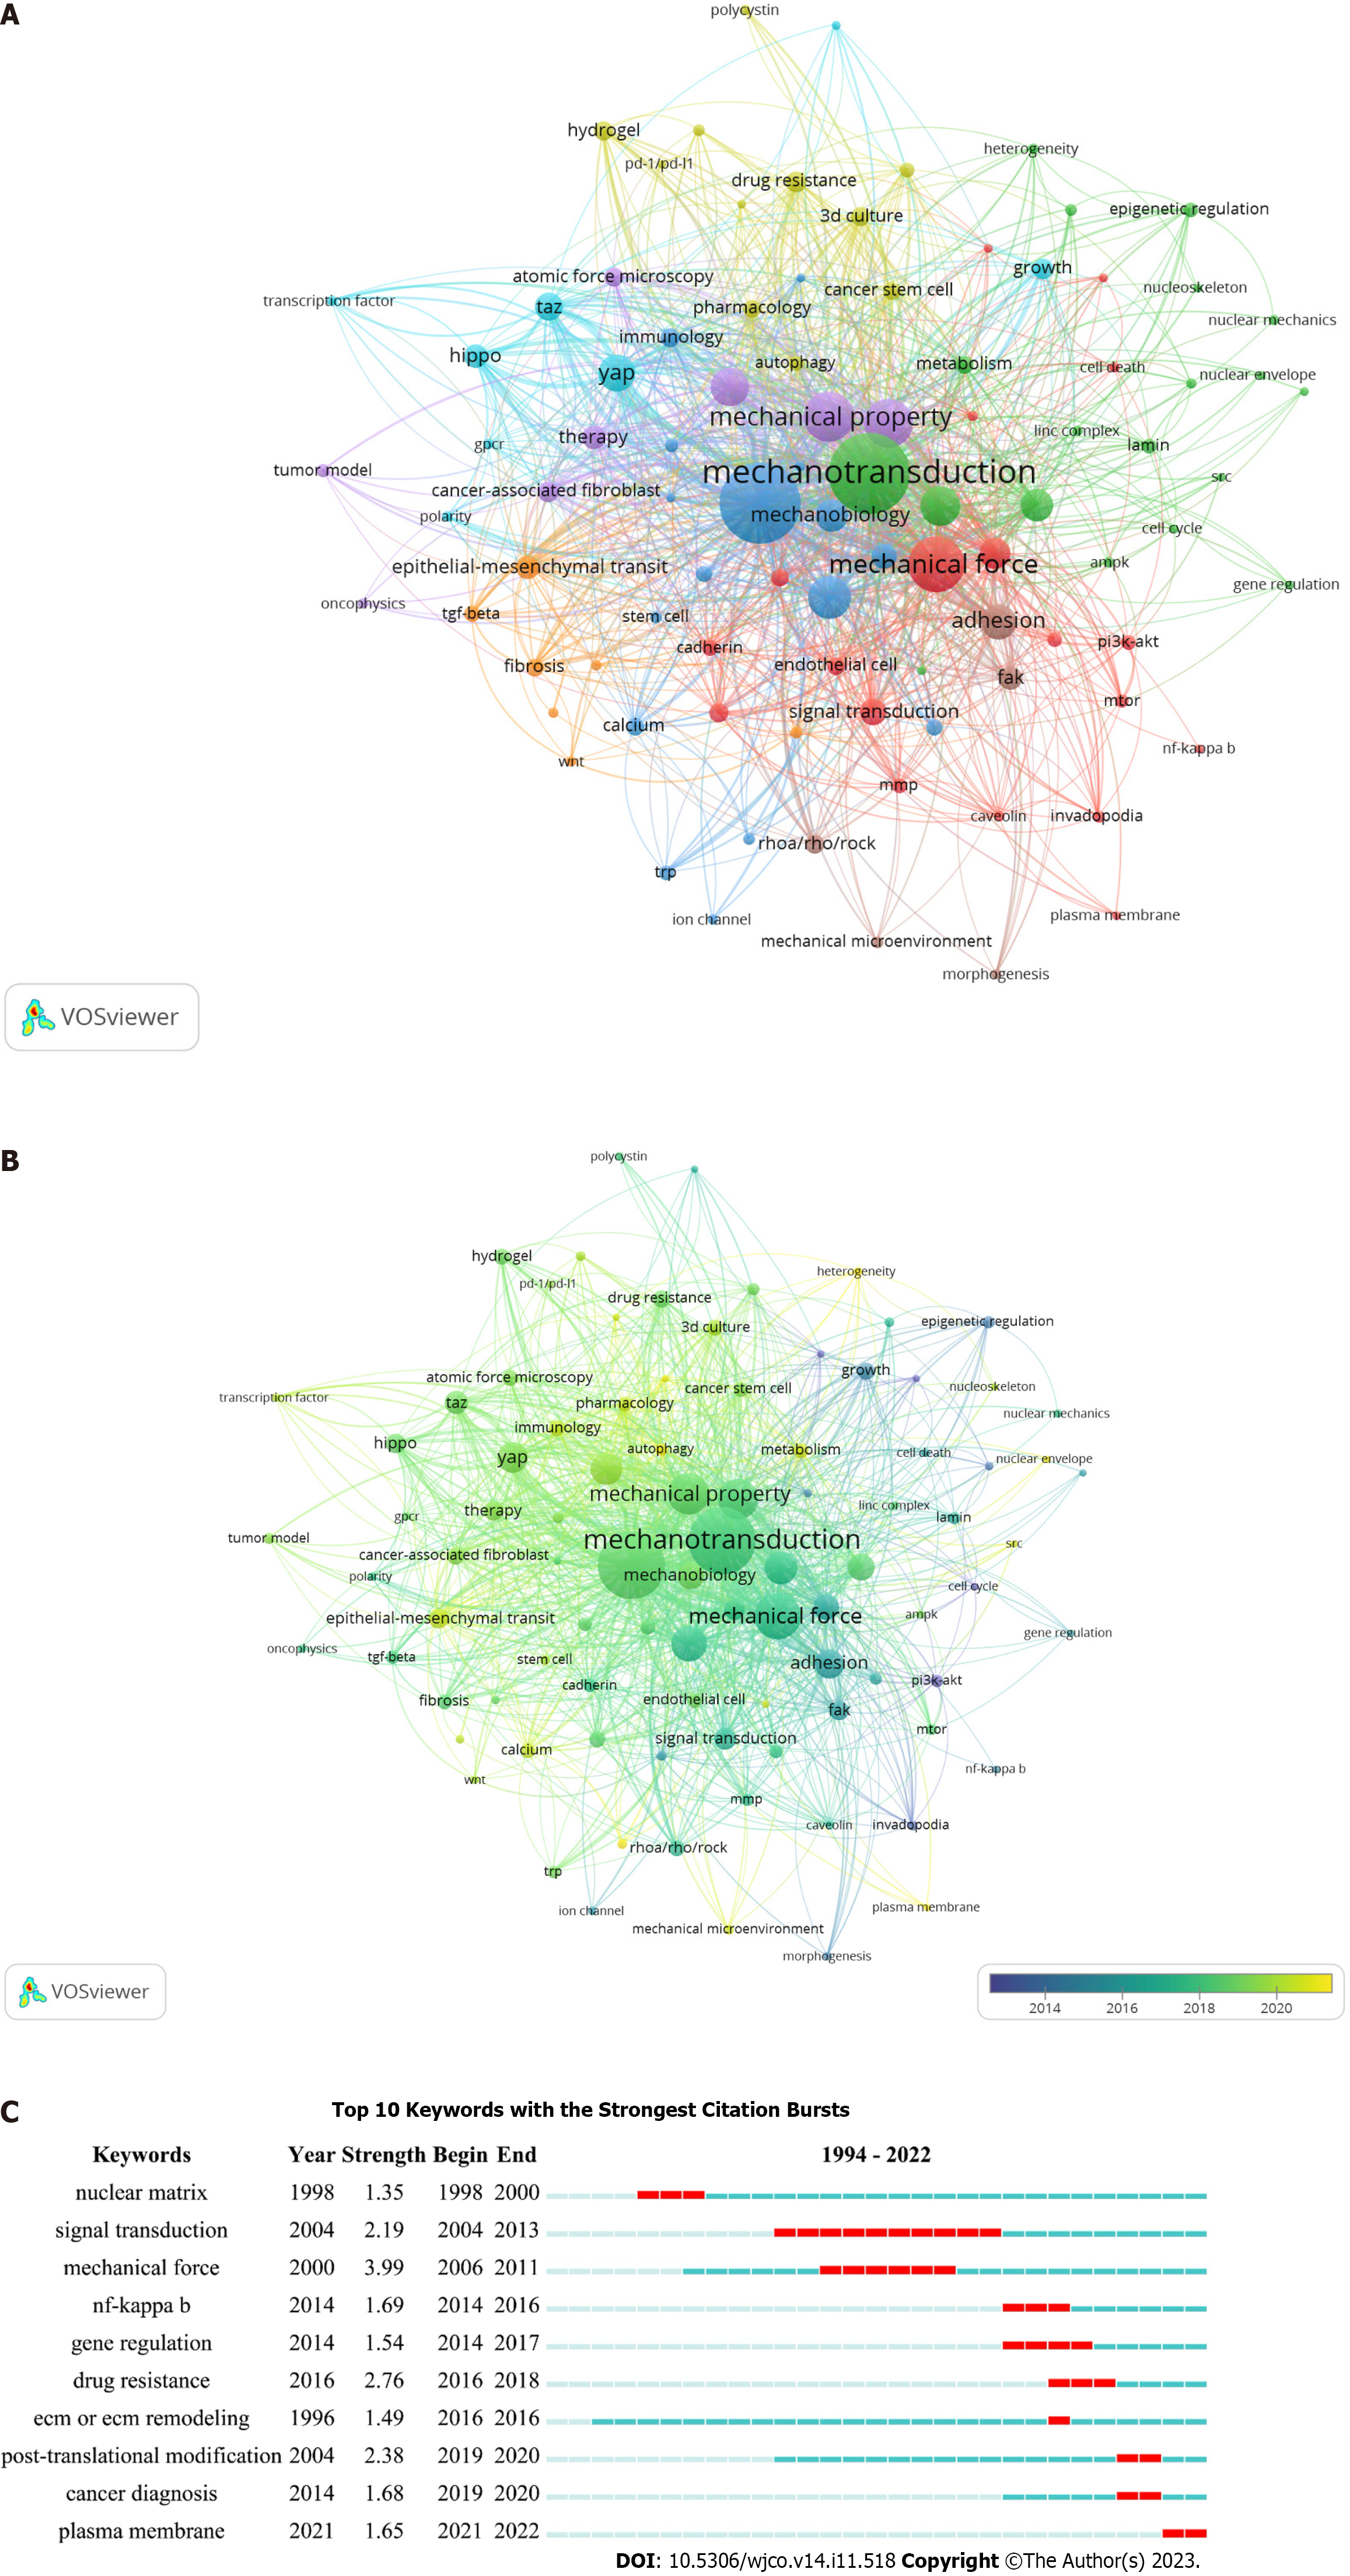
Figure 6 Keyword co-occurrence and burst analysis.
A: VOSviewer was applied in our keyword co-occurrence analysis. The colors indicate different clusters and the node size indicates the number of publications; B: A keyword overlay was visualized with VOSviewer. The circle size reflects the number of publications and the average published year is shown by different colored circles; C: CiteSpace was used to conduct the keyword burst analysis. The red rectangles represent the duration of a keyword.
- Citation: Zhang YZ, Li MZ, Wang GX, Wang DW. Bibliometric analysis of the global research status and trends of mechanotransduction in cancer. World J Clin Oncol 2023; 14(11): 518-534
- URL: https://www.wjgnet.com/2218-4333/full/v14/i11/518.htm
- DOI: https://dx.doi.org/10.5306/wjco.v14.i11.518


