Copyright
©The Author(s) 2022.
World J Clin Oncol. Aug 24, 2022; 13(8): 675-687
Published online Aug 24, 2022. doi: 10.5306/wjco.v13.i8.675
Published online Aug 24, 2022. doi: 10.5306/wjco.v13.i8.675
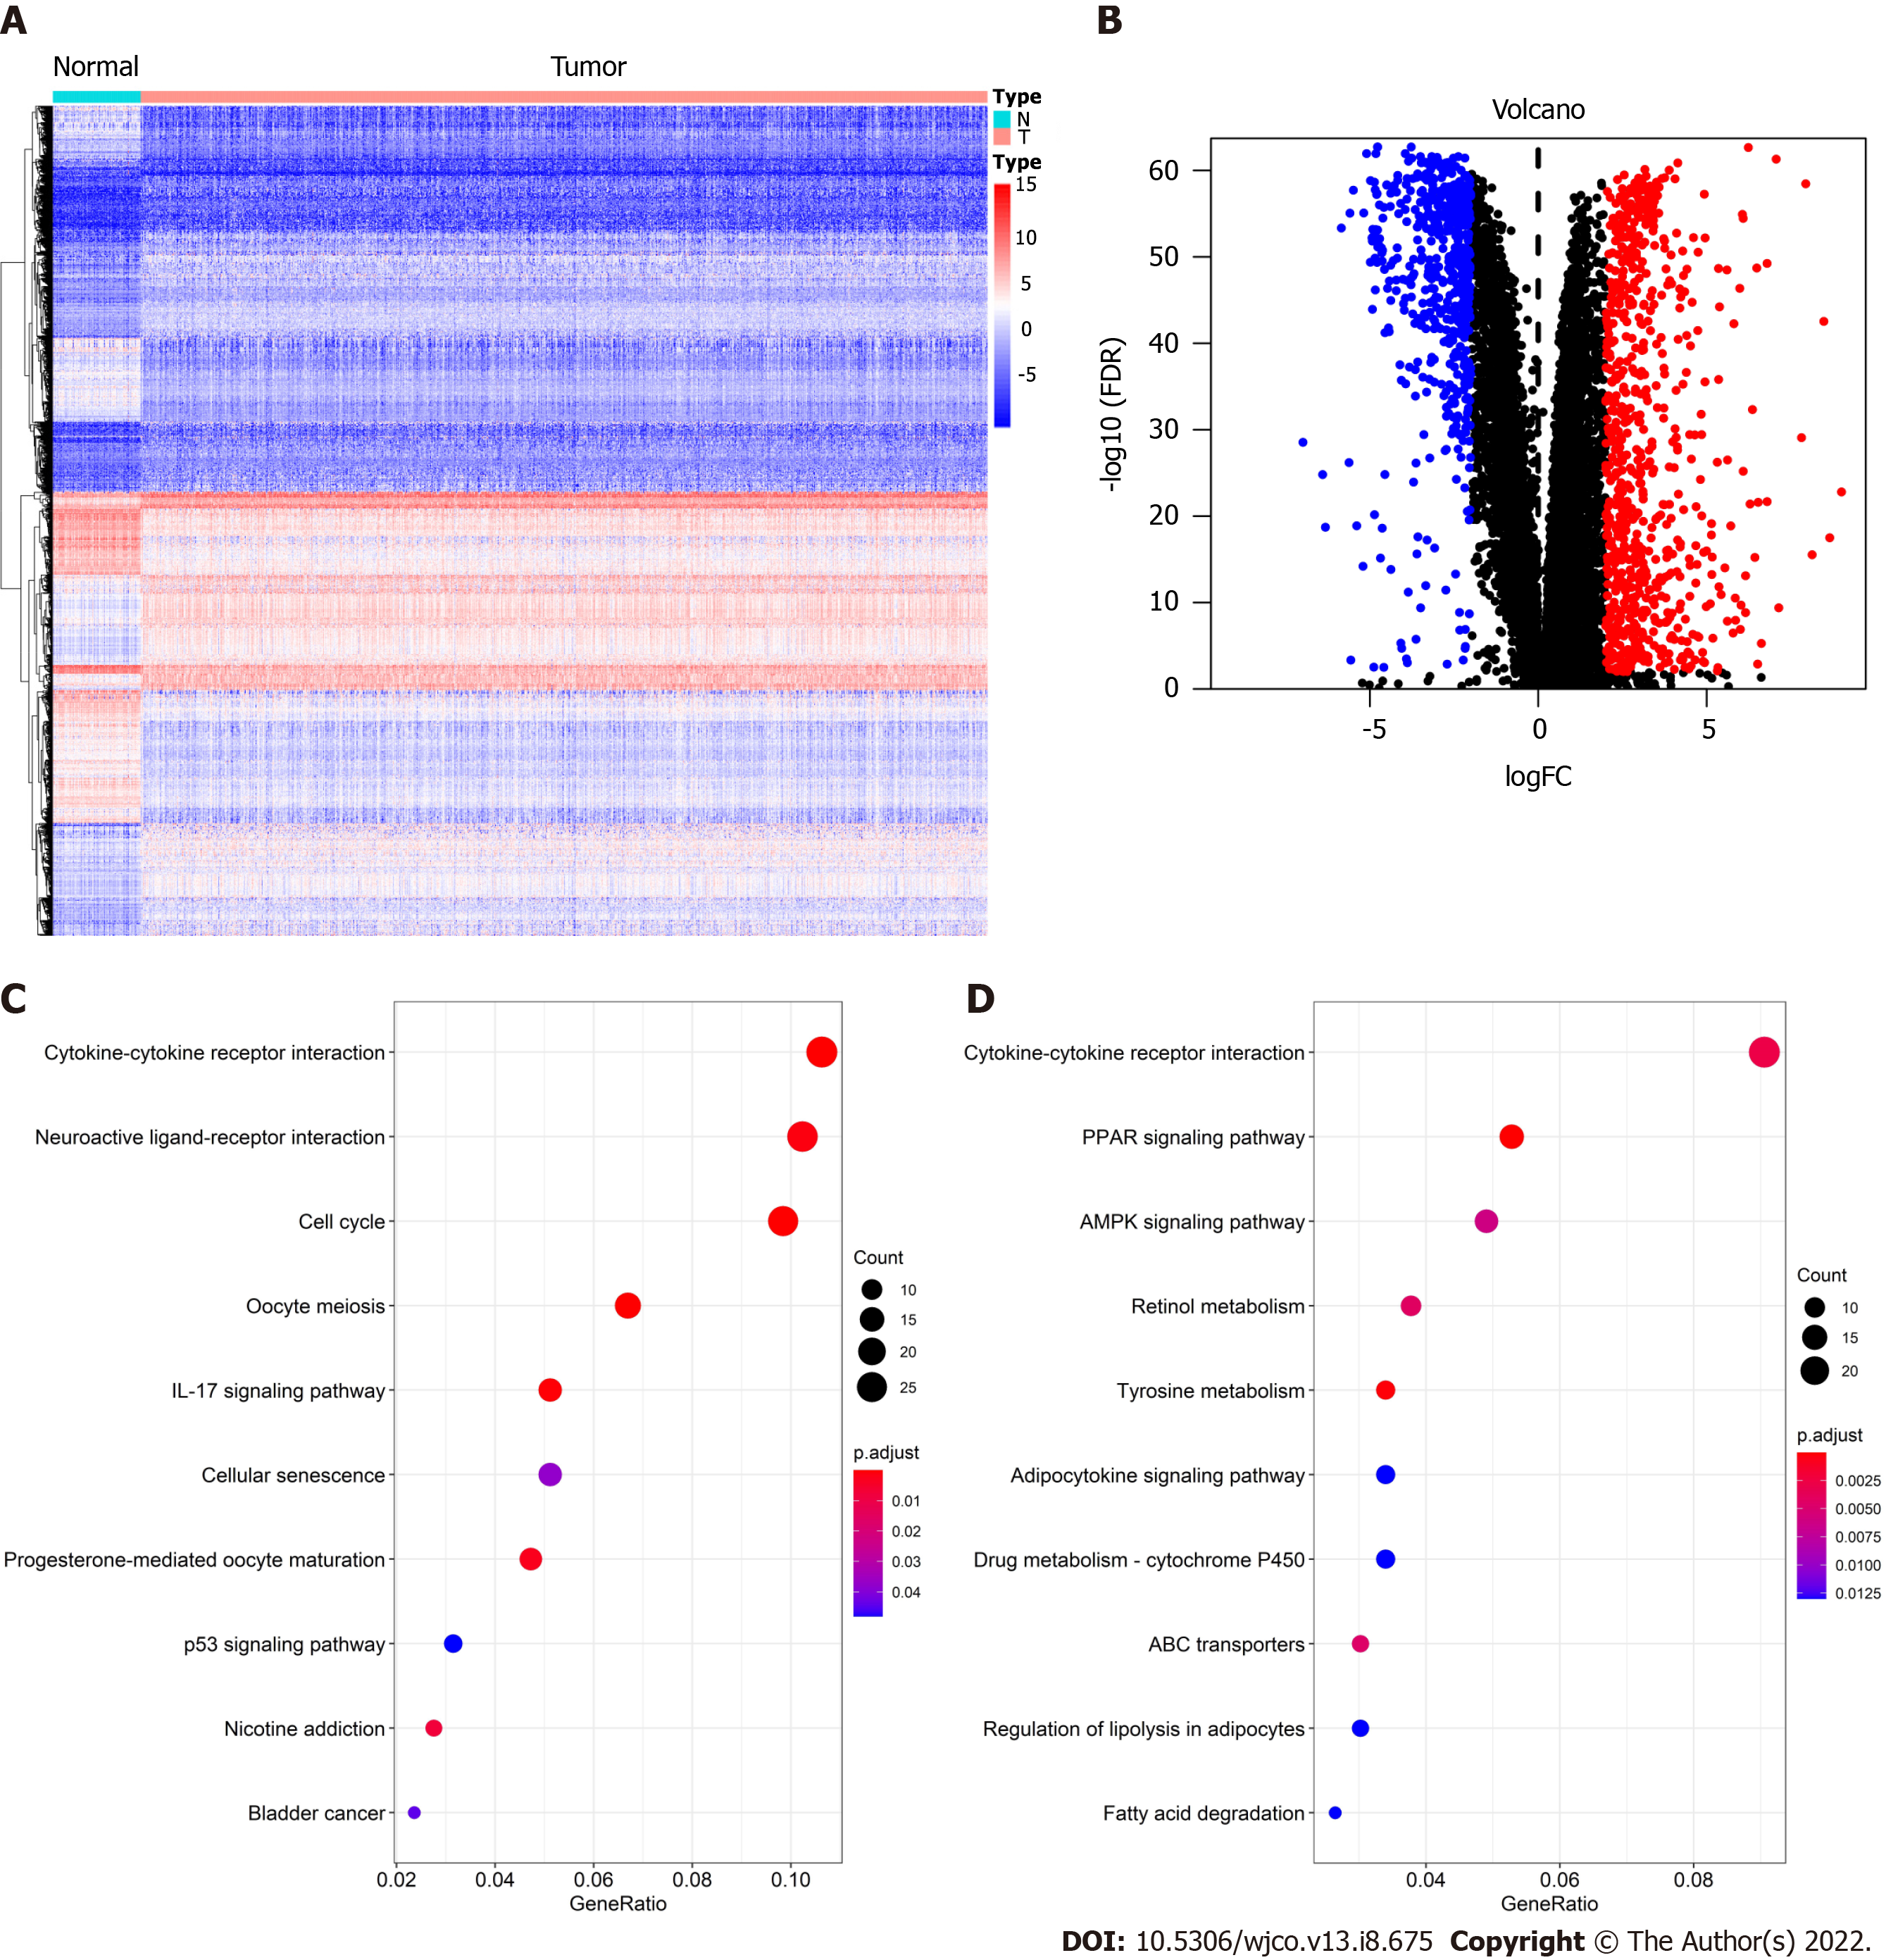
Figure 1 Screening and functional enrichment analysis of differentially expressed genes.
A: Heat map of differentially expressed genes (DEGs); B: Volcano Plot of DEGs; C: Kyoto Encyclopedia of Genes and Genomes (KEGG) enrichment analysis of upregulated genes; D: KEGG enrichment analysis of downregulated genes.
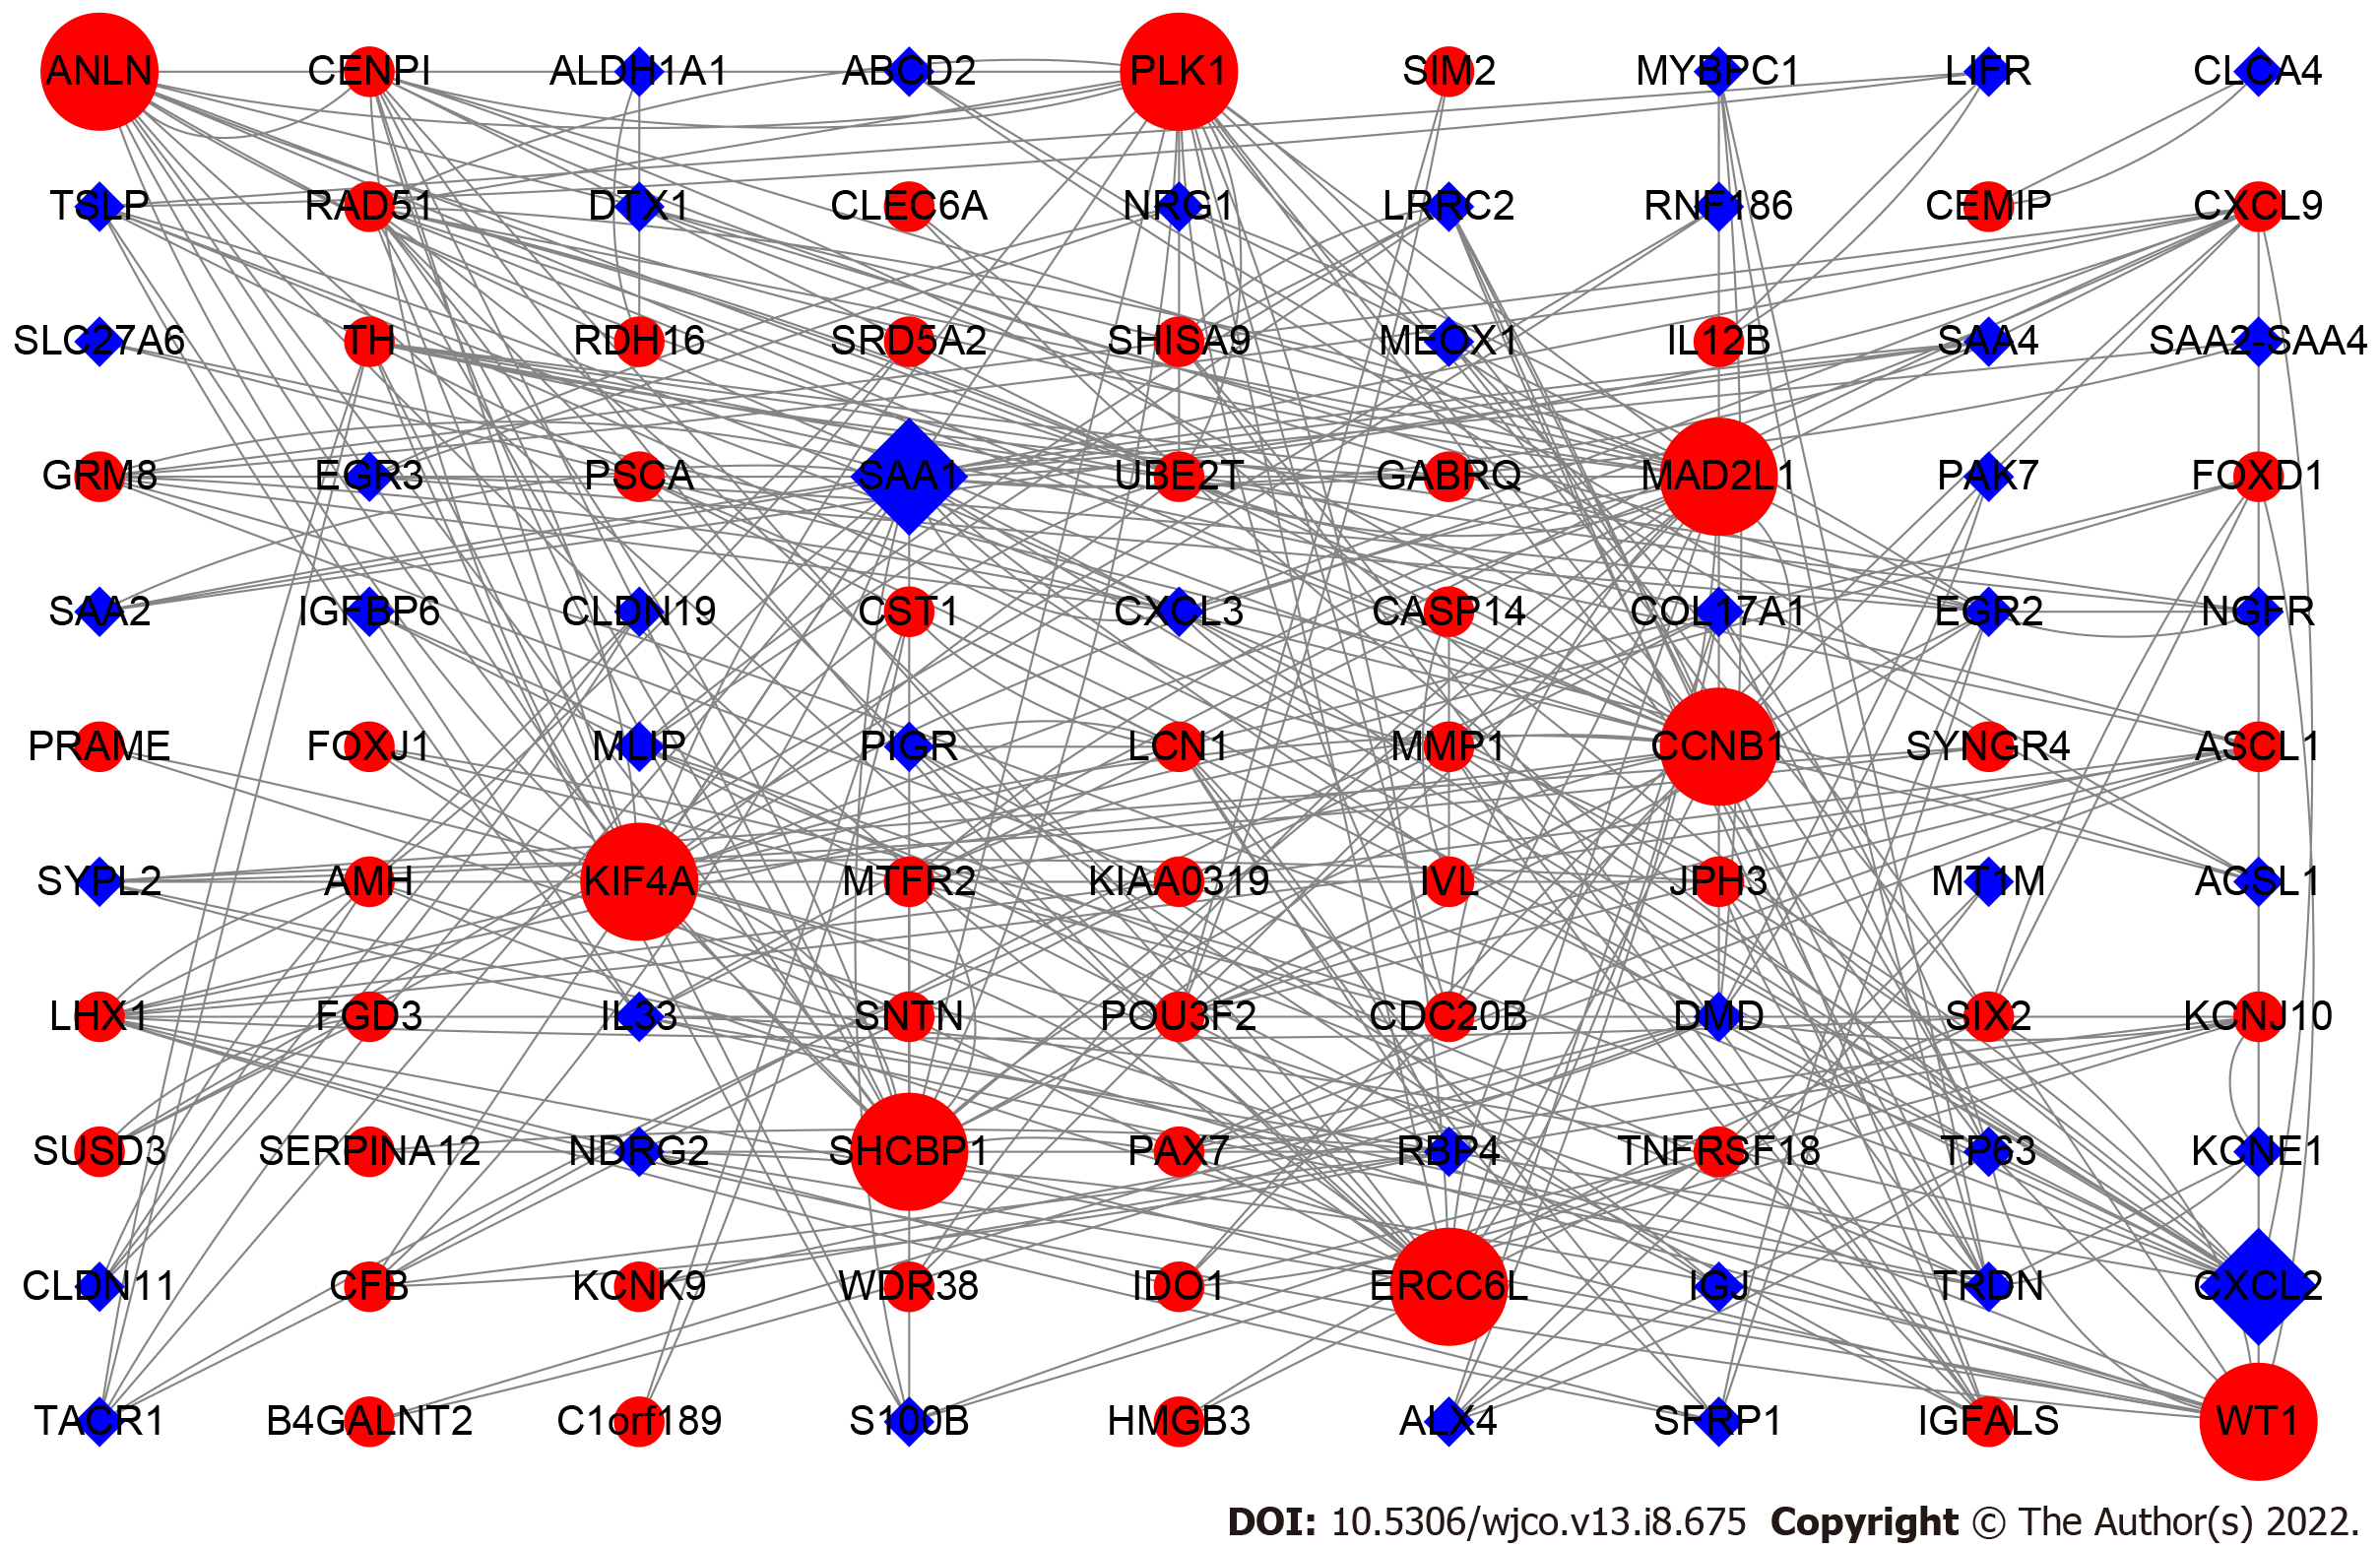
Figure 2 Protein-protein interaction network analysis of prognosis related differentially expressed genes.
The upregulated genes are represented by red and round nodes, whereas the downregulated genes are represented by blue and diamond nodes. The size of the node represents their grade.
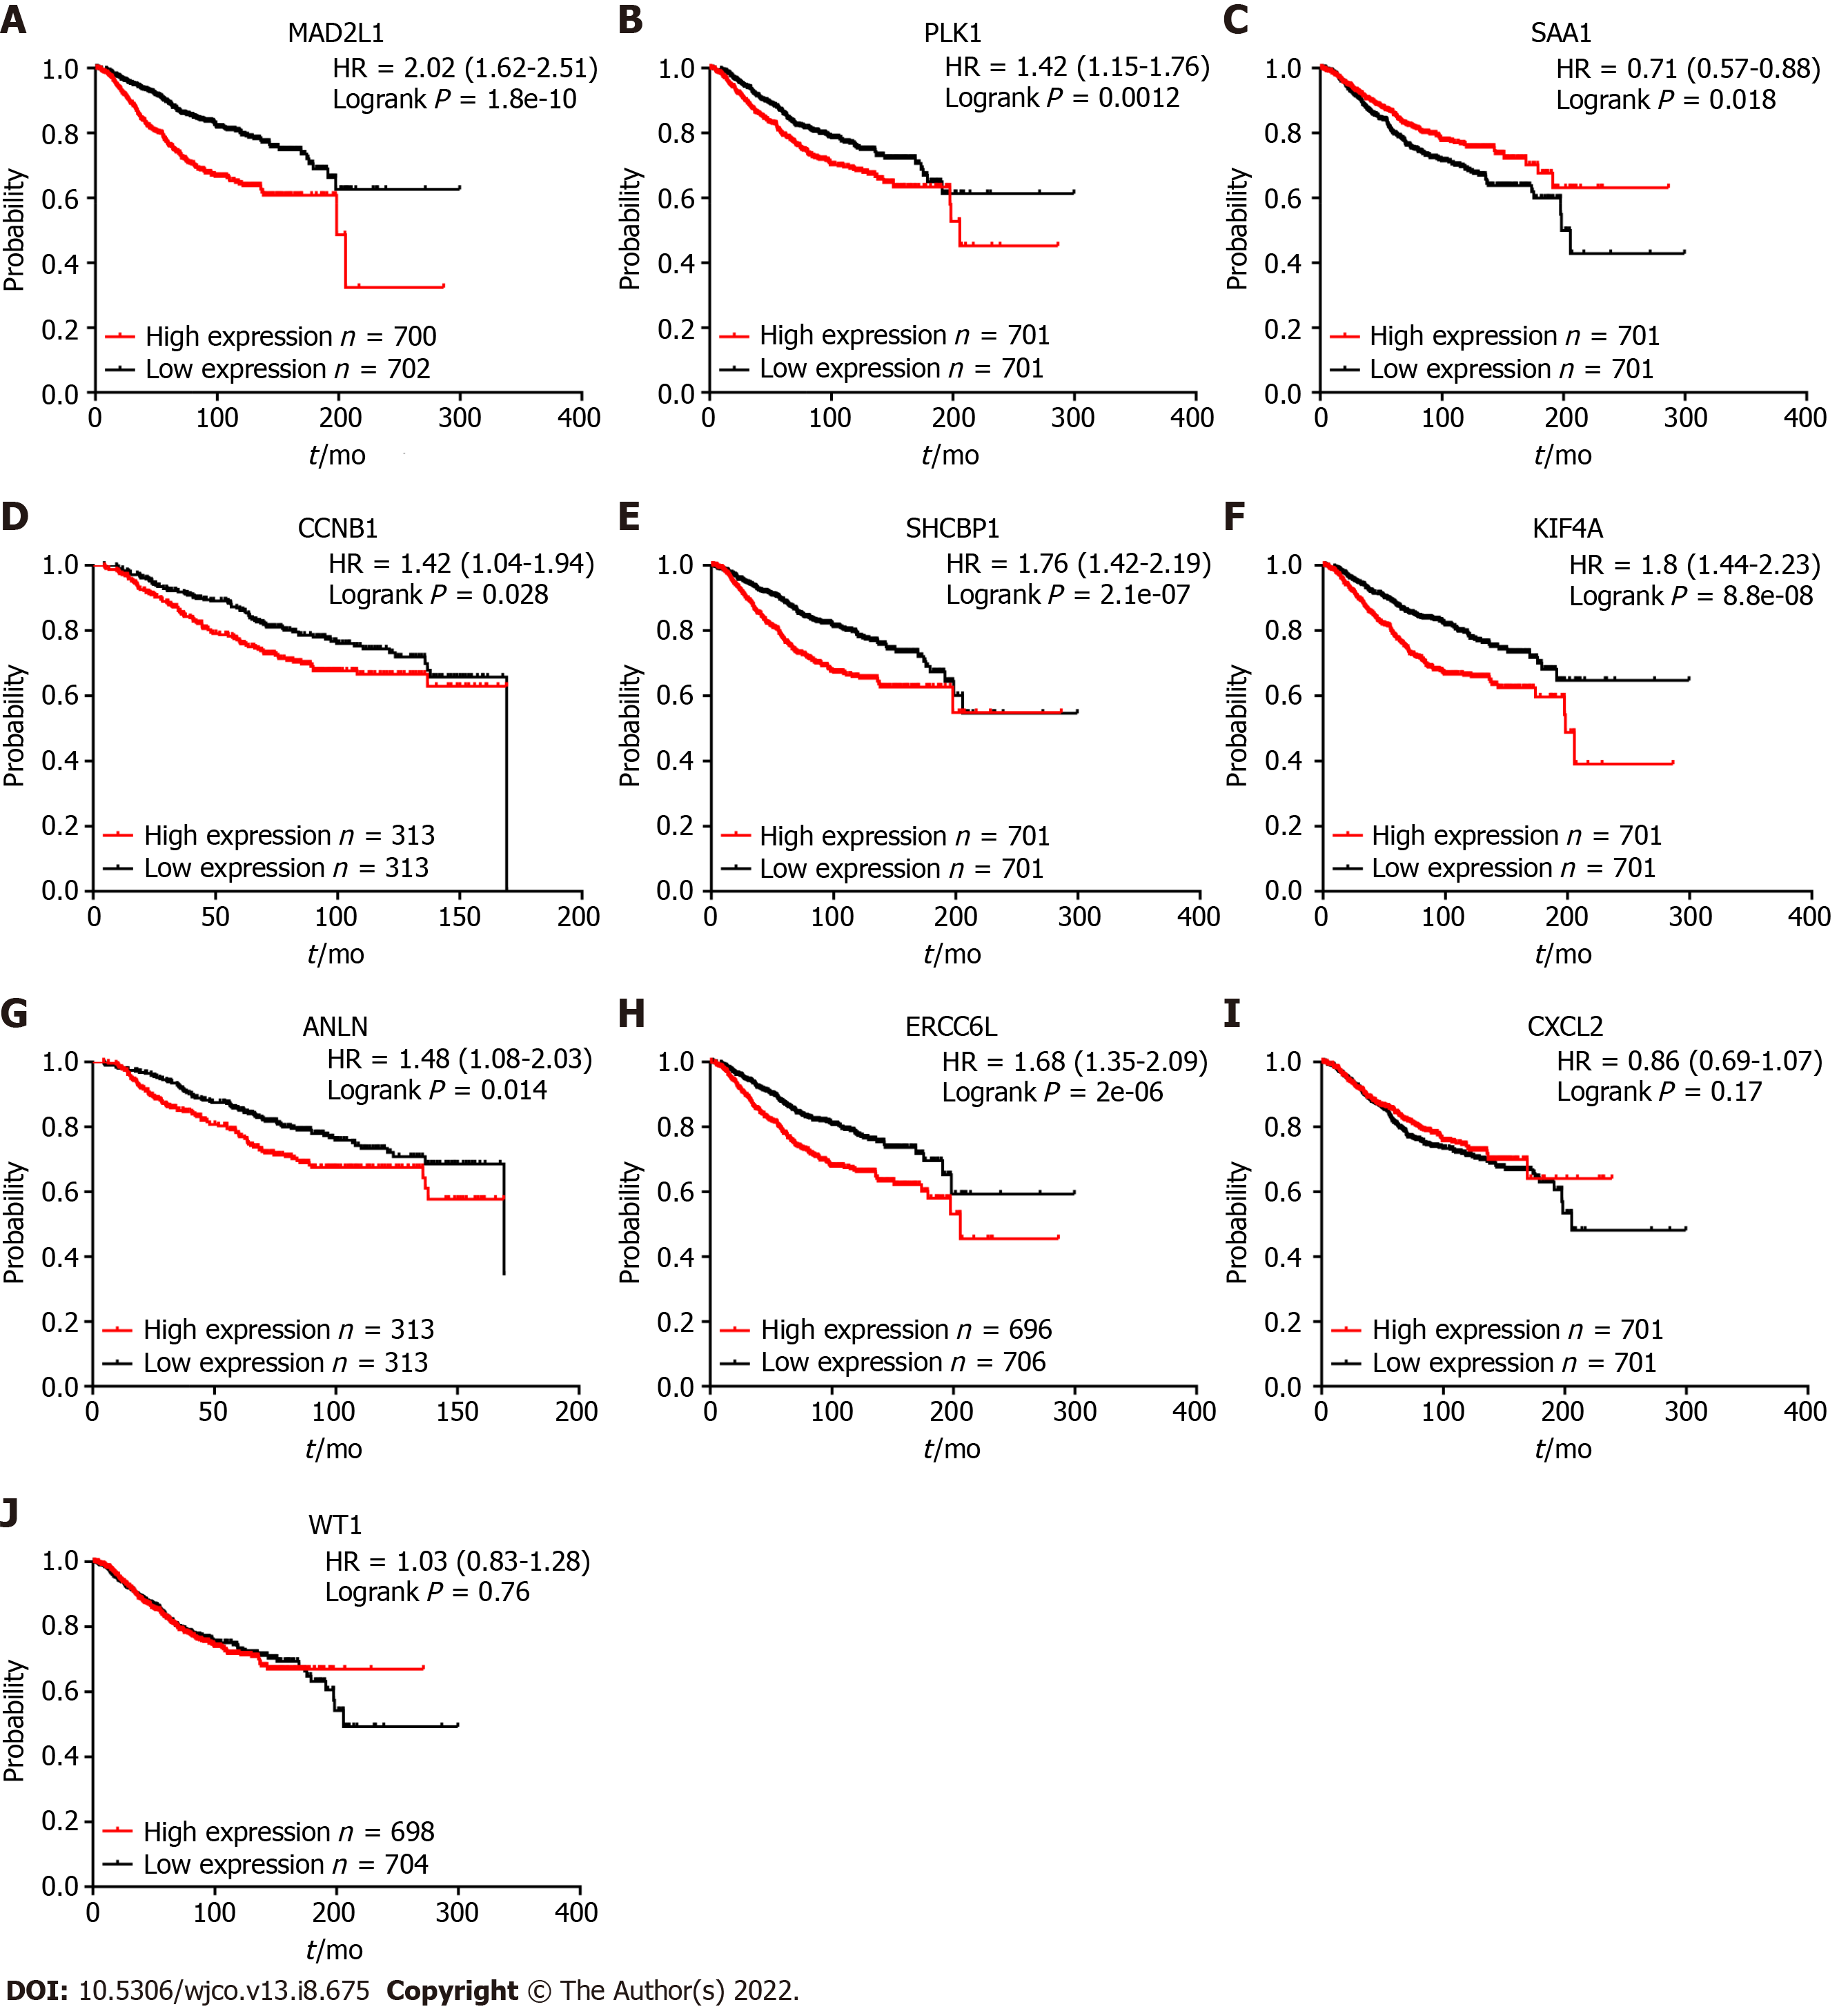
Figure 3 Survival analyses of the 10 hub genes were verified by Kaplan-Meier plotter.
Figure 4 Subtype survival analysis of these 10 hub genes in breast cancer patients among The Cancer Genome Atlas cohort.
The results are presented by a heatmap and the detailed value on each cell represent the hazard ratio of survival plot.
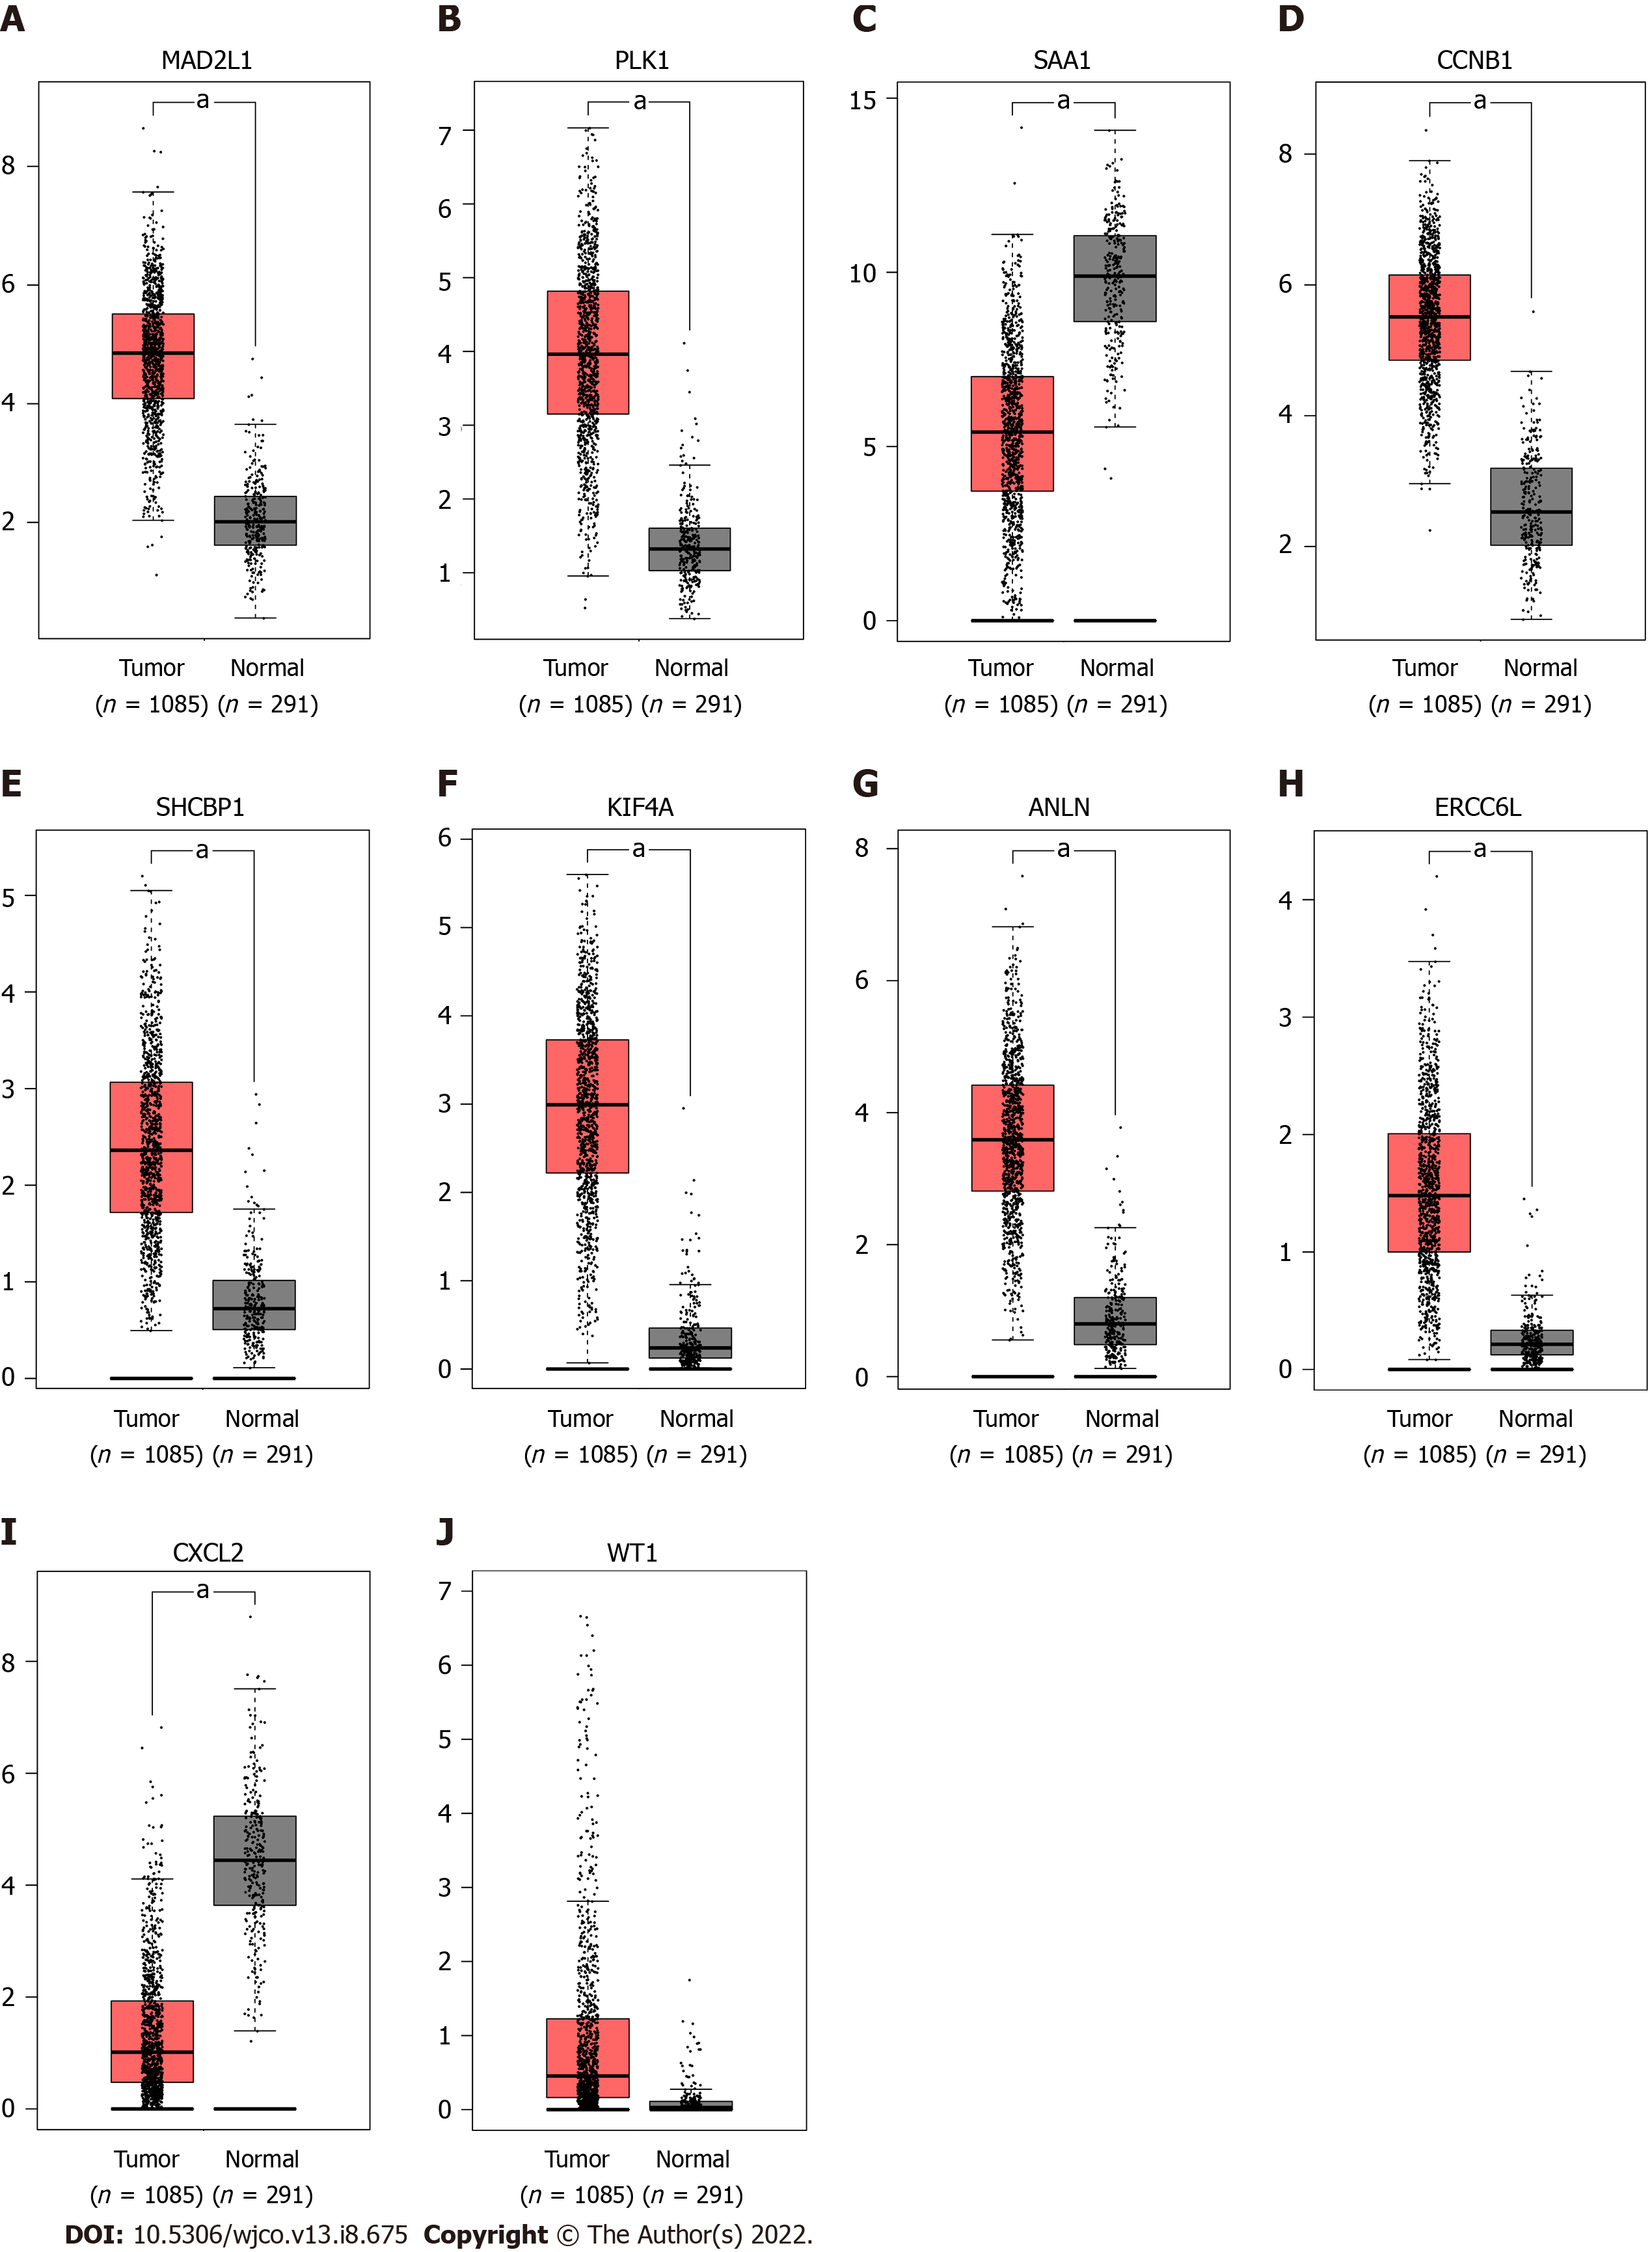
Figure 5 mRNA expression of the 10 hub genes were verified by the Gene Expression Profiling Interactive Analysis database.
aP < 0.05.
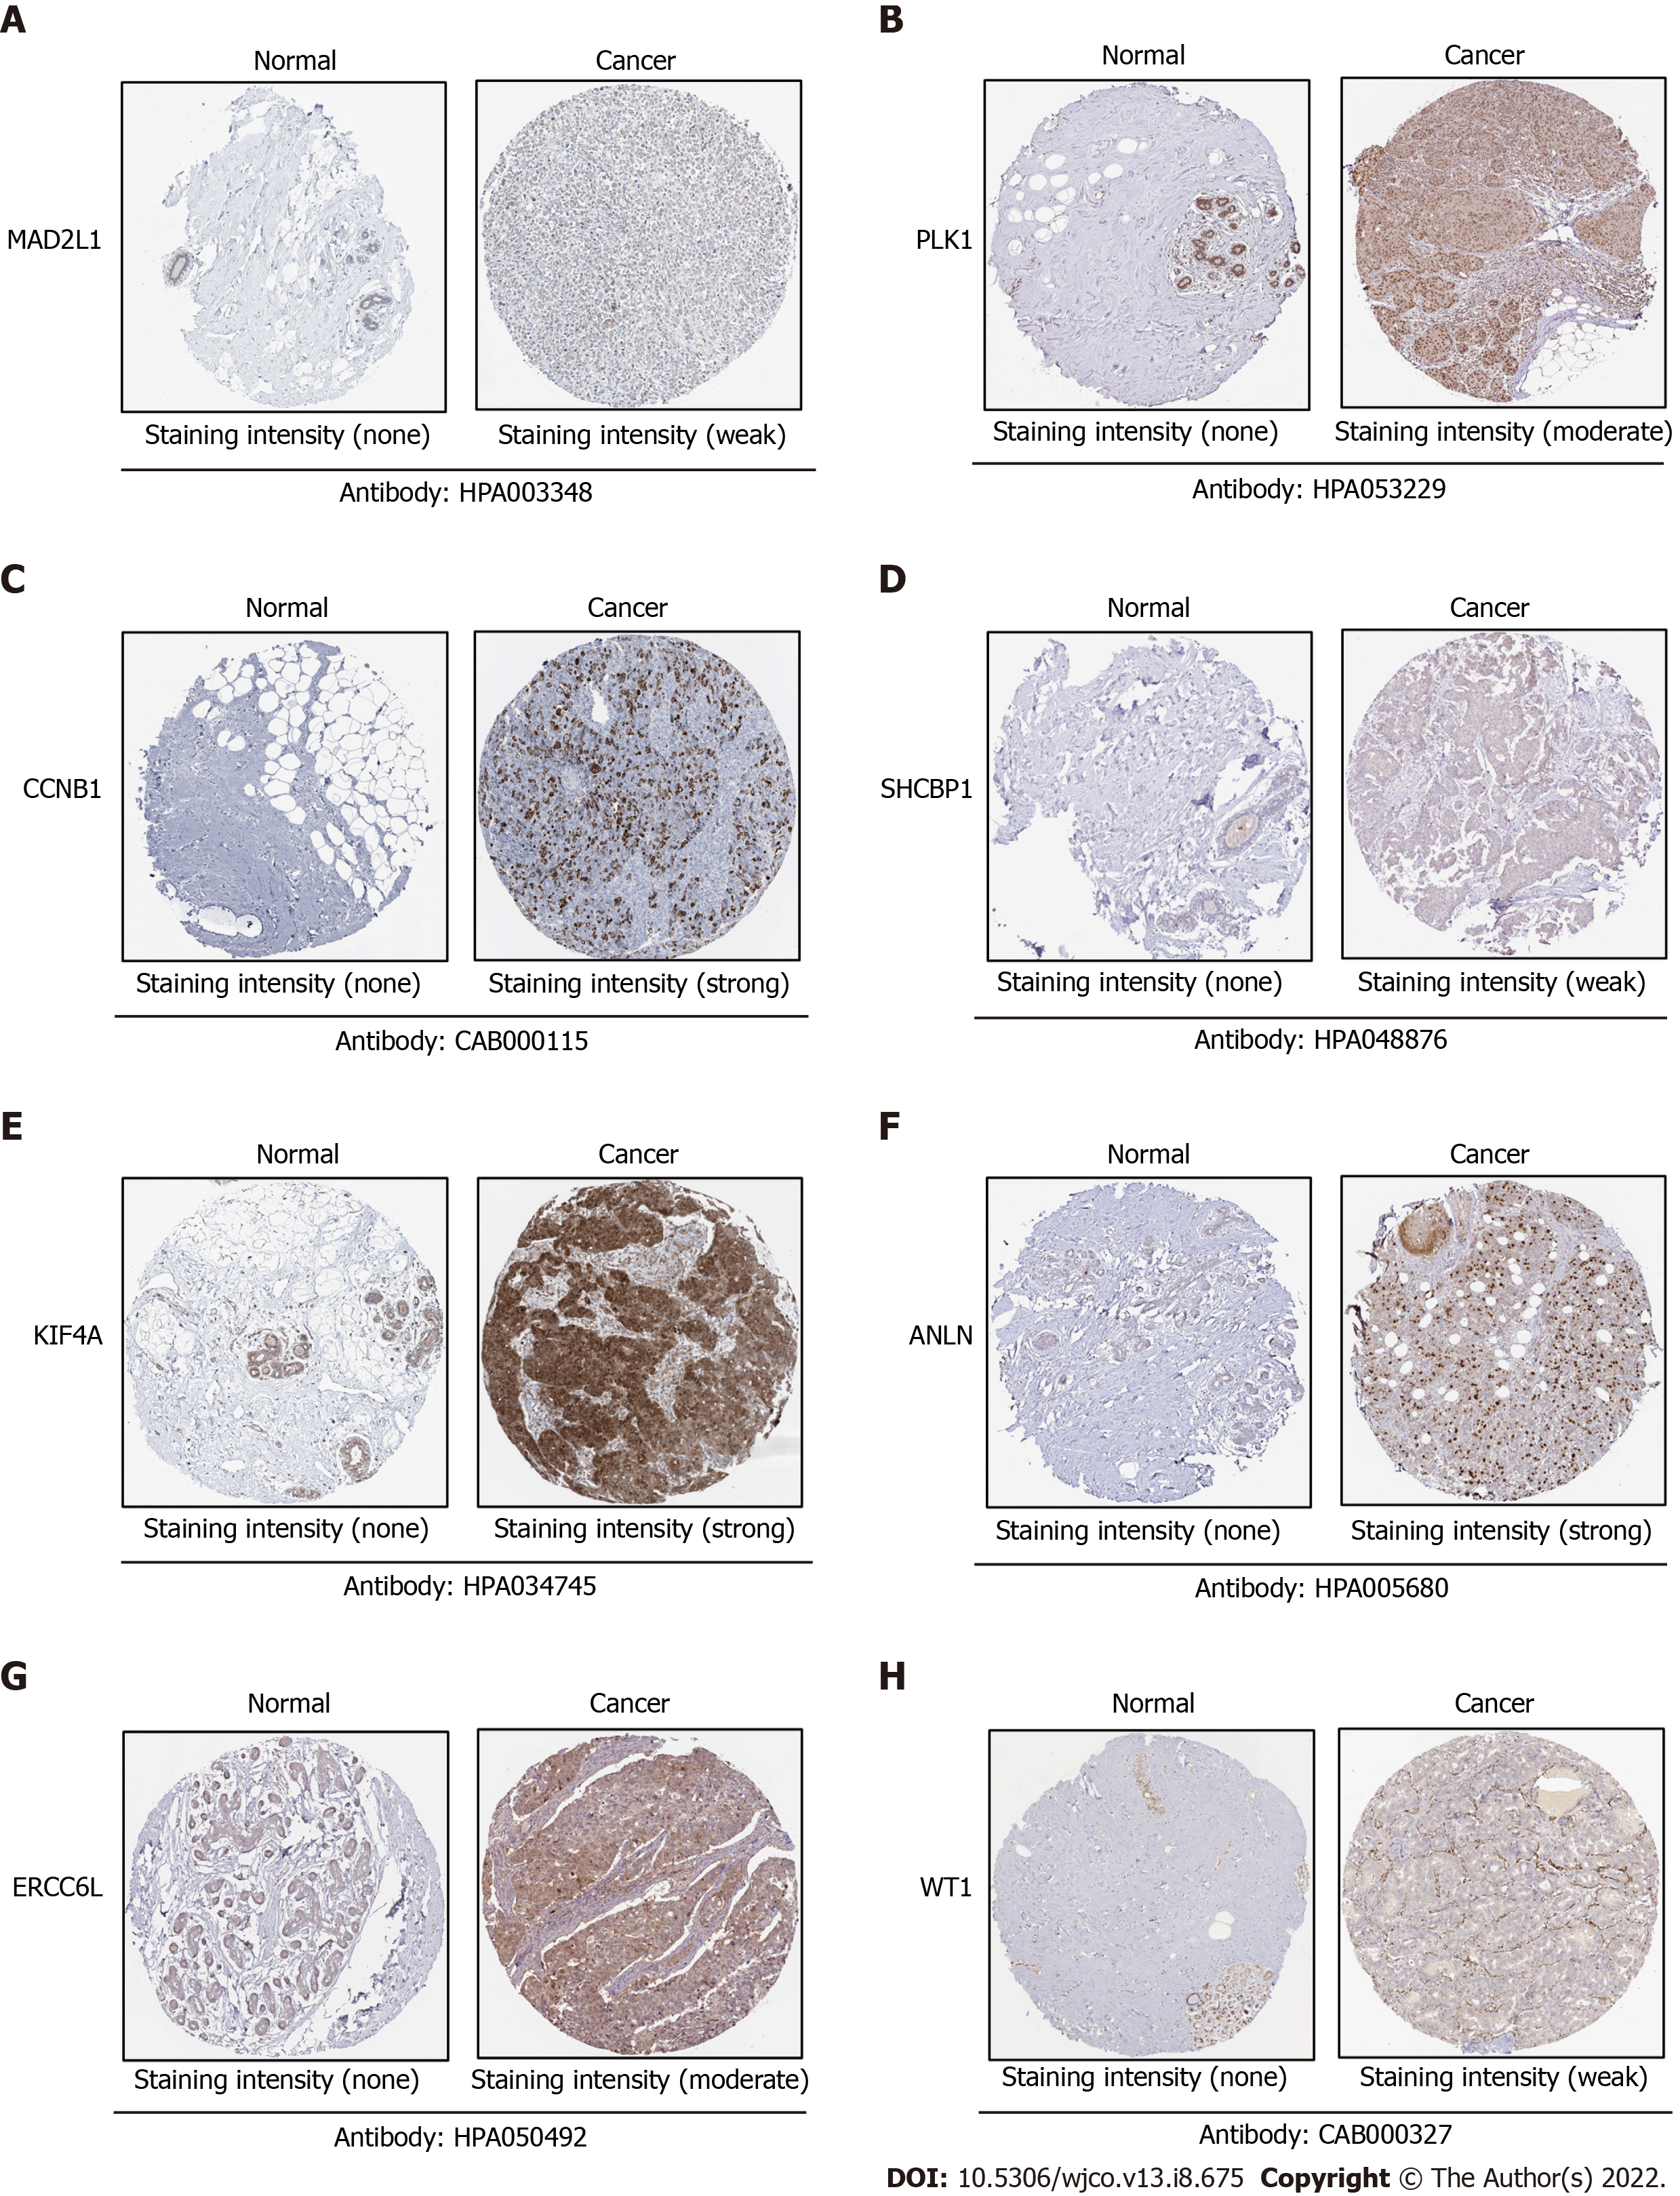
Figure 6 Protein expression of the eight hub genes were verified by human protein atlas database.
The database lacks expression data on serum amyloid A1- and chemokine (C-X-C motif) ligand 2-related proteins.
- Citation: Liu N, Zhang GD, Bai P, Su L, Tian H, He M. Eight hub genes as potential biomarkers for breast cancer diagnosis and prognosis: A TCGA-based study. World J Clin Oncol 2022; 13(8): 675-687
- URL: https://www.wjgnet.com/2218-4333/full/v13/i8/675.htm
- DOI: https://dx.doi.org/10.5306/wjco.v13.i8.675


