Published online Nov 28, 2023. doi: 10.4329/wjr.v15.i11.315
Peer-review started: October 3, 2023
First decision: October 17, 2023
Revised: October 26, 2023
Accepted: November 17, 2023
Article in press: November 17, 2023
Published online: November 28, 2023
Processing time: 51 Days and 15.9 Hours
Radionuclides produce Cherenkov radiation (CR), which can potentially activate photosensitizers (PSs) in phototherapy. Several groups have studied Cherenkov energy transfer to PSs using optical imaging; however, cost-effectively identifying whether PSs are excited by radionuclide-derived CR and detecting fluorescence emission from excited PSs remain a challenge. Many laboratories face the need for expensive dedicated equipment.
To cost-effectively confirm whether PSs are excited by radionuclide-derived CR and distinguish fluorescence emission from excited PSs.
The absorbance and fluorescence spectra of PSs were measured using a micro
The maximum absorbance of TCPP was at 390–430 nm, and the emission peak was at 670 nm. The CR and CR-induced TCPP emissions were observed using the optical imaging system and the high-transmittance long-pass filters described above. The emission spectra of TCPP with a peak in the 645–700 nm window were obtained by calculation and subtraction based on the serial signal intensity (total flux) difference between 64CuCl2 + TCPP and
This simple method identifies the PS fluorescence emission generated by radionuclide-derived CR and can contribute to accelerating the development of Cherenkov energy transfer imaging and the discovery of new PSs.
Core Tip: Radionuclides produce Cherenkov radiation (CR), which can potentially activate photosensitizers (PSs) in phototherapy. However, a cost-effective method to determine whether radionuclide-derived CR excites PSs and the measurement of fluorescence emitted by excited PS remain elusive. We propose a cost-effective method using a charge-coupled device optical imaging system combined with long-pass filters and subtraction image processing to distinguish CR and PS fluorescence emission. As a proof-of-concept, 64CuCl2 and the PS tetrakis (4-carboxyphenyl) porphyrin were used in the experiments. This method can contribute to accelerating the development of Cherenkov energy transfer imaging and the discovery of new PSs.
- Citation: Aung W, Tsuji AB, Rikiyama K, Nishikido F, Obara S, Higashi T. Imaging assessment of photosensitizer emission induced by radionuclide-derived Cherenkov radiation using charge-coupled device optical imaging and long-pass filters. World J Radiol 2023; 15(11): 315-323
- URL: https://www.wjgnet.com/1949-8470/full/v15/i11/315.htm
- DOI: https://dx.doi.org/10.4329/wjr.v15.i11.315
Cherenkov radiation (CR) is the emission of photons when a charged particle moves faster than the speed of light in a medium[1]. Various radionuclides produce Cherenkov optical emission[2], which can potentially activate photo
Recently, photons from CR emitted from common radioisotopes have been detected using a highly sensitive charge-coupled device (CCD) optical imaging system[9,10]. However, when the radionuclide and PS coexist, the broad and continuous spectrum of the Cherenkov optical emission overlaps with the PS emission spectrum, obscuring the latter. Confirming whether the CR excites the PS is challenging because the required dedicated optical imaging devices (with built-in filters) are expensive. A method for distinguishing the Cherenkov optical emission from the PS fluorescence without expensive, dedicated instruments would benefit laboratories.
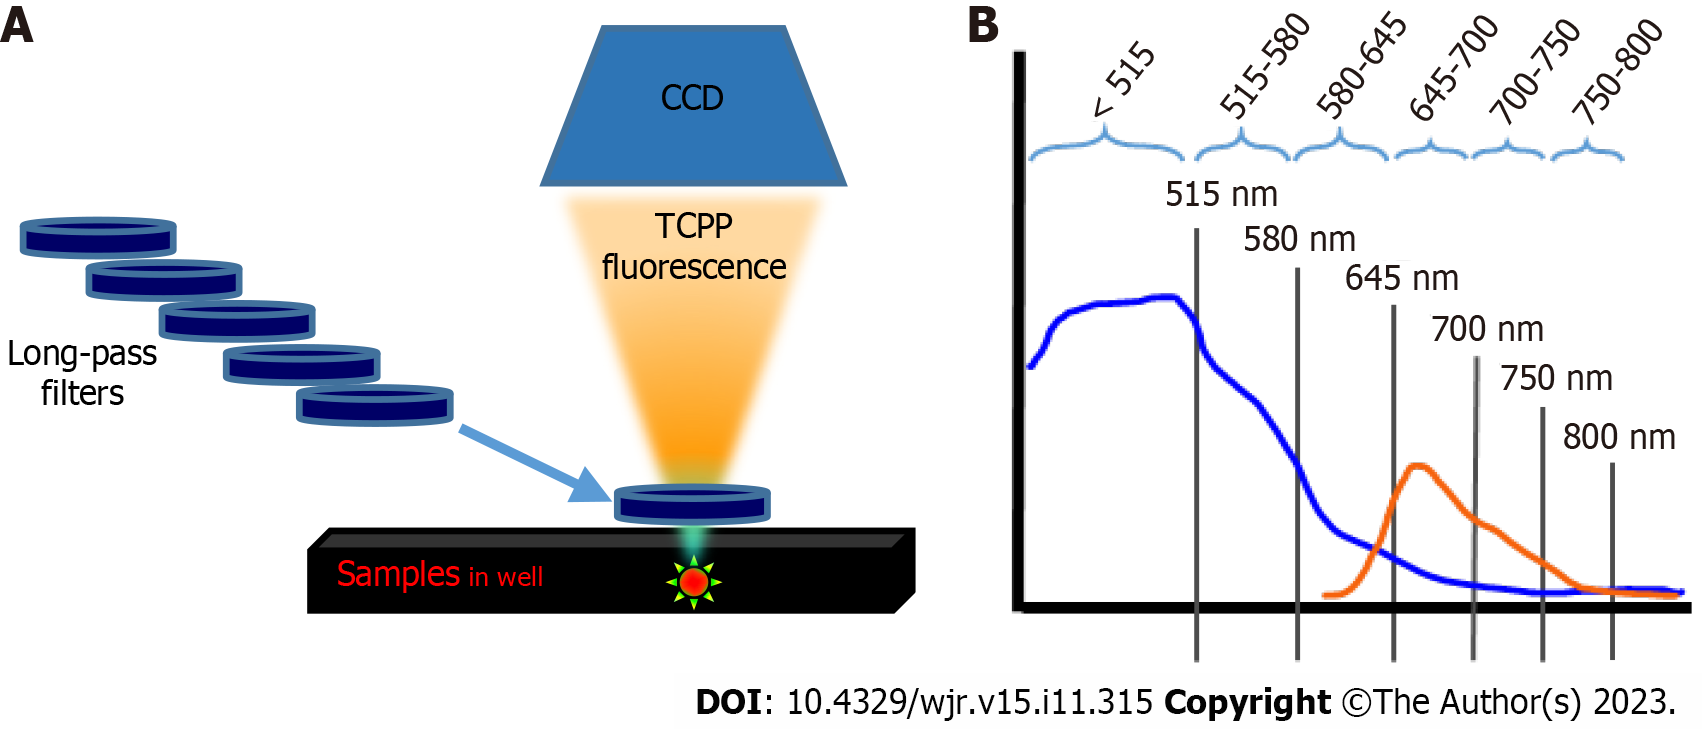
We evaluate whether an optical imaging system based on a CCD camera and different long-pass filters (Figure 1) can effectively detect and separate the radionuclide-derived CR emission from the CR-induced PS fluorescence spectrum. We used commercially available tetrakis (4-carboxyphenyl) porphyrin (TCPP) as a model PS, which can be conjugated to nanomaterials and applied to antimicrobial and anticancer phototherapies[11,12]. Among the various types of PSs, porphyrin-based PSs are commonly used for phototherapy[13]. The beta-emitting isotope Copper-64 (64CuCl2; T1/2 = 12.7 h; β+, 0.653 MeV; β−, 0.579 MeV) was employed as a CR-producing radionuclide. This is a simple and cost-effective method to determine whether the fluorescence emitted from the PS is effectively the result of excitation by CR from a radionuclide.
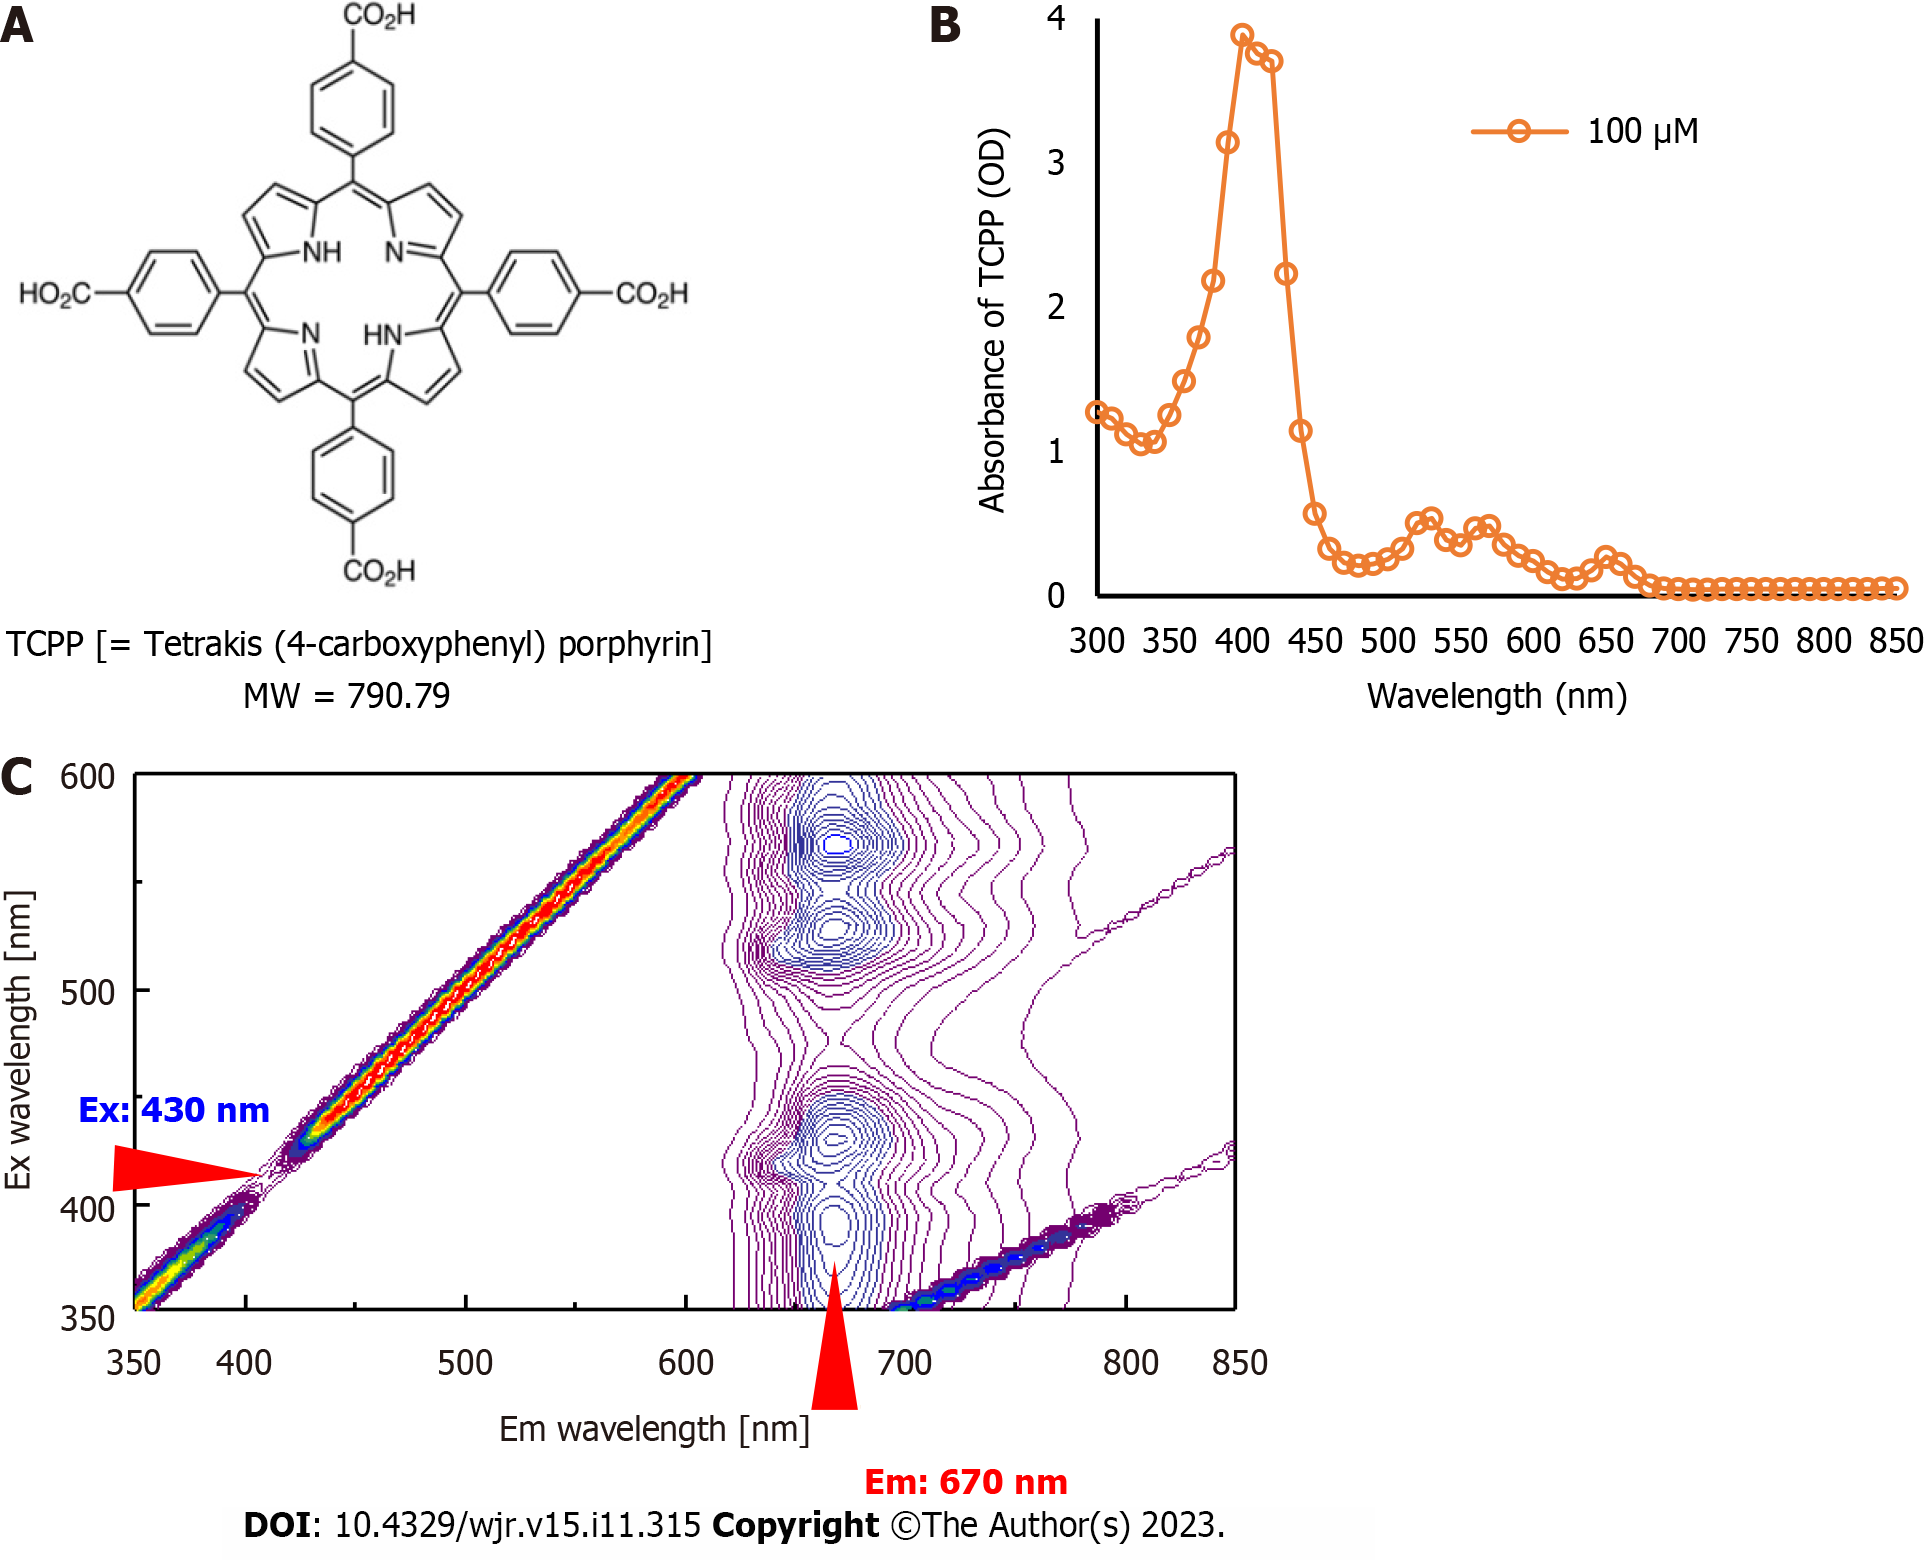
TCPP (molecular weight: 790.79) was purchased from Tokyo Chemical Industry Co., Ltd. (TCI, Tokyo, Japan). The chemical structure of TCPP is shown in Figure 2A. Phosphate Buffer (PB) was purchased from Wako Pure Chemical Co. (WAKO, Osaka, Japan). The beta-emitting isotope 64CuCl2 was synthesized and provided by the Institute’s Department of Advanced Nuclear Medicine Sciences (Chiba, Japan).
Aqueous solutions of 0.1 mol/L TCPP were prepared by dissolving TCPP powder in PB (pH 7.4). The TCPP sample (100 µmol/L) was transferred to a 96-well plate. A SpectraMax M5 microplate reader (Molecular Devices, LLC, San Jose, CA, United States) with an operating range of 300–850 nm in 10 nm increments was used to record the absorbance spectrum of the sample. The three-dimensional fluorescence spectrum of TCPP was acquired using a JASCO FP-6600 fluorescence spectrometer (JASCO, Tokyo, Japan) equipped with a xenon lamp. The fluorescence emission intensity (FI) was measured at excitation wavelengths ranging from 350 nm to 600 nm in 5 nm increments. The emission wavelengths were measured in the 350–850 nm range in 2 nm increments. These measurements enabled the maximum excitation and emission wavelengths of TCPP to be determined.
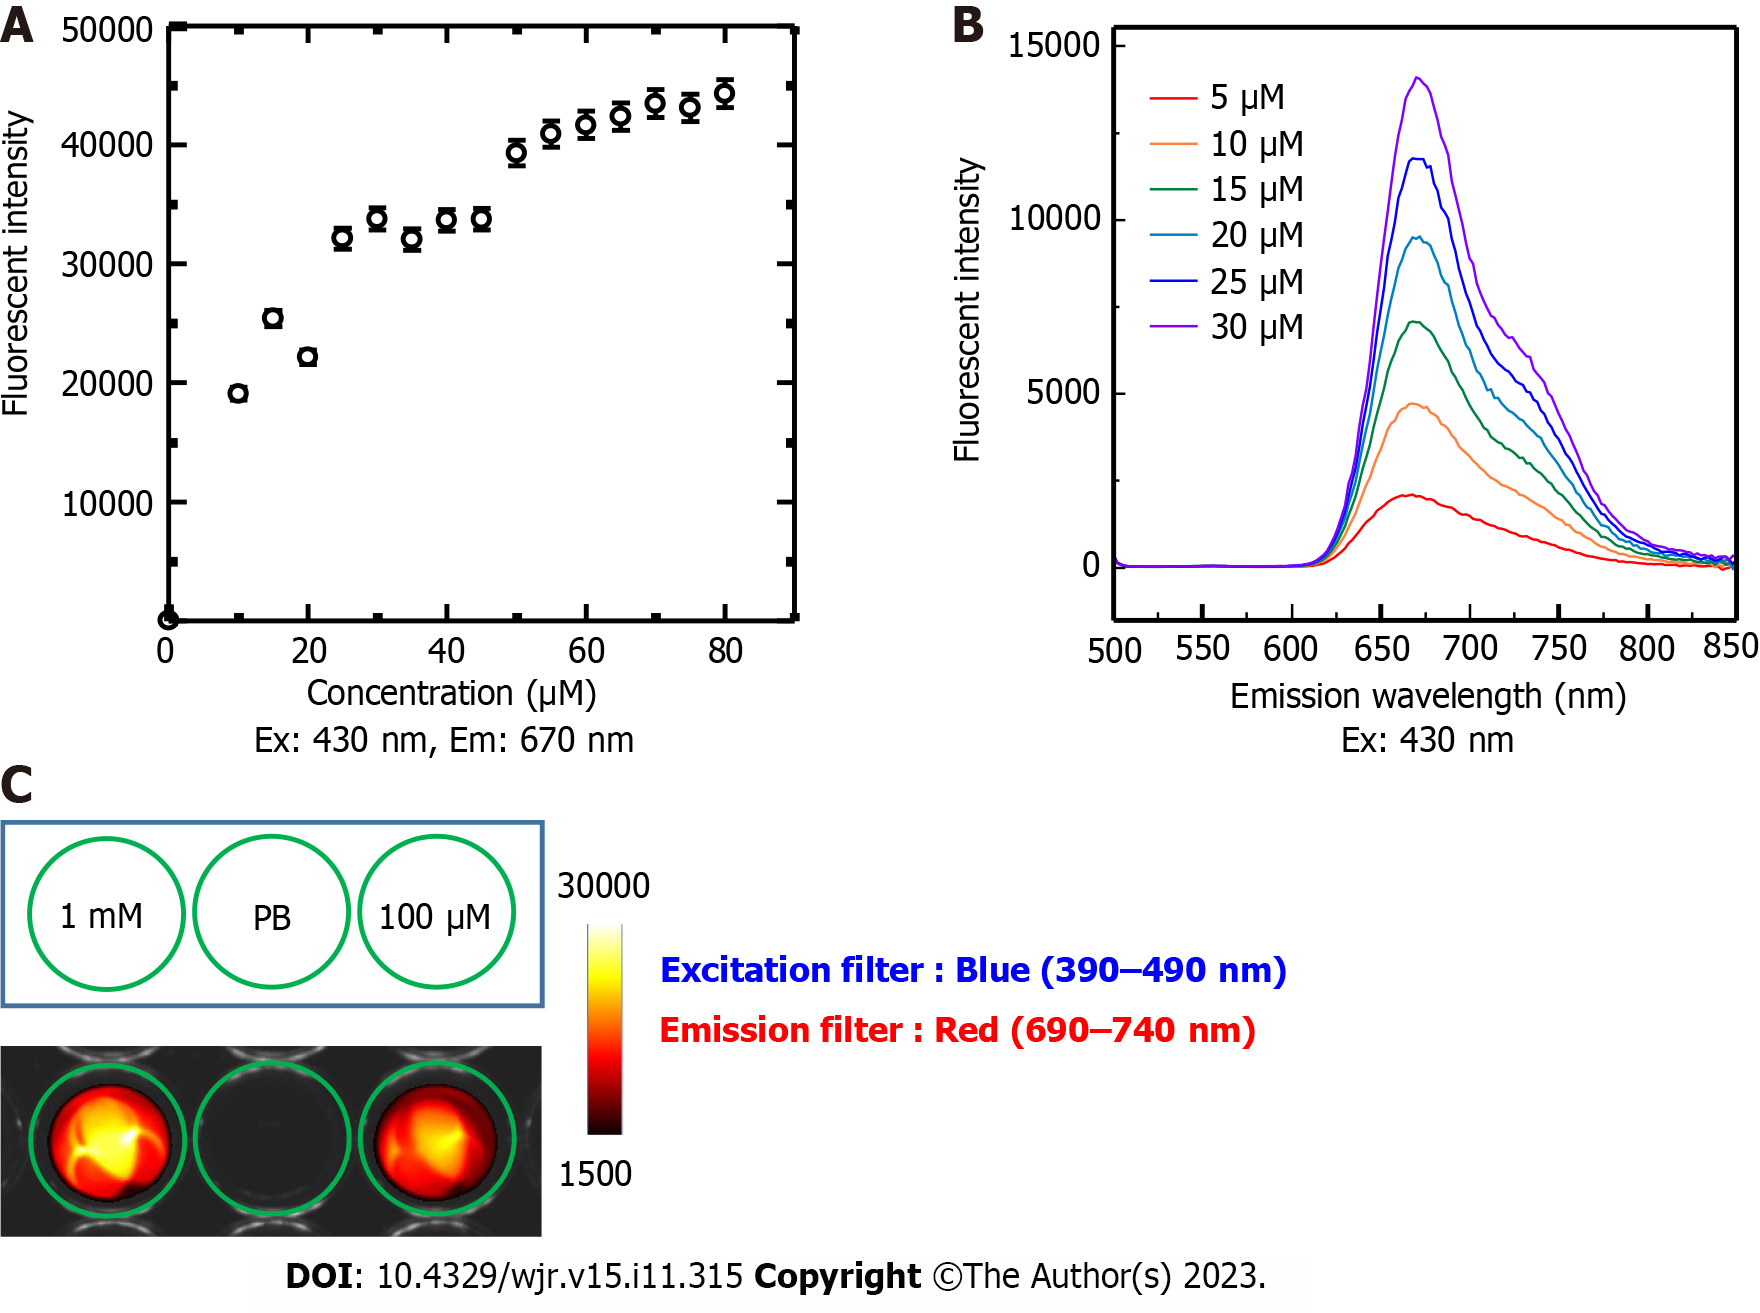
The concentration-dependent FI of TCPP was measured using an Infinite 200 PRO multimode microplate reader (Tecan Japan Co., Ltd., Kawasaki, Japan) by setting the excitation wavelength to 430 nm, emission wavelength to 670 nm, gain to 79, and by integrating for 20 µs. A series of different TCPP concentrations (5, 10, 15, 20, 25, 30, 35, 40, 45, 50, 55, 60, 65, 70, 75, and 80 µmol/L) in PB were used for FI measurements. For spectral analysis, low TCPP concentrations (5, 10, 15, 20, 25, and 30 µmol/L) were measured using a multimode microplate reader (Tecan) operating in the emission wavelength range of 500–850 nm in 2 nm increments. The acquired FI was plotted against the wavelength.
To visualize the LED-induced fluorescence emission from TCPP, TCPP solutions (1 mmol/L and 100 µmol/L) were added to a Nunc™ Flat-Bottom Microplate (96-well, Black) (Thermo Fisher Scientific, Roskilde, Denmark) and imaged with the VISQUE InVivo Smart fluorescence imaging and analysis system (Vieworks Co., Ltd, Gyeonggi, Korea) using the following specific excitation and emission filter combinations: Blue light (390–490 nm) excitation and red light (690–740 nm) emission. Constant parameters (exposure time: 500 ms; binning: 1 × 1; light intensity: Middle; mode: Low gain) were set and used for imaging.
The TCPP (30 µmol/L) and radionuclide 64CuCl2 (4 mCi) were prepared in a 96-well black microplate (Thermo Fisher Scientific). At 0.5 h after preparing the samples, the CR emitted from the radionuclide was visualized using a sensitive CCD camera equipped with an IVIS Lumina optical imaging system (PerkinElmer, Waltham, MA, United States). The luminescent imaging mode with fixed acquisition parameters [emission filter: Open; excitation filter: Block; exposure time: 2 min; binning: 4 × 4; F/Stop (f): 1; field of view (FOV): 5 cm] was used in all experiments. Images of the wells containing the samples were acquired first. The optical signal intensity [total flux (photon/s)] was measured in the regions of interests (ROIs) corresponding to the sample-containing wells, and one empty well was used for background subtraction. Moreover, several high-transmittance long-pass filters of different wavelengths (515, 580, 645, 700, 750, and 800 nm) were used to separate the emission spectrum of TCPP and the Cherenkov light emitted by the radionuclide. A schematic of the experimental setup is shown in Figure 1. Each filter was manually placed on the wells, and images were acquired sequentially (Figure 1A). Image analysis was performed using Living Image 2.6 (PerkinElmer). First, the total flux of the wells containing samples was obtained by subtracting the total flux of the empty background. Subsequently, for each well, the total flux emitted within the window of the adjacent wavelengths of the two filters was calculated from the difference in the total flux measured with each respective filter (Figure 1B). For all pairs of wavelength windows, the total flux of 64CuCl2 + TCPP and 64CuCl2 was obtained by subtracting the total flux of the PB-filled wells. Second, the emission spectrum of TCPP was acquired by plotting the total flux difference between 64CuCl2 + TCPP and 64CuCl2 in the respective wavelength ranges. In addition, differential image analysis was performed to visually assess TCPP fluorescence by subtracting the 64CuCl2 image from the 64CuCl2 + TCPP image using ImageJ [https://imagej.nih.gov/ij/; National Institutes of Health (NIH), Bethesda, Maryland, United States][14]. The same experiment was also performed with 2 mCi and 1 mCi 64CuCl2.
The peak of the TCPP absorbance spectrum was in the 390–430 nm range (Figure 2B). In the three-dimensional fluorescence spectral analysis, the peak emission of TCPP was approximately 670 nm with excitation wavelengths of 350–600 nm (Figure 2C). Among the excitation wavelengths, 430 nm was considered the peak excitation wavelength for TCPP because it induced the highest fluorescence emission from TCPP and approximately corresponded with the wavelength of the most intense CR peak.
The FI of TCPP (5–80 µmol/L) linearly correlated with concentrations up to approximately 30 µmol/L. Above 30 µmol/L, the FI slope decreased (Figure 3A). This is likely due to TCPP stacking in the samples. Therefore, only low TCPP concentrations (5–30 µmol/L) were used for fluorescence spectral analysis. We found that the 430 nm wavelength excited TCPP to fluoresce over a range of wavelengths (625–775 nm) with a peak at 670 nm (Figure 3B).
The inherent fluorescence characteristics of TCPP emission could be visualized and confirmed using a fluorescence imaging system with a light-emitting diode light source and a set of filters for blue light (390–490 nm) excitation and red light (690–740 nm) emission (Figure 3C). Both filters were compatible with the excitation/emission wavelengths of TCPP (430/670 nm).
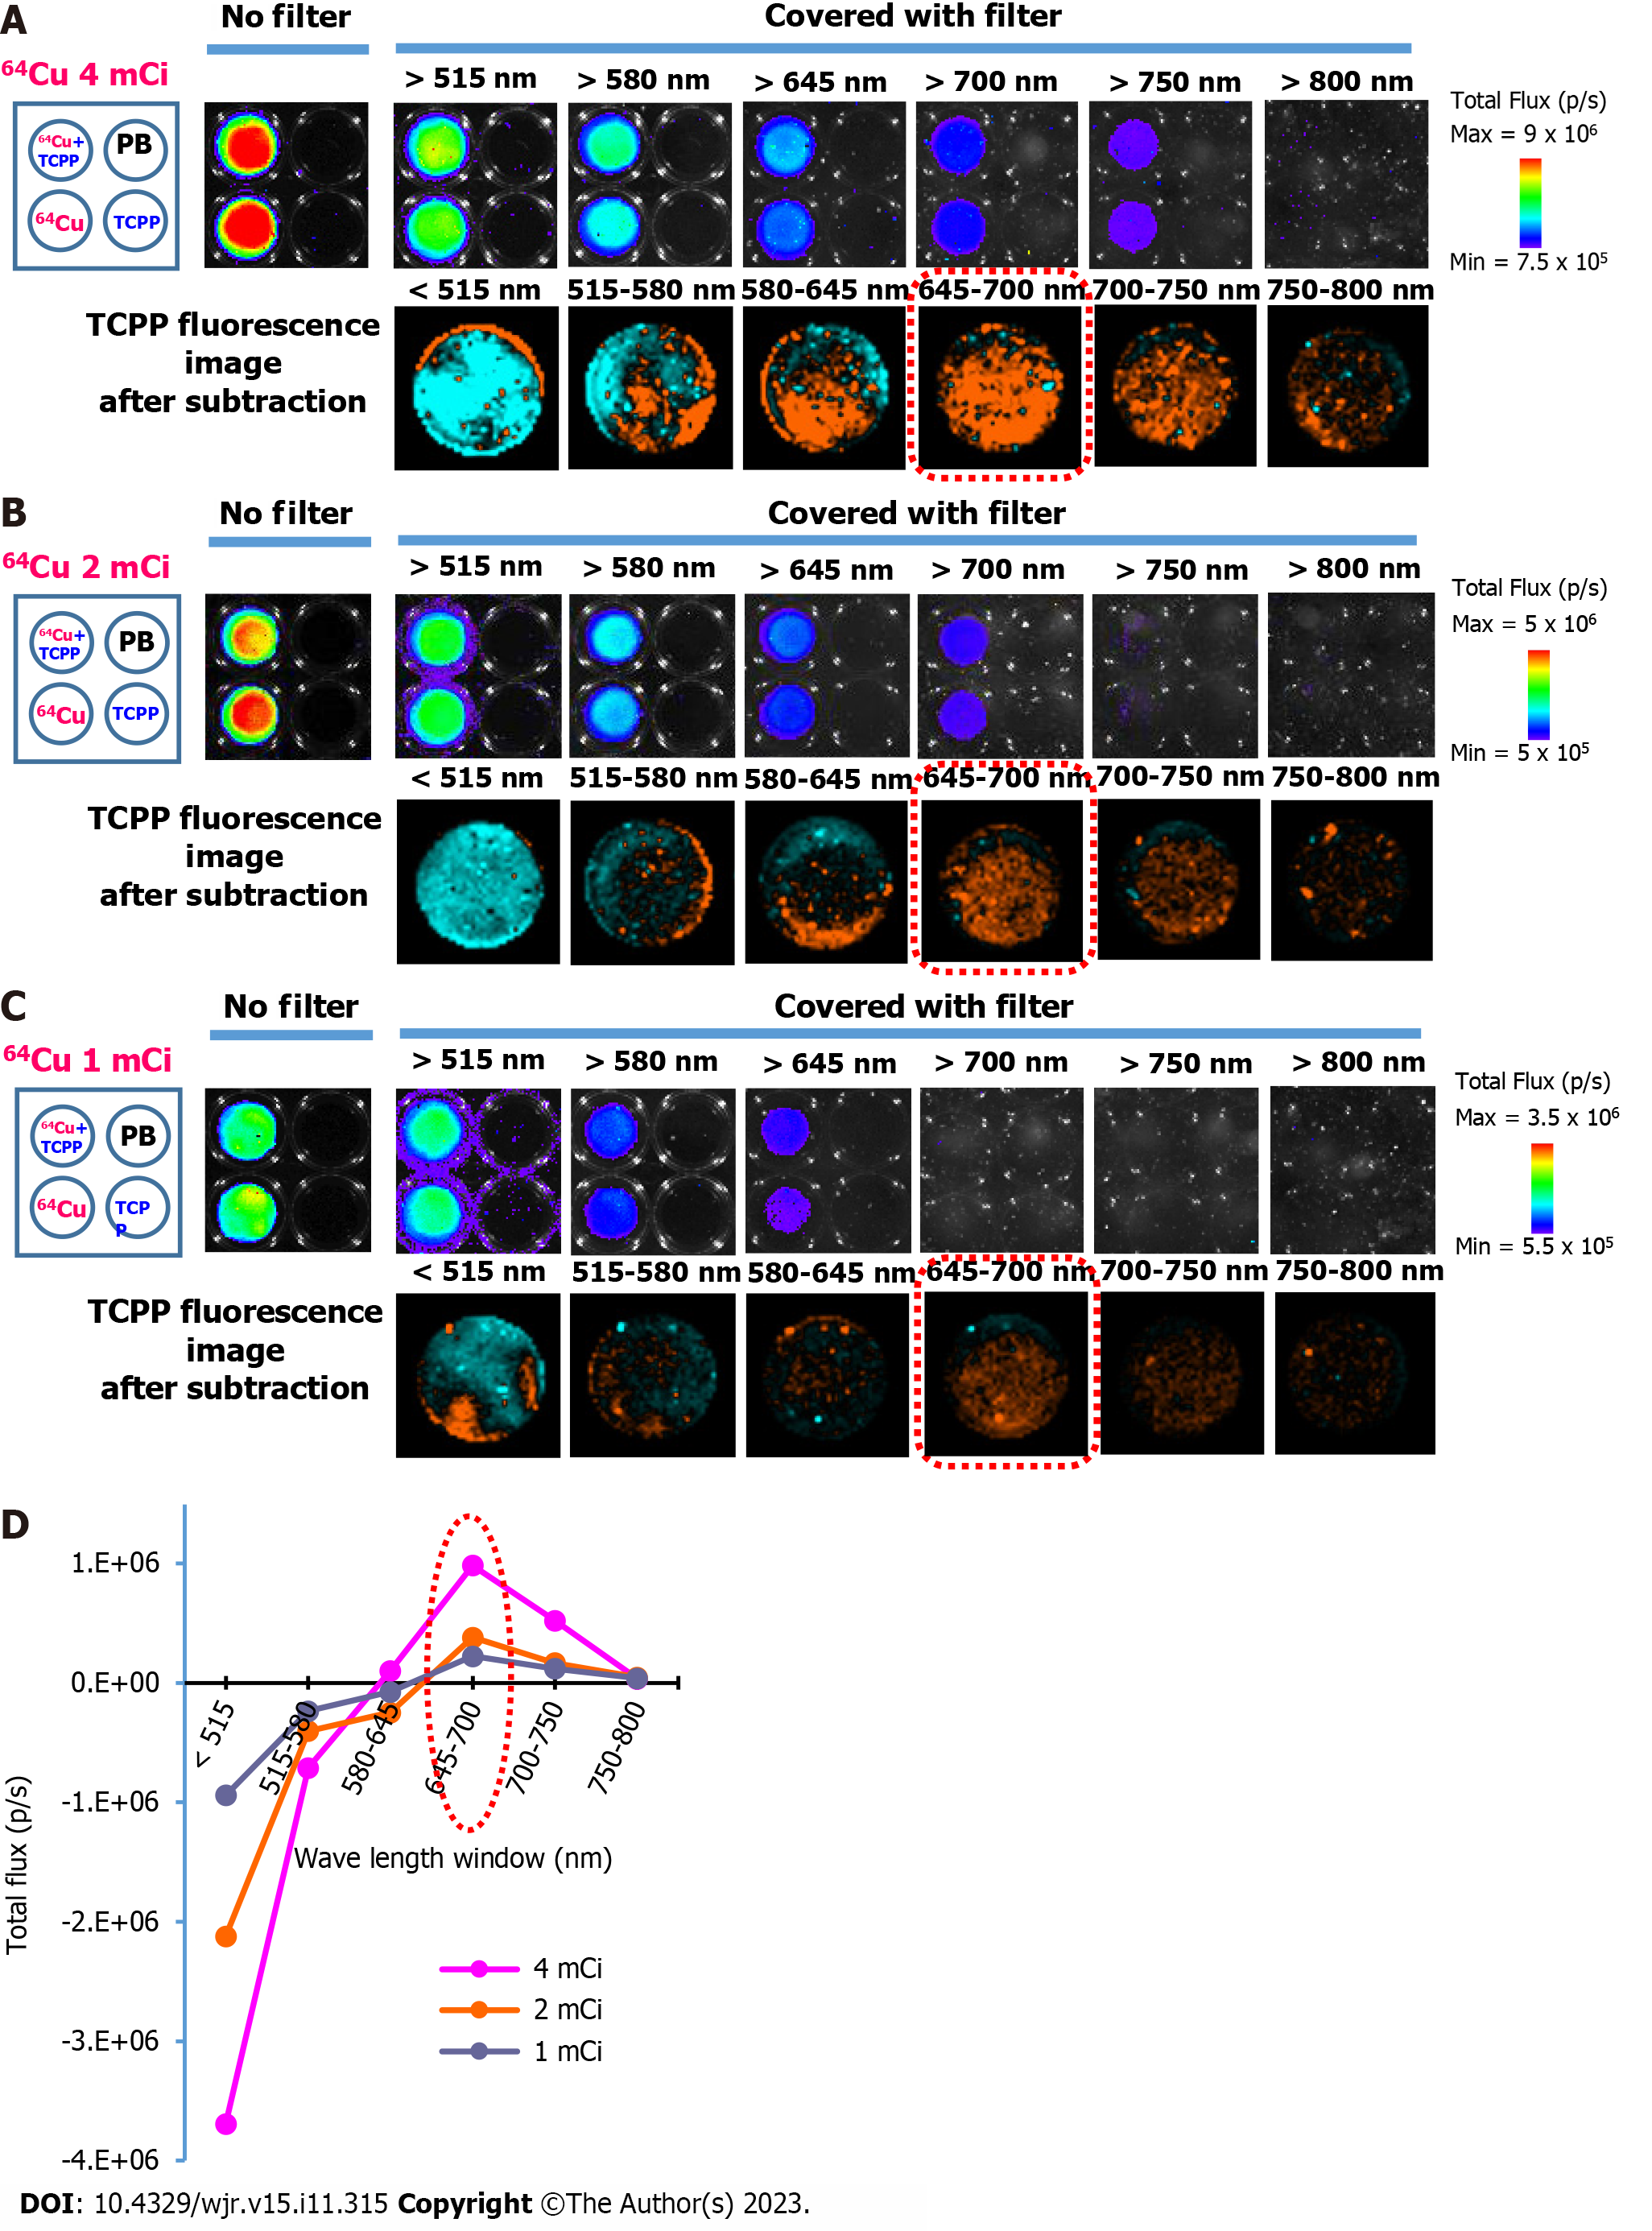
At 0.5 h after preparing the samples in the wells, images were acquired without a filter. Cherenkov luminescence from the radionuclide was detected in the two wells on the left containing 64CuCl2 + TCPP and 64CuCl2, respectively. In contrast, luminescence was not visualized in the two wells on the right containing either PB or TCPP (Figure 4A, upper row). The total flux produced from the light emission of the radionuclides decreased when the wells were covered with long-pass filters of different wavelengths. Serial application of long-pass filters of 515, 580, 645, 700, 750, and 800 nm resulted in a sequential decrease in total flux measured from the ROIs of wells with 64CuCl2 only (Figure 4A, upper row, lower left well) and 64CuCl2 + TCPP (Figure 4A, upper row, upper left well). The TCPP emission spectral band was separated using the following calculation. First, the total flux emitted from 64CuCl2 + TCPP and 64CuCl2 at two adjacent wavelengths was measured. Second, the optical signals for the serial pairs of the wavelength window were calculated based on the difference in the signals measured with each filter. Subsequently, the emission spectrum of TCPP was calculated by subtracting the total flux of 64CuCl2 from that of 64CuCl2 + TCPP. The resulting spectrum is shown in Figure 4. Using ImageJ software (NIH), differential image analysis was conducted by subtracting the 64CuCl2 image from the 64CuCl2 + TCPP image to visually evaluate TCPP fluorescence (Figure 4A, lower row). The spectral peaks with the maximum intensity were in the 645–700 nm window, marked by the red dotted rim in the lower row of Figure 4A and the line graph in Figure 4D. Similar results were obtained for the other two doses, 2 mCi (Figure 4B and D) and 1 mCi (Figure 4C and D). The total flux exhibited a dose-dependent tendency.
This study demonstrates that imaging with an optical imaging device coupled with different long-pass filters and subtraction image processing separates the spectra of CR and PS emissions, providing optical images of the emission from a PS at different wavelengths. Although distinguishing the Cherenkov light from the PS emission was difficult, the subtraction image processing effectively separated them. Thus, the combined use of a device set and image processing could be utilized in laboratories with optical imaging devices.
The three-dimensional fluorescence spectral analysis showed that TCPP was excited by light wavelengths from 350 nm to 600 nm, producing a large Stokes shift and an emission peak at approximately 670 nm. The CR spectrum was continuous, peaking at high frequencies (ultraviolet/blue)[15,16]. Therefore, the absorption profile of TCPP (390–430 nm) matched the Cherenkov emission profile.
A bioluminescence imaging device, an IVIS optical imaging system with six different long-pass filters, can provide various optical images of CR plus PS emission. Our lab has an IVIS imaging system and six long-pass filters that are not built into the device but used for other purposes. We manually placed each filter on the wells containing 64Cu and PS and captured optical images (Figure 4A-C, upper rows). When the wells were covered with long-pass filters, the total flux derived from 64Cu-containing wells decreased when the wavelength of the applied filters increased. This could occur because the wavelength of the filters exceeded the maximum emission peak of CR (350–500 nm) and cut off the Cherenkov light. Visually distinguishing the emission from 64CuCl2 and 64CuCl2 + TCPP is challenging, even though the TCPP emission spectrum can be calculated (Figure 4D). Thus, an additional process is required to visualize only the light emitted from the PS.
The PS emissions were distinguished from the CR emissions using image processing. The image data acquired by the IVIS system were processed using ImageJ, a simple and free software package provided by NIH, to obtain the differential image. The TCPP fluorescence image was easily generated by subtracting the 64CuCl2 image from the 64CuCl2 + TCPP image (Figure 4A-C, lower rows). These results displayed a dose-dependent trend. Moreover, both the TCPP fluorescence images (Figure 4A-C, lower rows) and spectra (Figure 4D) were consistent with the results obtained from the fluorescence spectral analysis of the TCPP (Figure 3B), showing a fluorescence peak at 645–700 nm.
Overall, the developed method could be used to compare different PSs and provide information to select the optimal PS. In addition, various laboratories with conventional optical imaging devices could easily apply this method when conducting studies. Some laboratories have appropriate long-pass filters, whereas others could obtain them inexpensively. The ImageJ software is available to all laboratories; however, only a few laboratories can currently screen for appropriate PSs for Cherenkov energy transfer imaging. The proposed method could enable more laboratories to perform these procedures, contributing to the accelerated development of Cherenkov energy transfer imaging for multiple applications. The main objective of this study was to demonstrate the feasibility of the proposed method as a proof of concept; however, the method would need to be more comprehensively tested to address possible limitations. First, the reproducibility would have to be determined and statistically assessed. Second, we evaluated only one PS, namely TCPP. Further studies would have to compare the results for different PSs. Third, we used only one radionuclide, 64CuCl2. Other beta-emitting radioactive sources producing decay products with energies above the Cerenkov threshold (approximately 220 keV) could be employed in future studies[17]. The next step would therefore entail more detailed examinations.
A simple method using a CCD optical imaging system in combination with different high-transmission long-pass filters and subtraction image processing was capable of potentially evaluating whether PS candidates are reliably excited by radionuclide-derived CR to produce fluorescence emission. The widespread adoption of this method could be expected to contribute to the discovery of a range of new effective PSs.
Cherenkov radiation (CR) is the emission of photons when a charged particle moves faster than the speed of light in a medium. Various radionuclides produce Cherenkov optical emission, which can potentially activate photosensitizers (PSs) in phototherapy.
Several researchers are investigating CR-induced photodynamic therapy using radioisotopes and Cherenkov energy transfer to PSs using optical imaging. However, the effective management of the process, particularly the cost-effective confirmation that a PS is excited by CR and identifying appropriate PSs, remains a challenge.
The purpose of this study is to propose a cost-effective method to determine whether the PS is excited by radionuclide-derived CR and to distinguish the fluorescence emission from PS excitation.
Tetrakis (4-carboxyphenyl) porphyrin (TCPP) and Copper-64 (64CuCl2) were utilized as a model PS and a CR-producing radionuclide, respectively. The photo-physical properties (absorbance and fluorescence spectra) of TCPP were measured using a microplate reader and fluorescence spectrometer. Imaging and data acquisition were performed with a charge-coupled device optical imaging system and appropriate long-pass filters of different wavelengths. To visually evaluate the TCPP fluorescence, differential image analysis was conducted using ImageJ software (National Institutes of Health).
Optical imaging coupled with high-transmittance long-pass filters and subtraction image processing separated the emission spectra of the radionuclide-derived CR and TCPP. The emission spectra of TCPP were obtained by calculation and subtraction based on the serial signal intensity (total flux) difference between 64CuCl2 + TCPP and 64CuCl2. In addition, the differential fluorescence images of TCPP were acquired by subtracting the 64CuCl2 image from the 64CuCl2 + TCPP image.
This simple and cost-effective method could confirm the PS fluorescence emission generated by radionuclide-derived CR. Moreover, the method can contribute to accelerating the development of Cherenkov energy transfer imaging and the discovery of new effective PSs.
Several laboratories with conventional optical imaging devices would be able to acquire suitable long-pass filters at low cost and easily apply this method to compare different PSs to identify the optimal PS. A potential limitation of this study, namely the use of limited experiments with only one PS and one radionuclide, could be addressed by conducting much more detailed examinations as the next step.
The authors thank the members of the Cyclotron Operation Section for providing 64Cu. We are grateful to Osada Kensuke and Yamaya Taiga for their helpful discussions and suggestions.
Provenance and peer review: Unsolicited article; Externally peer reviewed.
Peer-review model: Single blind
Corresponding Author's Membership in Professional Societies: Japanese Society of Nuclear Medicine, No. 11047.
Specialty type: Radiology, nuclear medicine and medical imaging
Country/Territory of origin: Japan
Peer-review report’s scientific quality classification
Grade A (Excellent): 0
Grade B (Very good): B
Grade C (Good): 0
Grade D (Fair): 0
Grade E (Poor): 0
P-Reviewer: Zhou J, China S-Editor: Lin C L-Editor: Filipodia P-Editor: Zhao S
| 1. | Cherenkov PA. Visible Light from Clear Liquids Under the Action of Gamma Radiation. CR (Dokl) Acad Sci URSS. 1934;2:451-454. [DOI] [Full Text] |
| 2. | Ruggiero A, Holland JP, Lewis JS, Grimm J. Cerenkov luminescence imaging of medical isotopes. J Nucl Med. 2010;51:1123-1130. [RCA] [PubMed] [DOI] [Full Text] [Full Text (PDF)] [Cited by in Crossref: 254] [Cited by in RCA: 206] [Article Influence: 13.7] [Reference Citation Analysis (0)] |
| 3. | Klein JS, Sun C, Pratx G. Radioluminescence in biomedicine: physics, applications, and models. Phys Med Biol. 2019;64:04TR01. [RCA] [PubMed] [DOI] [Full Text] [Cited by in Crossref: 35] [Cited by in RCA: 38] [Article Influence: 6.3] [Reference Citation Analysis (0)] |
| 4. | Ran C, Zhang Z, Hooker J, Moore A. In vivo photoactivation without "light": use of Cherenkov radiation to overcome the penetration limit of light. Mol Imaging Biol. 2012;14:156-162. [RCA] [PubMed] [DOI] [Full Text] [Cited by in Crossref: 55] [Cited by in RCA: 49] [Article Influence: 3.8] [Reference Citation Analysis (0)] |
| 5. | Kotagiri N, Sudlow GP, Akers WJ, Achilefu S. Breaking the depth dependency of phototherapy with Cerenkov radiation and low-radiance-responsive nanophotosensitizers. Nat Nanotechnol. 2015;10:370-379. [RCA] [PubMed] [DOI] [Full Text] [Full Text (PDF)] [Cited by in Crossref: 291] [Cited by in RCA: 303] [Article Influence: 30.3] [Reference Citation Analysis (0)] |
| 6. | Hartl BA, Hirschberg H, Marcu L, Cherry SR. Activating Photodynamic Therapy in vitro with Cerenkov Radiation Generated from Yttrium-90. J Environ Pathol Toxicol Oncol. 2016;35:185-192. [RCA] [PubMed] [DOI] [Full Text] [Cited by in Crossref: 37] [Cited by in RCA: 38] [Article Influence: 4.8] [Reference Citation Analysis (0)] |
| 7. | Kamkaew A, Cheng L, Goel S, Valdovinos HF, Barnhart TE, Liu Z, Cai W. Cerenkov Radiation Induced Photodynamic Therapy Using Chlorin e6-Loaded Hollow Mesoporous Silica Nanoparticles. ACS Appl Mater Interfaces. 2016;8:26630-26637. [RCA] [PubMed] [DOI] [Full Text] [Cited by in Crossref: 115] [Cited by in RCA: 121] [Article Influence: 13.4] [Reference Citation Analysis (0)] |
| 8. | Guo R, Jiang D, Gai Y, Qian R, Zhu Z, Gao Y, Jing B, Yang B, Lan X, An R. Chlorin e6-loaded goat milk-derived extracellular vesicles for Cerenkov luminescence-induced photodynamic therapy. Eur J Nucl Med Mol Imaging. 2023;50:508-524. [RCA] [PubMed] [DOI] [Full Text] [Cited by in Crossref: 3] [Cited by in RCA: 20] [Article Influence: 10.0] [Reference Citation Analysis (0)] |
| 9. | Robertson R, Germanos MS, Li C, Mitchell GS, Cherry SR, Silva MD. Optical imaging of Cerenkov light generation from positron-emitting radiotracers. Phys Med Biol. 2009;54:N355-N365. [RCA] [PubMed] [DOI] [Full Text] [Full Text (PDF)] [Cited by in Crossref: 329] [Cited by in RCA: 259] [Article Influence: 16.2] [Reference Citation Analysis (0)] |
| 10. | Spinelli AE, D'Ambrosio D, Calderan L, Marengo M, Sbarbati A, Boschi F. Cerenkov radiation allows in vivo optical imaging of positron emitting radiotracers. Phys Med Biol. 2010;55:483-495. [RCA] [PubMed] [DOI] [Full Text] [Cited by in Crossref: 139] [Cited by in RCA: 113] [Article Influence: 7.1] [Reference Citation Analysis (0)] |
| 11. | Zhang Y, Ma J, Wang D, Xu C, Sheng S, Cheng J, Bao C, Li Y, Tian H. Fe-TCPP@CS nanoparticles as photodynamic and photothermal agents for efficient antimicrobial therapy. Biomater Sci. 2020;8:6526-6532. [RCA] [PubMed] [DOI] [Full Text] [Cited by in Crossref: 18] [Cited by in RCA: 21] [Article Influence: 4.2] [Reference Citation Analysis (0)] |
| 12. | Li B, Wang X, Chen L, Zhou Y, Dang W, Chang J, Wu C. Ultrathin Cu-TCPP MOF nanosheets: a new theragnostic nanoplatform with magnetic resonance/near-infrared thermal imaging for synergistic phototherapy of cancers. Theranostics. 2018;8:4086-4096. [RCA] [PubMed] [DOI] [Full Text] [Full Text (PDF)] [Cited by in Crossref: 101] [Cited by in RCA: 132] [Article Influence: 18.9] [Reference Citation Analysis (0)] |
| 13. | Malatesti N, Munitic I, Jurak I. Porphyrin-based cationic amphiphilic photosensitisers as potential anticancer, antimicrobial and immunosuppressive agents. Biophys Rev. 2017;9:149-168. [RCA] [PubMed] [DOI] [Full Text] [Cited by in Crossref: 77] [Cited by in RCA: 77] [Article Influence: 9.6] [Reference Citation Analysis (0)] |
| 14. | U. S. National Institutes of Health. ImageJ. [cited 12 February 2023]. Available from: https://imagej.nih.gov/ij/. |
| 15. | Spinelli AE, Boschi F. Novel biomedical applications of Cerenkov radiation and radioluminescence imaging. Phys Med. 2015;31:120-129. [RCA] [PubMed] [DOI] [Full Text] [Cited by in Crossref: 54] [Cited by in RCA: 50] [Article Influence: 4.5] [Reference Citation Analysis (0)] |
| 16. | Dothager RS, Goiffon RJ, Jackson E, Harpstrite S, Piwnica-Worms D. Cerenkov radiation energy transfer (CRET) imaging: a novel method for optical imaging of PET isotopes in biological systems. PLoS One. 2010;5:e13300. [RCA] [PubMed] [DOI] [Full Text] [Full Text (PDF)] [Cited by in Crossref: 139] [Cited by in RCA: 126] [Article Influence: 8.4] [Reference Citation Analysis (0)] |
| 17. | Ciarrocchi E, Belcari N. Cerenkov luminescence imaging: physics principles and potential applications in biomedical sciences. EJNMMI Phys. 2017;4:14. [RCA] [PubMed] [DOI] [Full Text] [Full Text (PDF)] [Cited by in Crossref: 66] [Cited by in RCA: 80] [Article Influence: 10.0] [Reference Citation Analysis (0)] |


