Copyright
©The Author(s) 2017.
World J Radiol. Apr 28, 2017; 9(4): 199-205
Published online Apr 28, 2017. doi: 10.4329/wjr.v9.i4.199
Published online Apr 28, 2017. doi: 10.4329/wjr.v9.i4.199
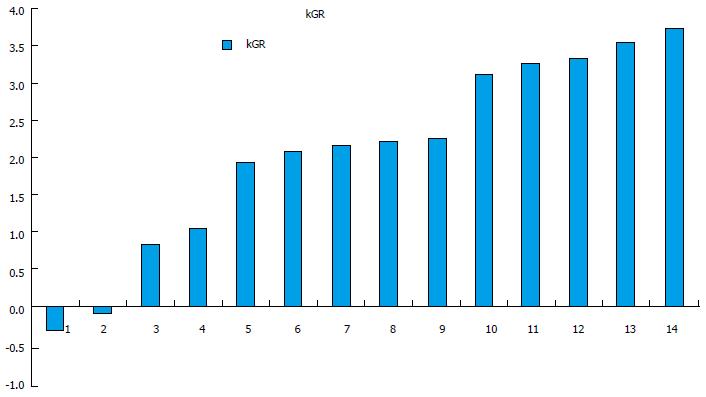
Figure 1 kinetic growth for each of the 14 patients.
The data are displayed at increasing values. A cut-off below 2% is considered sub-optimal for liver resection. Patients 1-5 did not show a kGR above the 2% threshold. kGR: Kinetic growth rate.
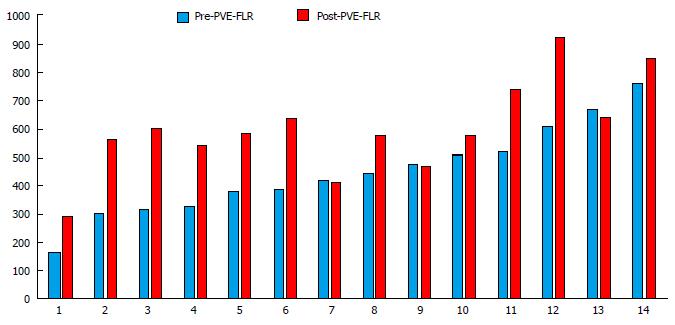
Figure 2 For each of the 14 patients the functioning liver remnant pre- and post-portal vein embolization.
This data was ordered from smallest to largest FLR based on the pre-PVE exam for each patient. These patient’s number do not correlate with Figure 1 patient number. Patients 7, 9, and 13 on this Figure did not show interval increase in FLR. FLR: Functional liver reserve; PVE: Portal vein embolization; .
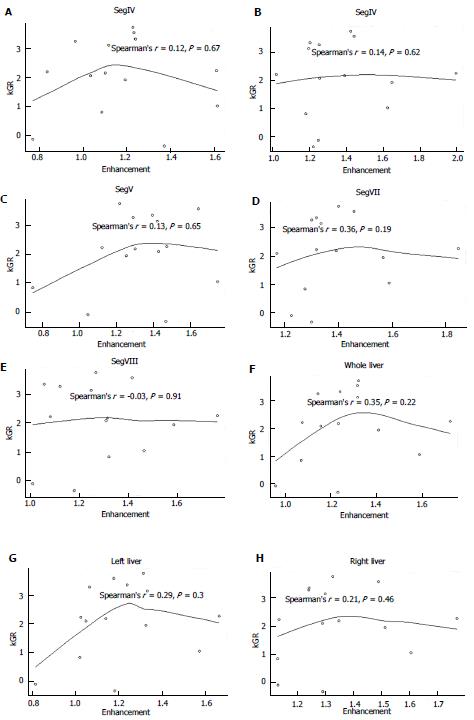
Figure 3 Correlation of the kinetic growth for each patient as a function of the degree of liver enhancement on the hepatobiliary phase.
A: Segment IV of the liver; B: Segment VI of the liver; C: Segment V of the liver; D: Segment VII of the liver; E: Segment VIII of the liver; F: Whole liver; G: Left liver; H: Right liver; kGR: Kinetic growth rate.
- Citation: Szklaruk J, Luersen G, Ma J, Wei W, Underwood M. Gd-EOB-DTPA based magnetic resonance imaging for predicting liver response to portal vein embolization. World J Radiol 2017; 9(4): 199-205
- URL: https://www.wjgnet.com/1949-8470/full/v9/i4/199.htm
- DOI: https://dx.doi.org/10.4329/wjr.v9.i4.199


