Copyright
©The Author(s) 2016.
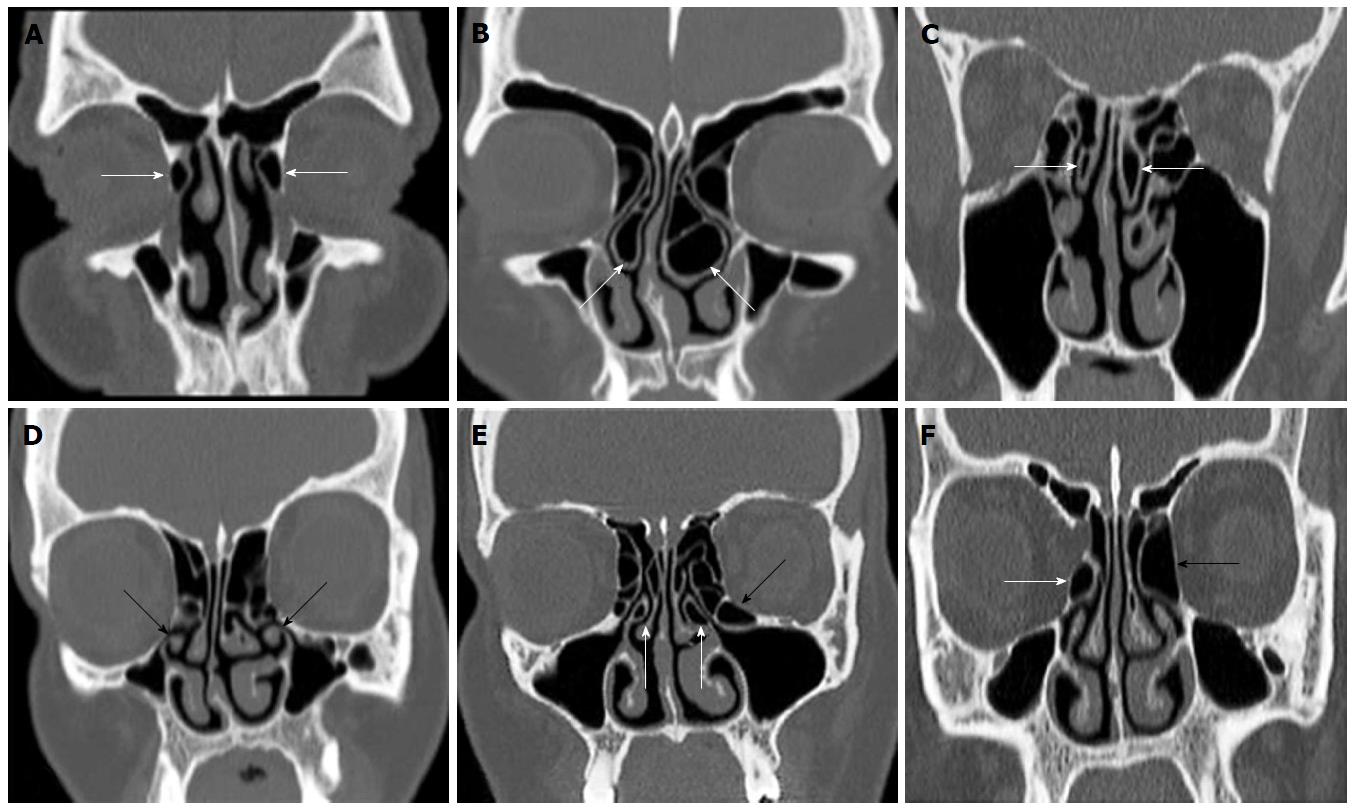
Figure 1 Coronal reformatted computerized tomography images shows different variations.
A: Bilaterally Agger nasi cells (arrow); B: Bilaterally extensive concha bullosa (arrows); C: Bilaterally pneumatized superior turbinates (arrows); D: Bilaterally curved uncinate process (black arrows); E: Bilaterally uncinate bulla (white arrows) and left Haller cells (black arrow); F: Left giant bulla ethmoidalis (black arrow) and right bulla ethmoidalis (white arrow).
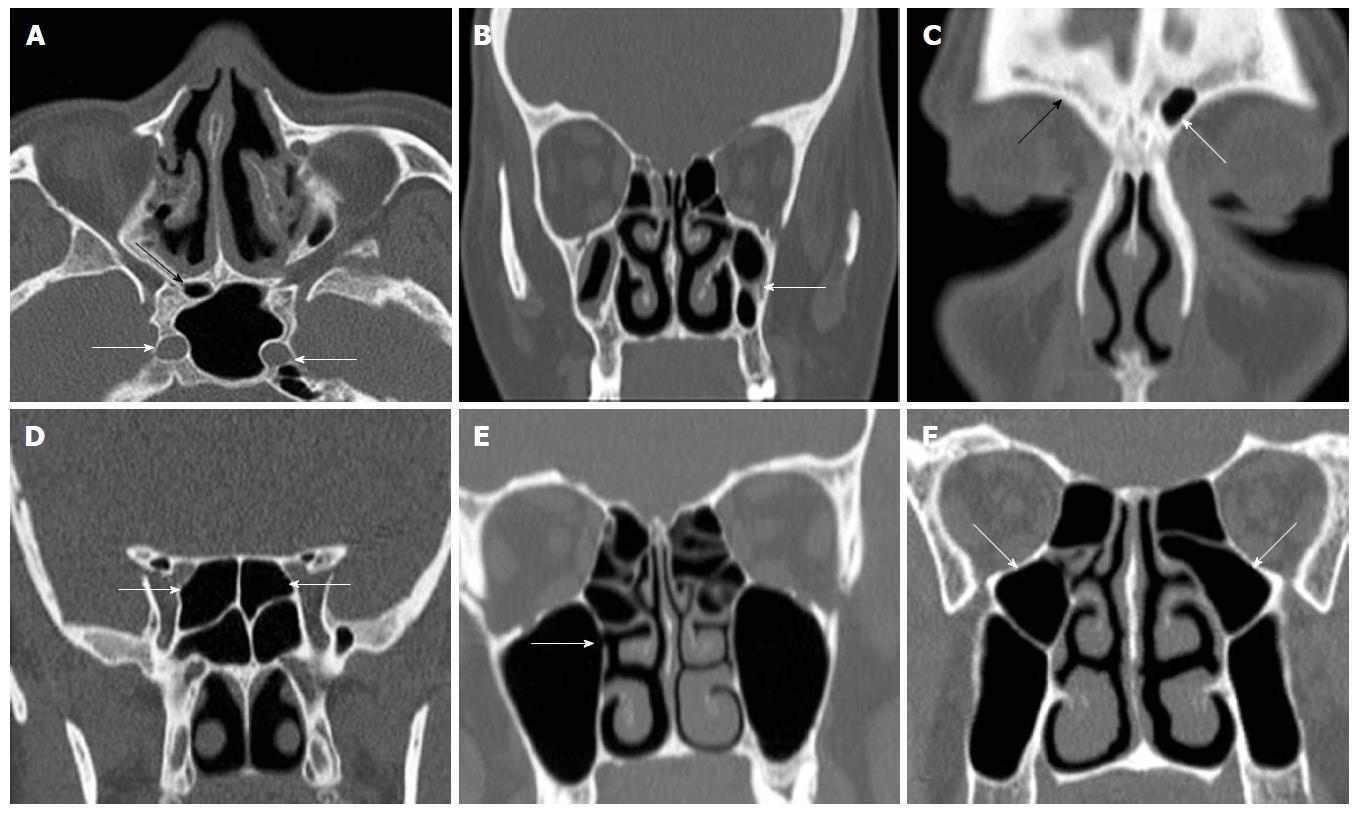
Figure 2 Axial plane (A), coronal reformatted (B-F) computerized tomography images shows different variations.
A: Right sphenoid sinus hypoplasia (black arrow) and bilaterally internal carotid artery protrusion into left sphenoid sinus; B: Bilaterally maxillary sinus hypoplasia and left intersinus septa (white arrow); C: Right frontal sinus aplasia (black arrow) and left frontal sinus hypoplasia (white arrow); D: Bilaterally Onodi cells (white arrows); E: Right maxillary sinus accessory ostium (white arrow); F: Bilaterally ethmomaxillary sinus.
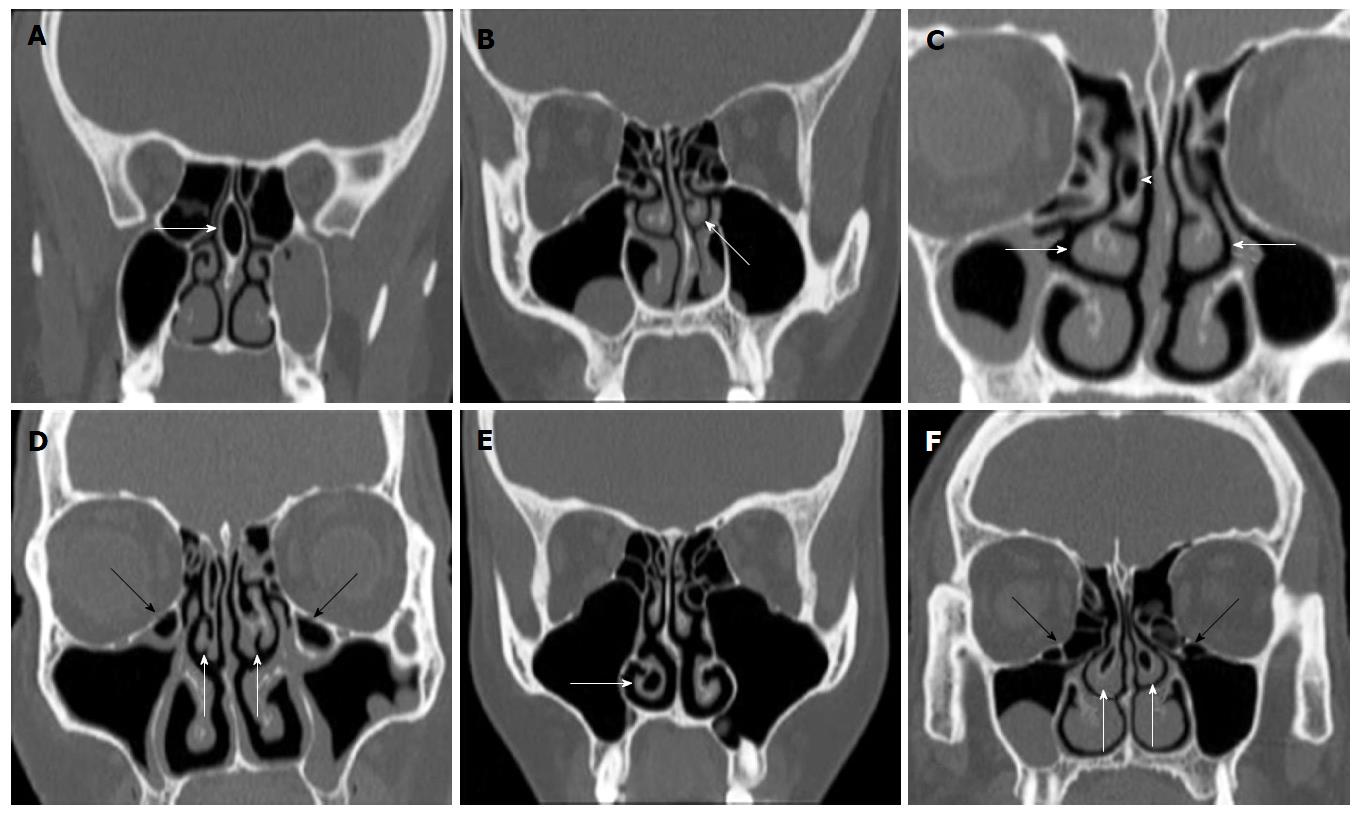
Figure 3 Coronal reformatted computerized tomography images shows different variations.
A: Pneumatized nasal septum (arrow); B: Left paradoxical middle turbinate (arrow) and deviated nasal septum; C: Bilaterally paradoxical middle turbinates (arrows) and right vertical lamellar concha bullosa (arrow head); D: Bilaterally secondary middle turbinate (white arrows) and bilaterally Haller cells (black arrows); E: Right pneumatized inferior turbinate; F: Bilaterally inferior bulbous concha bullosa (white arrows) and bilaterally Haller cells (black arrows).
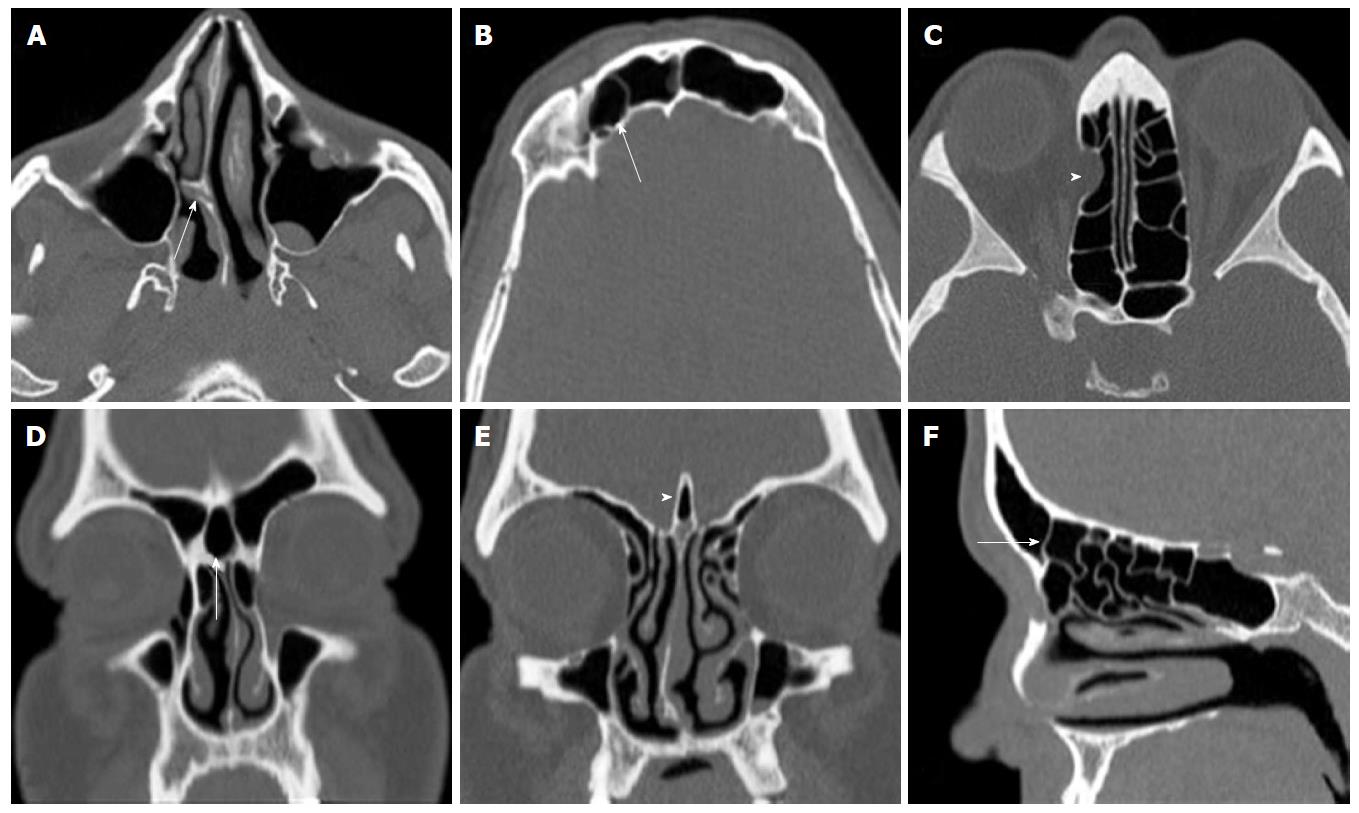
Figure 4 Axial plane (A-C), coronal reformatted (D and E), sagittal reformatted (F) computerized tomography images shows different variations.
A: Nasal septal spur (arrow) and deviated septum; B: Right supraorbital ethmoidal cell (arrow); C: Right lamina papyracea dehiscence (arrow head); D: Frontal intersinus septal cell (arrow); E: Crista galli pneumatization (arrow head) and deviated nasal septum; F: Frontal bulla cell (arrow).
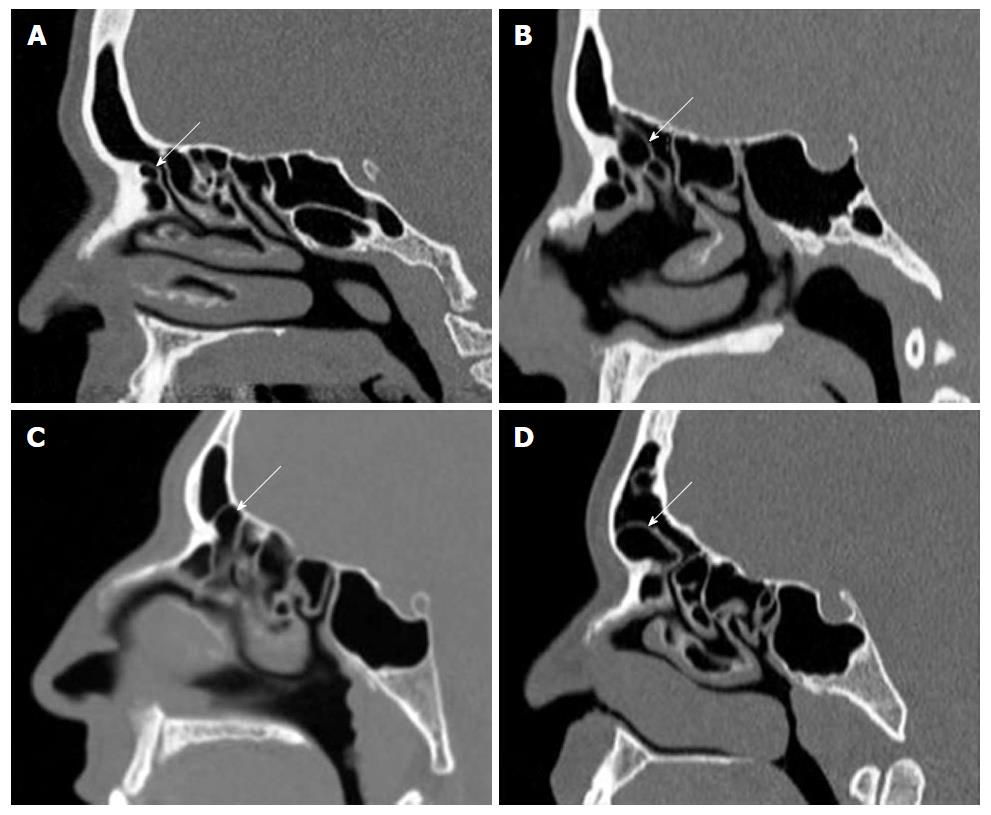
Figure 5 Sagittal reformatted computerized tomography images shows fronto-ethmoidal cells (Kuhn cells).
A: Type 1; B: Type 2; C: Type 3; D: Type 4.
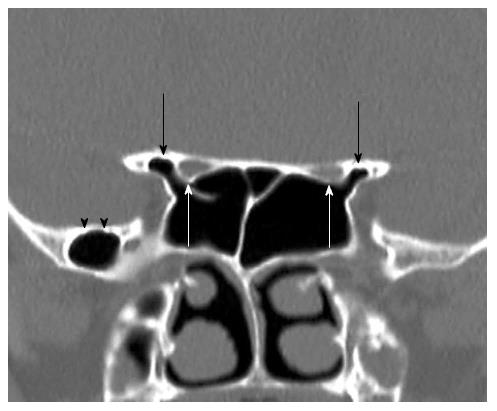
Figure 6 Coronal reformatted computed tomography image shows bilaterally anterior clinoid process pneumatization (black arrows) and optic nerves protrusion (white arrows) into sphenoid sinuses.
Additionally shows right greater sphenoid wing pnematization (black arrow heads).
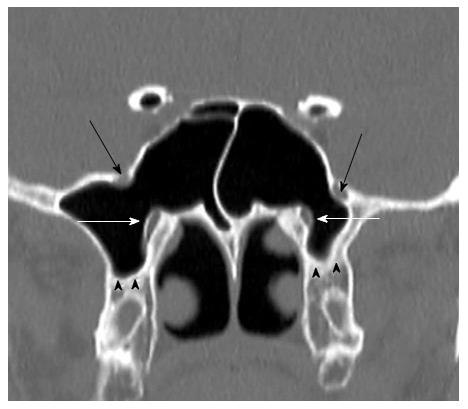
Figure 7 Coronal reformatted computerized tomography image shows bilaterally maxillary nerves (black arrows) and vidian nerves (white arows) protrusion into sphenoid sinus.
Additionally shows bilaterally pterygoid process pnematization (black arrow heads).
- Citation: Dasar U, Gokce E. Evaluation of variations in sinonasal region with computed tomography. World J Radiol 2016; 8(1): 98-108
- URL: https://www.wjgnet.com/1949-8470/full/v8/i1/98.htm
- DOI: https://dx.doi.org/10.4329/wjr.v8.i1.98


