Copyright
©2014 Baishideng Publishing Group Inc.
World J Radiol. Aug 28, 2014; 6(8): 544-566
Published online Aug 28, 2014. doi: 10.4329/wjr.v6.i8.544
Published online Aug 28, 2014. doi: 10.4329/wjr.v6.i8.544
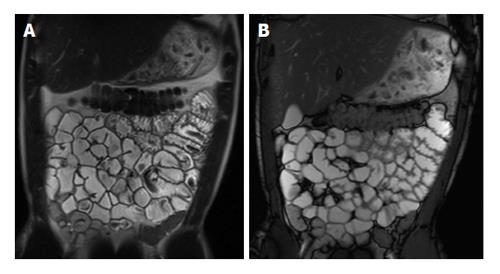
Figure 1 Coronal T2-weighted single shot fast spin echo and coronal balanced steady state free precession images.
Good bowel distension is achieved with the administration of peroral fluid (A and B). Balanced steady state free precession sequence (B) is robust to flow voids; in addition to its ability to demonstrate fine anatomical details including bowel thickness, mesenteric vessels and lymph nodes; even without the use of spasmolytic agents.
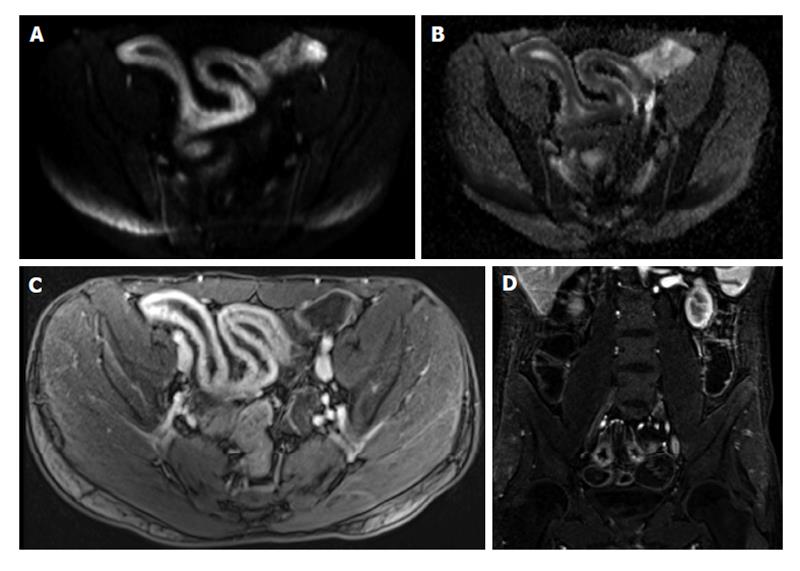
Figure 2 Active distal ileal Crohn’s disease.
Axial diffusion weighted imaging (A) (b = 150) and (B) apparent diffusion coefficient map as well as (C) axial and (D) coronal fat-suppressed post-gadolinium 3D-GRE T1-weighted images. There is a long segment of distal ilial diffuse thickening associated with diffusion restriction (A and B) as well as significant contrast enhancement (C) and vasa recta engorgement (comb sign) (D) in keeping with active Crohn’s disease. GRE: Gradient recalled echo.
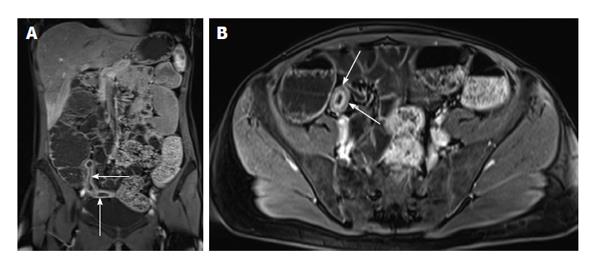
Figure 3 Enhancement of bowel wall layers in active Crohn’s disease.
Coronal (A) and (B) axial fat-suppressed post-gadolinium 3D-GRE T1-weighted images during the (A) arterial and (B) enteric in a patient with active Crohn’s disease. There is extensive mucosal enhancement involving the affected terminal ileum (arrows, A), reflecting active disease. Enteric phase images (B) shows serosal enhancement providing the tri-laminar appearance of active disease (arrows, B). GRE: Gradient recalled echo.
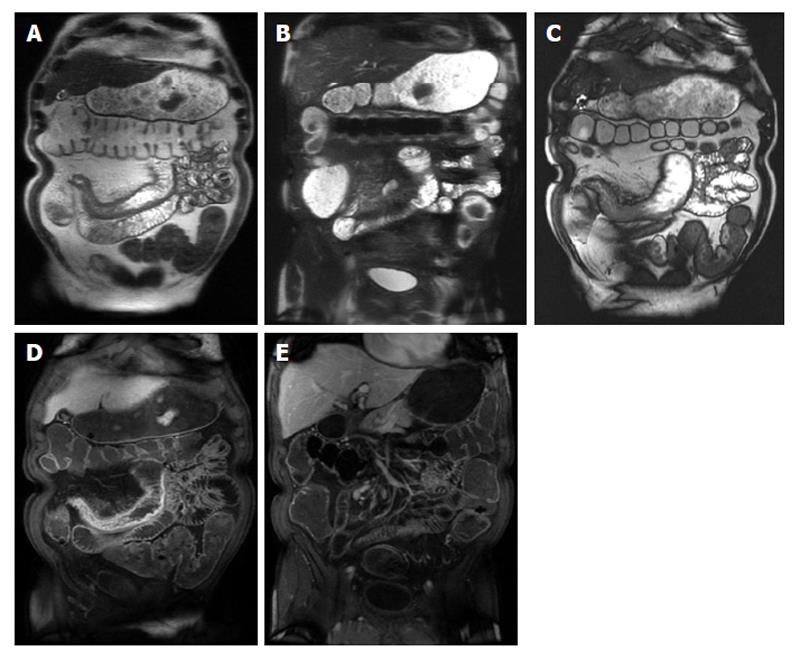
Figure 4 Active Crohn’s disease.
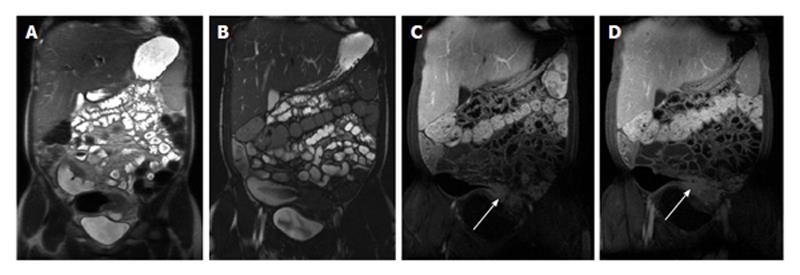
A and B: Coronal T2-weighted single shot fast spin echo without and with fat suppression and © coronal balanced steady state free precession image as well as coronal fat-suppressed post-gadolinium 3D-GRE T1-weighted images during the (D) arterial and E: interstitial phases. There is abnormal bowel wall thickening and edema involving distal ileal segments, associated with small fluid collection in the adjacent mesentery (A and B), engorgement of the mesenteric vessels (comb sign) (C-E), and extensive mucosal enhancement (D and E), in addition to the presence of enhancing mesenteric lymph nodes, in keeping with active Crohn’s disease.
Figure 5 Active Crohn’s disease.
A: Coronal T2-weighted single shot fast spin echo and (B) coronal balanced steady state free precession (bSSFP) images as well as (C) coronal fat-suppressed post-gadolinium 3D-GRE T1-weighted images during the interstitial phase. There is an abnormal segment of distal ileal thickening with diffuse submucosal increased T2 signal intensity (arrows, A) displaying high signal intensity, consistent with edema. The bSSFP image (B) doesn’t demonstrate submucosal edema, but clearly depicts mesenteric lymph nodes and comb sign, associated with extensive mucosal enhancement (arrows, C), reflecting disease activity. Fibrofatty proliferation around the affected ileal segments is also seen. GRE: Gradient recalled echo.
Figure 6 Chronic Crohn’s disease.
A: Coronal T2-weighted single shot fast spin echo and (B) coronal balanced steady state free precession (bSSFP), images as well as coronal fat-suppressed post-gadolinium 3D-GRE T1-weighted images during the (C) arterial and (D) interstitial phases. There is an intermediately low T2 signal intensity bowel wall thickening involving the distal ileum (A), also well-appreciated on bSSFP image (B), showing negligible enhancement on post-gadolinium images (arrows, C and D), consistent with chronic fibrotic segment without superimposed inflammation. A pre-stenotic dilatation is observed. GRE: Gradient recalled echo.
Figure 7 Acute on chronic Crohn’s disease.
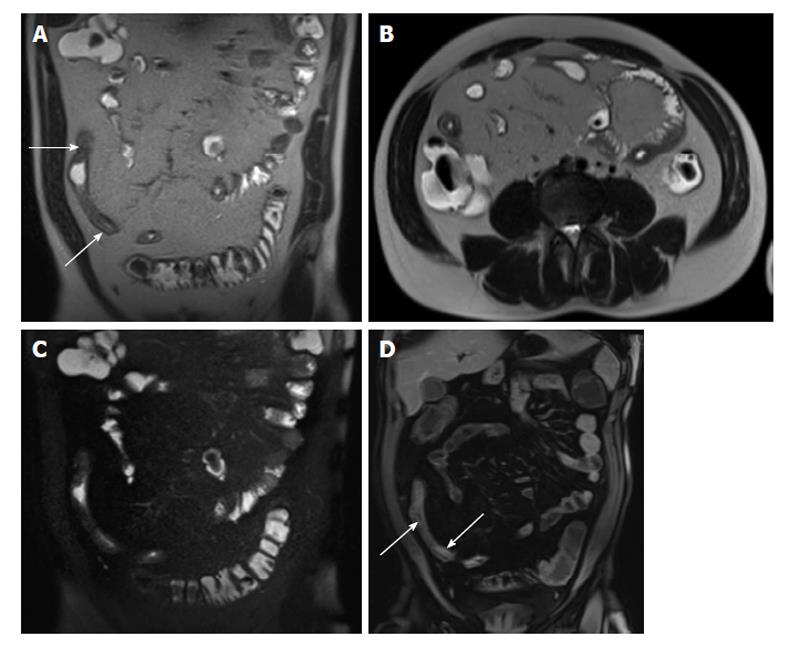
A: Coronal and (B) axial T2-weighted single shot fast spin echo (SSFSE) as well as (C) coronal fat-suppressed T2-weighted SSFSE and (D) coronal fat-suppressed interstitial post-gadolinium 3D-GRE T1-weighted images during the interstitial phase. There is distal small bowel segment which demonstrates diffuse thickening and luminal narrowing (arrows, A), associated with submucosal high signal intensity on T2-weighted images (A and B) and with low-signal intensity on the fat-suppressed T2-weighted images (C), related to submucosal fat deposition, in keeping with chronic Crohn’s disease. There is also a superimposed increased mucosal enhancement in affected bowel segments (arrows, D) and comb sign post-gadolinium images (D), reflecting disease activity, in keeping with acute on top of chronic disease. GRE: Gradient recalled echo.
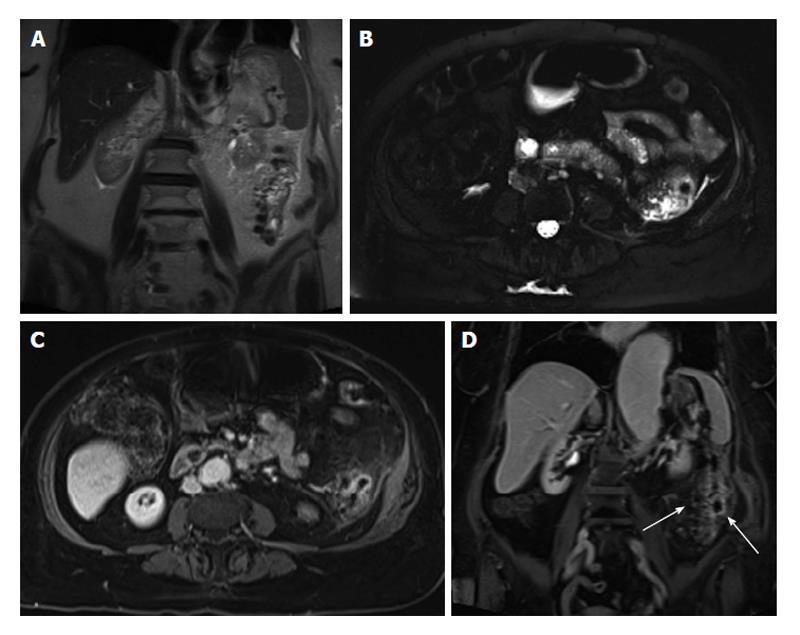
Figure 8 Enteroenteric fistula in active Crohn’s disease.
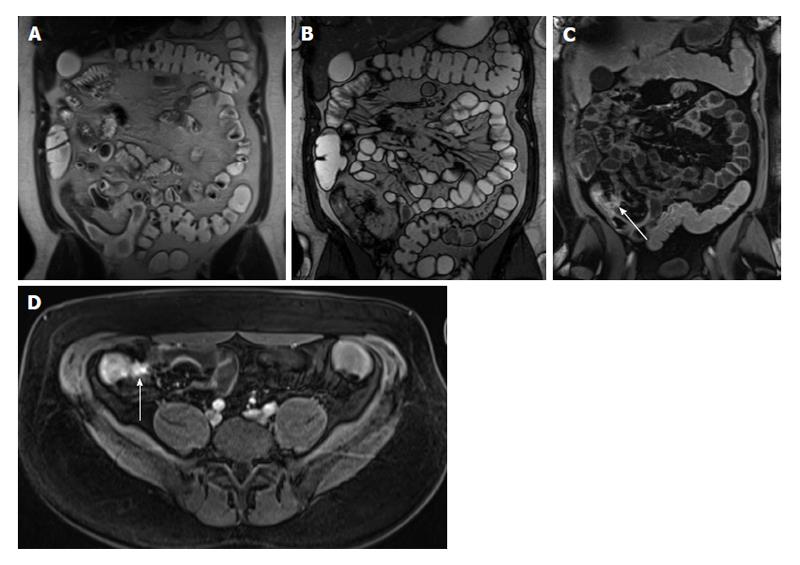
A: Coronal T2-weighted single shot fast spin echo and (B) coronal balanced steady state free precession images as well as (C) axial and (D) coronal fat-suppressed post-gadolinium 3D-GRE T1-weighted images during the (C) enteric and (D) interstitial phases. There is short-segment terminal ileal wall thickening (A and B), which shows extensive mucosal enhancement (C and D). There is also a linear tract extending from the involved segment to an adjacent ileal loop, showing increased enhancement, consistent with enteroenteric fistula (arrows, C and D). GRE: Gradient recalled echo.
Figure 9 Abscess formation complicating active Crohn’s disease.
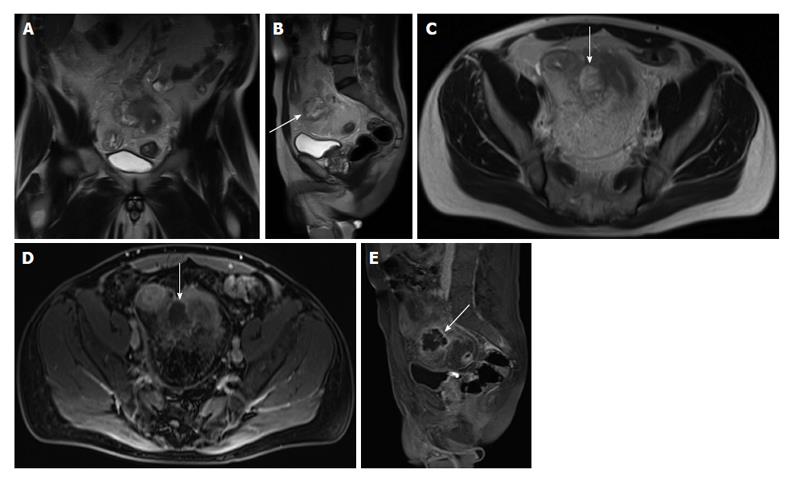
A: Coronal; B: Sagittal; C: Axial T2-weighted TSE images; D: Axial; E: Sagittal fat-suppressed post-gadolinium 3D-GRE T1-weighted images during the interstitial phase. Here is evidence of thickened small bowel loop segment and interloop mesenteric high T2 signal fluid collection (A, arrows, B and C) is noted, associated with rim enhancement (arrows, D and E) in keeping with mesenteric abscess formation complicating active Crohn’s disease. GRE: Gradient recalled echo.
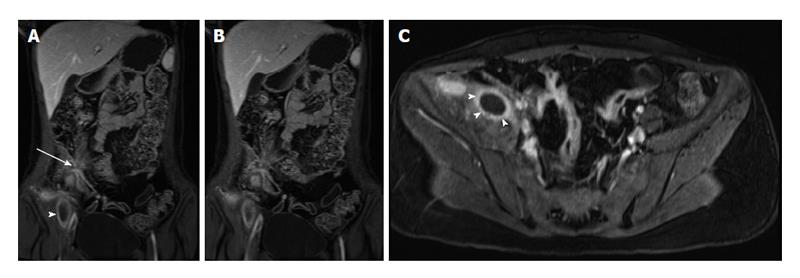
Figure 10 Active distal ileal Crohn’s disease with complex fistulization and iliopsoas abscess formation.
A and B: Coronal; C: Axial fat-suppressed post-gadolinium 3D-GRE T1-weighted images. There is evidence of terminal ilial thickening and enhancement in keeping with active Crohn’s disease, associated with complex ileoileal and ileosigmoidal fistula formation (star sign, arrow, A and B) as well as iliopsoas inflammation and abscess formation (arrowheads, A, B and C). GRE: Gradient recalled echo.
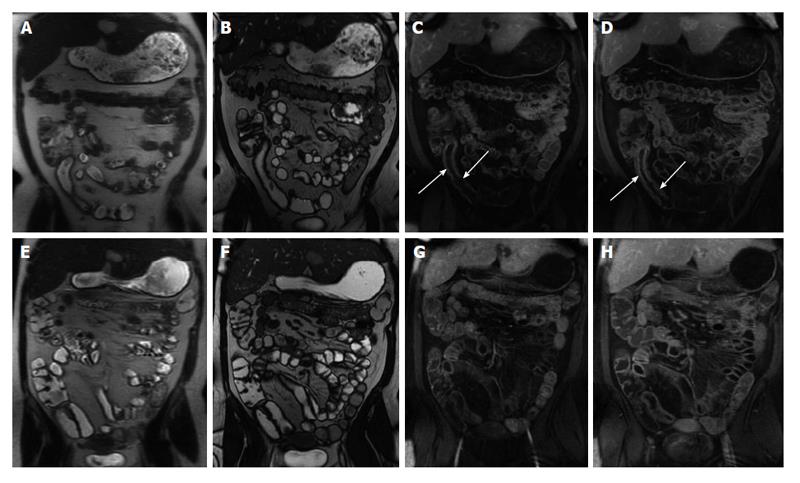
Figure 11 Imaging followup in a patient with Crohn’s disease.
A and E: Coronal T2-weighted single shot fast spin echo; B and F: Coronal balanced steady state free precession images; C and G: Coronal; D and H: Axial fat-suppressed post-gadolinium 3D-GRE T1-weighted images. There is evidence of active Crohn’s disease involving a long segment of the terminal ileum (A, B, C and D) in form of diffuse wall thickening and submucosal mucosal enhancement (arrows, C and D). Four-month re-evaluation shows interval decreased wall thickening and significant decreased mucosal/serosal enhancement, consistent with favourable response to medical therapy. GRE: Gradient recalled echo.
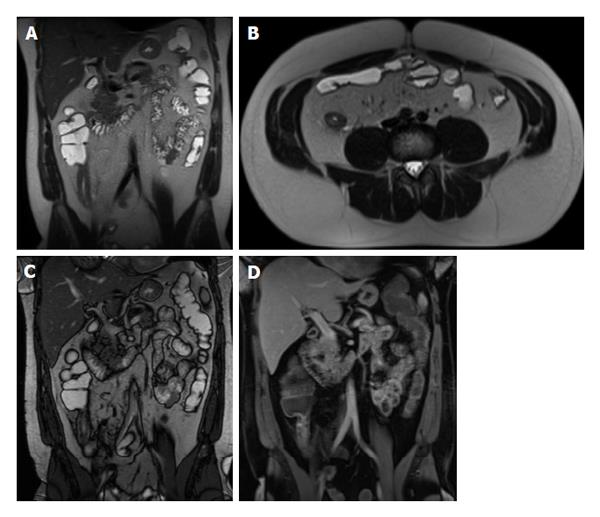
Figure 12 Recurrent Crohn’s disease post-surgery.
A: Coronal; B: Axial T2-weighted single shot fast spin echo images; C: Coronal balanced steady state free precession; D: Coronal fat suppressed post-gadolinium 3D-GRE T1-weighted images. The patient is post distal ileal resection with a low-lying ileocolic anastomosis. The remaining distal ileum displays signs of active inflammation, namely bowel wall thickening and submucosal edema (A and B) associated with mucosal and serosal increased enhancement post-gadolinium (D) in keeping with recurrent Crohn’s disease post-surgery. GRE: Gradient recalled echo.
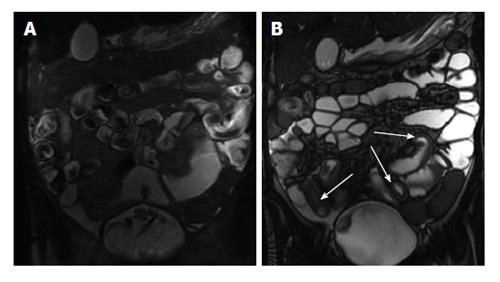
Figure 13 Type 2 Gluten-sensitive enteropathy (Celiac disease).
A: Coronal T2-weighted single shot fast spin echo; B: Coronal balanced steady state free precession images show an abnormal ileal fold pattern with substantial decrease in the number of jejunal folds suggesting the diagnosis of celiac disease. Concomitantly, jejunal and ileal segments with increased mural thickening and stratification are seen (arrows, B), consistent with superimposed active inflammation.
Figure 14 Gluten-sensitive enteropathy (celiac disease).
A: Coronal T2-weighted single shot fast spin echo; B: Coronal balanced steady state free precession; C: Coronal fat-suppressed post-gadolinium 3D-GRE T1-weighted images during the interstitial phase. There is abnormal ileal fold pattern with increased number of folds mimicking the appearance of the jejunum (ileal jejunization) in keeping with the diagnosis of celiac disease. GRE: Gradient recalled echo.
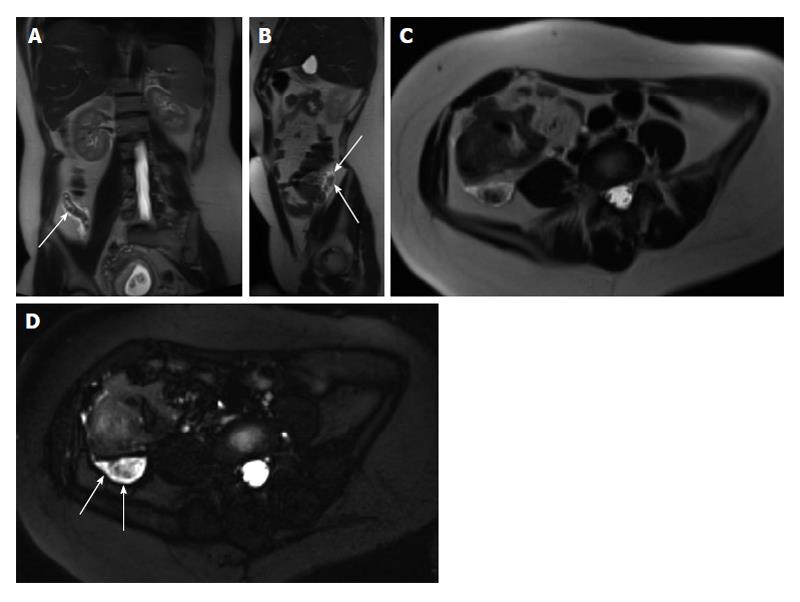
Figure 15 Radiation proctocolitis.
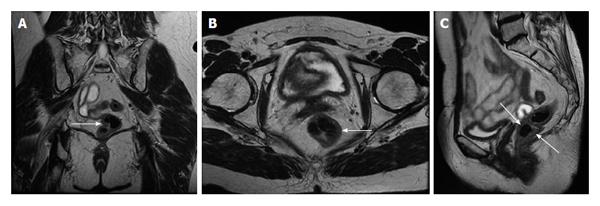
A: Coronal; B: Axial; C: Sagittal T2-weighted TSE. The rectum and distal sigmoid colon demonstrates increased wall thickness with intermediate signal intensity on T2-weighted images (arrows, A, B and C). This patient underwent hysterectomy and radiation therapy. These findings are compatible with radiation proctocolitis. TSE: Turbo spin echo.
Figure 16 Crohn’s colitis.
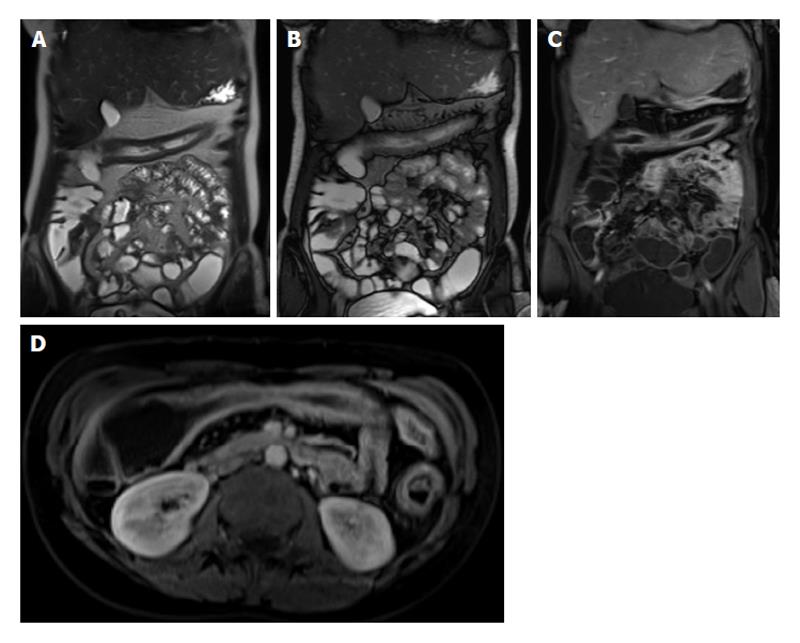
A: Coronal T2-weighted single shot fast spin echo; B: Coronal balanced steady state free precession images; C: Coronal; D: Axial fat-suppressed post-gadolinium 3D-GRE T1-weighted images. There is a segmental uniform thickening of the transverse colon associated with submucosal edema (A and B), mucosal hyper-enhancement, and engorgement of the supplying mesenteric vessels (C and D) in keeping with active Crohn’s colitis. Also of note is the focal hyper-enhancement of the terminal ileum (C). GRE: Gradient recalled echo.
Figure 17 Active colonic ulcerative colitis.
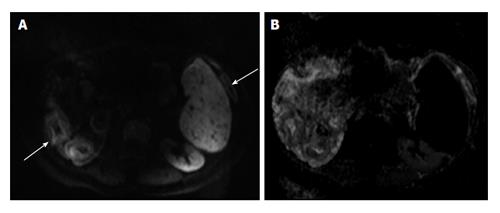
A: Axial diffusion-weighted imaging (b = 650 s/mm2); B: ADC map images. There is diffuse thickening involving the colon associated wish diffuse mucosal diffusion restriction (arrows A) in keeping with active ulcerative colitis. ADC: Analog-digital conversion.
Figure 18 Chronic ulcerative colitis.
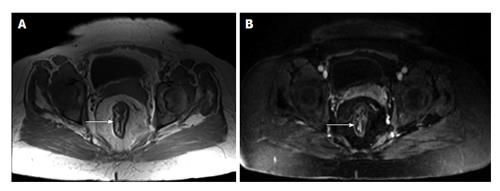
A: Axial in-phase T1-weighted; B: Axial fat-suppressed post-gadolinium 3D-GRE T1-weighted images. There is diffuse rectal submucosal increased T1 signal (arrow, A), which demonstrates low signal on fat-suppression (arrow, B), but no significant arterial enhancement (B), in keeping with chronic ulcerative colitis. GRE: Gradient recalled echo.
Figure 19 Left colonic diverticulitis.
A: Coronal T2-weighted single shot fast spin echo (SSFSE); B: Axial fat-suppressed T2-weighted SSFSE; C: Axial and D: Coronal fat-suppressed post-gadolinium 3D-GRE T1-weighted images during the interstitial phase. There is wall thickening of the descending colon (A), with pericolonic free fluid, better depicted on axial T2-weighted SSFSE image (B). Post-gadolinium images (C and D) show marked enhancement of the left colon, with pericolonic enhancement including the pre-renal fascia. Coronal postgadolinium image (D) shows left colonic diverticula and associated bowel wall and vasa recti engorgement (arrows), consistent with inflammation. GRE: Gradient recalled echo.
Figure 20 Acute appendicitis in a pregnant patient.
A: Coronal; B: Sagittal; and C: Axial single shot fast spin echo (SSFSE) T2 as well as D: fat-suppressed SSFSE T2 images. There is a blind-ended tubular structure at the retrocecal region (arrows, A, B) associated with uniform, diffuse wall thickening and dilatation, reaching up to 13 mm in diameter (C and D) as well as periappendiceal edema and small periappendiceal fluid (A-D) collection, in keeping with acute appendicitis. Edema and fluid appear significantly more conspicuous on fat-suppressed images (arrows, D). Noted is a gravid uterus (A).
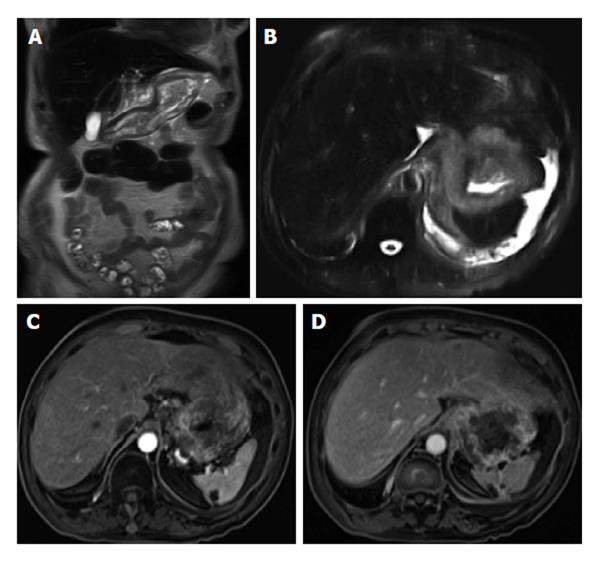
Figure 21 Gastric adenocarcinoma.
A: Coronal T2-weighted single shot fast spin echo (SSFSE); B: Axial fat suppressed T2-weighted SSFSE; C: Axial arterial; D: Interstitial post-gadolinium 3D-GRE T1-weighted images. There is diffuse heterogeneous wall thickening of the stomach (A and B) with heterogeneous enhancement (C and D) consistent with linitis plastica. GRE: Gradient recalled echo.
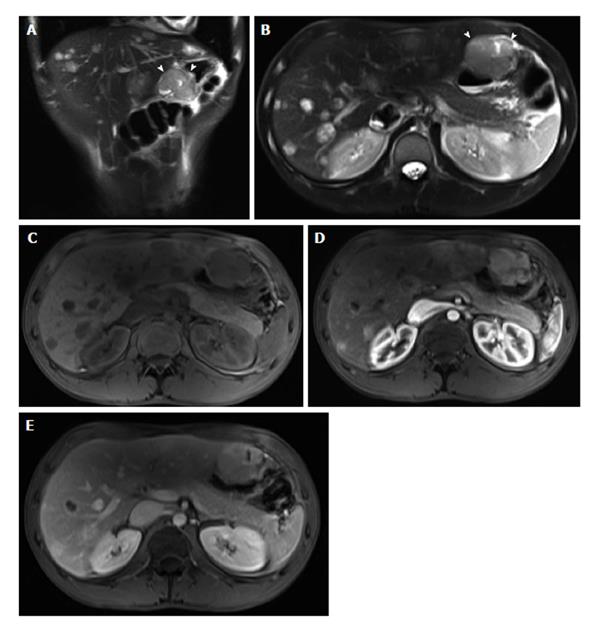
Figure 22 Metastatic malignant gastric gastrointestinal stromal tumors.
A: Coronal T2-weighted single shot fast spin echo (SSFSE); B: Axial fat suppressed T2-weighted SSFSE; C: Pre- and post-gadolinium 3D-GRE T1-weighted images during the (D) arterial and (E) interstitial phases. There is a hyperintense mass within the wall of the gastric antrum, which abuts the edge of the left lobe of the liver; Central necrosis is seen (arrowheads, A and B). Multiple liver lesions show heterogeneously increased T2 signal and hypervascular characteristics, fading to isointensity on late phase of enhancement, consistent with metastases. GRE: Gradient recalled echo.
Figure 23 Non-Hodgkin lymphoma of the stomach.
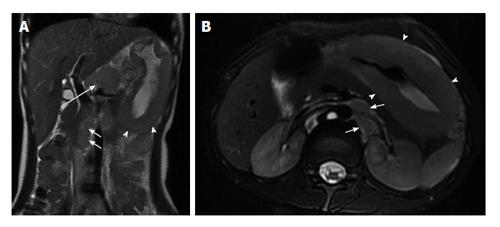
A: Coronal T2-weighted single shot fast spin echo (SSFSE) and (B) axial fat-suppressed T2-weighted SSFSE images. There is marked, diffuse, asymmetric gastric wall thickening with smooth outlines, predominantly involving the gastric body and antrum, associated with mildly increased heterogeneous T2 signal intensity (arrowheads, A and B), large conglomerate nodal mass at the gastrohepatic ligament (long arrow, A), and multiple enlarged retroperitoneal lymph nodes (short arrows A and B). Constellation of findings is diagnostic of non-Hodgkin gastric lymphoma with diffuse abdominal lymphadenopathy.
Figure 24 Jejunal gastrointestinal stromal tumor.
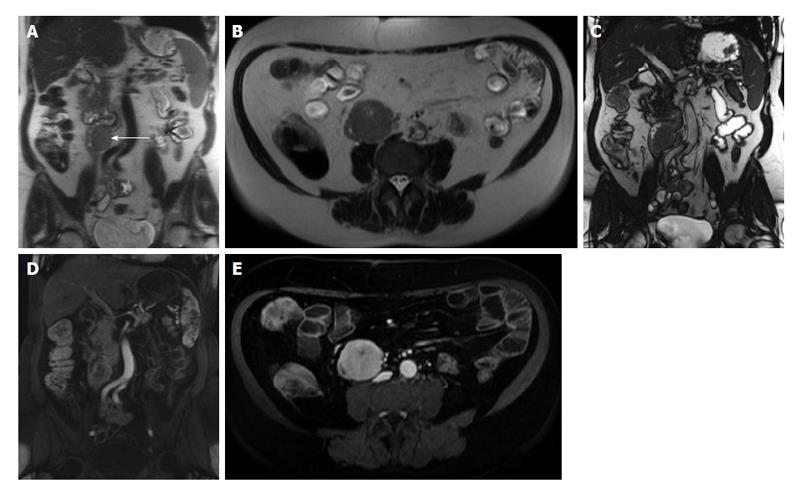
A: Coronal and (B) axial T2-weighted single shot fast spin echo, and (C) coronal balanced steady state free precession images as well as (D) coronal and (E) axial fat-suppressed post-gadolinium 3D-GRE T1-weighted images. There is a well-defined intramural, exophytic mass lesion arising from the proximal jejunum, in a patient with malrotation, which demonstrates intermediately increased T2 signal (arrow, A, B), early moderate hypervascularity (D) and progressive enhancement (E) post-gadolinium associated with a tiny central area of necrosis in keeping with jejunal gastrointestinal stromal tumor. Lack of proximal bowel obstruction is consistent with its eccentric origin. GRE: Gradient recalled echo.
Figure 25 Jejunal lymphoma.
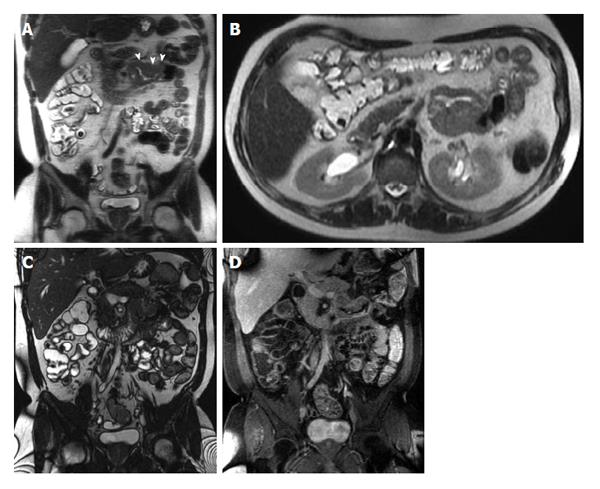
A: Coronal and (B) axial T2-weighted single shot fast spin echo, (C) coronal balanced steady state free precession, and (D) coronal fat-suppressed post-gadolinium 3D-GRE T1-weighted images. There is a short segment of proximal jejunal circumferential, irregular, asymmetric wall thickening resulting in luminal narrowing (arrowheads, A) and demonstrates and intermediate T2 signal (A and B) and mild enhancement post-gadolinium (D) in keeping with a pathologically proven jejunal lymphoma. GRE: Gradient recalled echo.
Figure 26 Mesenteric carcinoid.
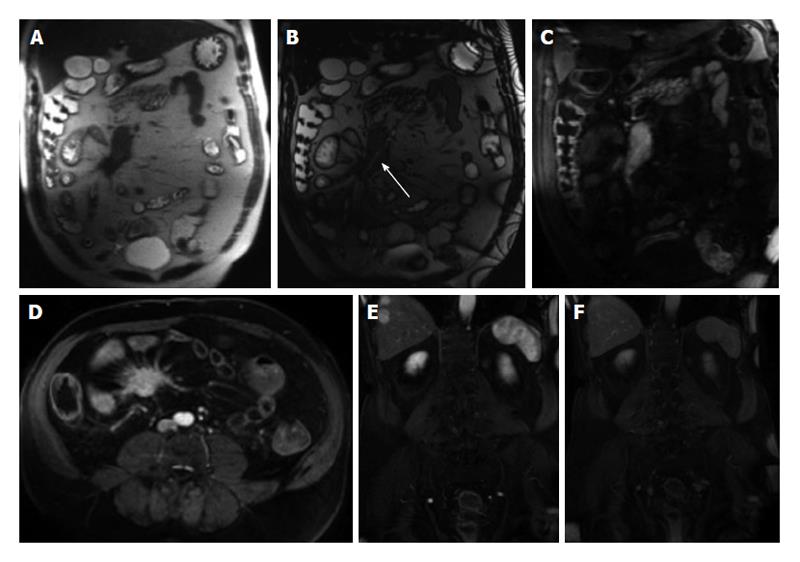
A: Coronal T2-weighted single shot fast spin echo; B: Coronal balanced steady state free precession; C and D: Coronal arterial; E: Axial enteric; F: Coronal interstitial fat-suppressed post-gadolinium 3D-GRE T1-weighted images. There is a large mesenteric mass encasing the superior mesenteric artery and its branches (arrow, B) associated with desmoplastic reaction and small bowel retraction noted on pre-contrast images (A, B), which demonstrates hypervascular (C) and typical sunburst margins (D). Liver metastases are seen with the typical wash-in (D) and washout (F) appearance mimicking the appearance of hepatocellular carcinoma. GRE: Gradient recalled echo.
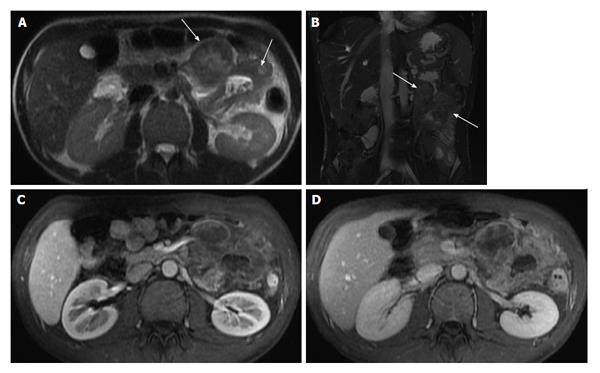
Figure 27 Jejunal adenocarcinoma.
A: Axial T2-weighted single shot fast spin echo and (B) coronal balanced steady state free precession images as well as axial fat-suppressed post-gadolinium 3D-GRE T1-weighted images during the (C) hepatic arterial dominant and (D) hepatic venous phases. There is significant circumferential, irregular, asymmetric wall thickening of the proximal jejunum with exophytic extension (arrows, A and B) and hypovascular enhancement pattern (C and D) in keeping with a pathologically proven jejunal adenocarcinoma. GRE: Gradient recalled echo.
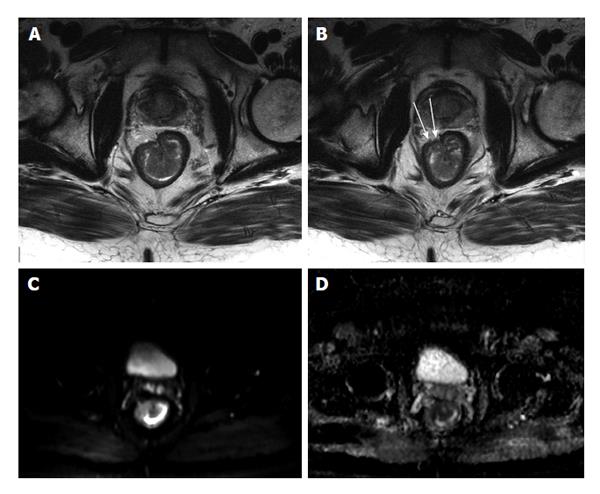
Figure 28 Stage T3 rectal cancer.
A and B: Axial high-resolution T2-weighted images as well as axial (C) diffusion-weighted imaging (b = 650 s/mm2) and (D) ADC map images. There is a large polypoidal mass lesion arising from the right anterolateral lower rectal wall (A and B) with two foci of tumoral extension beyond the low-signal serosal layer (arrows, B) that show diffusion restriction (C and D) in keeping with stage T3 rectal tumor. ADC: Analog-digital conversion.
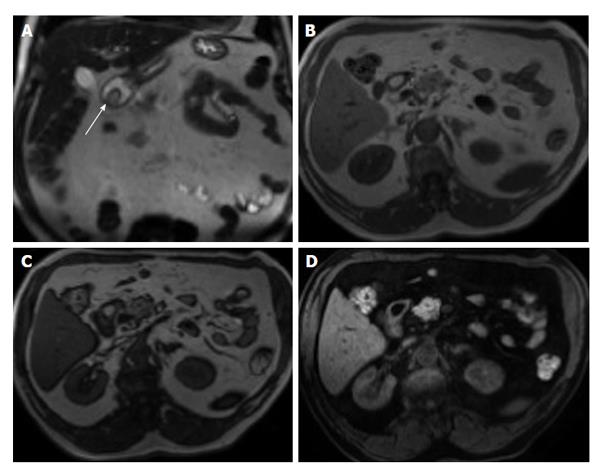
Figure 29 Duodenal lipoma.
A: Coronal T2-weighted single shot fast spin echo (SSFSE); B: Axial GRE in-phase; C: Opposed-phase T1-weighted; D: Axial fat-suppressed 3D-GRE T1-weighted images. Small, well-defined, intra-luminal, duodenal mass lesion; which demonstrates intermediately high signal on SSFSE (arrow, A), high signal intensity on the in-phase T1 weighted image (B), no drop of signal on the opposed-phase images (C), and homogenously low signal intensity on the fat-suppressed image (D) in keeping with duodenal lipoma. GRE: Gradient recalled echo.
- Citation: Liu B, Ramalho M, AlObaidy M, Busireddy KK, Altun E, Kalubowila J, Semelka RC. Gastrointestinal imaging-practical magnetic resonance imaging approach. World J Radiol 2014; 6(8): 544-566
- URL: https://www.wjgnet.com/1949-8470/full/v6/i8/544.htm
- DOI: https://dx.doi.org/10.4329/wjr.v6.i8.544


