Copyright
©2014 Baishideng Publishing Group Inc.
World J Radiol. Oct 28, 2014; 6(10): 840-845
Published online Oct 28, 2014. doi: 10.4329/wjr.v6.i10.840
Published online Oct 28, 2014. doi: 10.4329/wjr.v6.i10.840
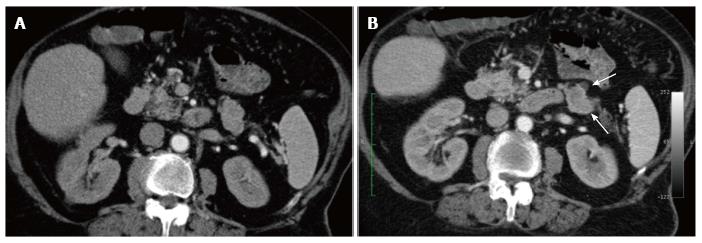
Figure 1 Contrast-enhanced multi-detector computed tomography: Transverse 3 mm thick images of arterial (A) and pancreatic phase (B) are shown.
Computed tomography findings were prospectively considered negative as no definite hyper-vascular lesion could be appreciated. Retrospectively, a mildly, inhomogeneously enhancing lesion could be appreciated at the level of the pancreatic tail (arrow-head) with a small cyst on its anterior margin (arrow), both more conspicuous on the pancreatic phase (B) than in the arterial phase (A) measuring 79 vs 67 HU, respectively. In both images a faint cortico-medullary nephrogram is depicted due to the chronic renal insufficiency.
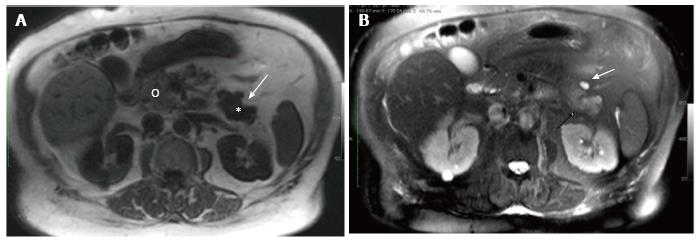
Figure 2 Unenhanced magnetic resonance.
FFE T1- (A) and HASTE T2- (B) weighted axial 6 mm thick images are shown. In (A) the lesion (dashed-arrow) exhibit an uniform low signal intensity (*) compared to the cephalic pancreatic parenchyma (°). In (B) the lesion (arrow-head) shows a mild and inhomogeneous hyper-intense signal with an associated small cyst on its anterior margin (arrow).
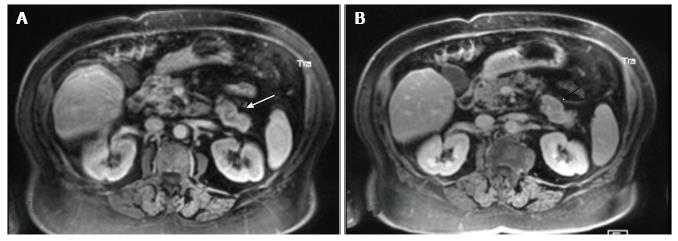
Figure 3 Contrast-enhanced magnetic resonance.
Gadolinium-enhanced (0.1 mmol/kg) VIBE T1 Fat-suppressed 3 mm thick images are shown in both the arterial (A) and delayed (B) phase. Despite motion artifacts arterial phase image (A) shows an inhomogeneously enhancing lesion (3.7 cm × 1.7 cm) at the level of the pancreatic tail (arrow). The lesion exhibits a rim of peripheral enhancement (arrow-head) in the delayed phase (B).
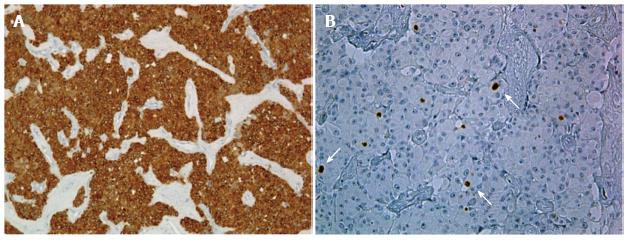
Figure 4 Well-differentiated pancreatic vipoma: Immuno-histochemical analysis (x 10) on 4 μm thick, serial sections of a paraffin block of the tumor.
Stains for Chromogranine-A (A) and Ki-67 (B) are shown. In (A) an almost uniform and intense expression of Chromogranine-A is depicted. The tumor has a low proliferative rate as assessed by Ki-67 labeling (arrow-heads) with a mean index < 2% (B).
- Citation: Camera L, Severino R, Faggiano A, Masone S, Mansueto G, Maurea S, Fonti R, Salvatore M. Contrast enhanced multi-detector CT and MR findings of a well-differentiated pancreatic vipoma. World J Radiol 2014; 6(10): 840-845
- URL: https://www.wjgnet.com/1949-8470/full/v6/i10/840.htm
- DOI: https://dx.doi.org/10.4329/wjr.v6.i10.840


