Copyright
©2013 Baishideng Publishing Group Co.
World J Radiol. Nov 28, 2013; 5(11): 411-420
Published online Nov 28, 2013. doi: 10.4329/wjr.v5.i11.411
Published online Nov 28, 2013. doi: 10.4329/wjr.v5.i11.411
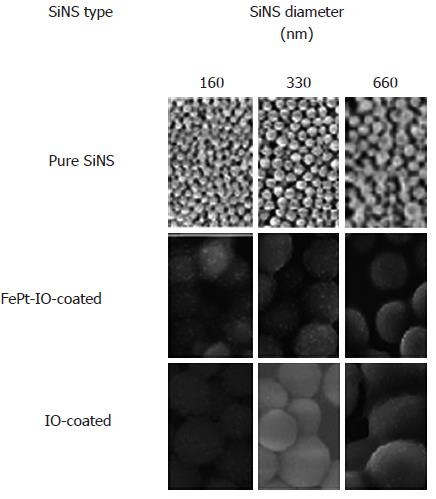
Figure 1 Overview of typical scanning electron microscopy images for each prepared nanoparticle contrast agents sample.
Scale bars in the first row of pictures are 1 mm in 160 nm SiNS diameter, 3 mm in 330 nm SiNS diameter, and 5 mm in 660 nm SiNS diameter. SiNSs: Silica nanospheres; Pure: Uncoated SiNSs; FePt-IO: Ferrum platinum-iron oxide; IO: Iron oxide.
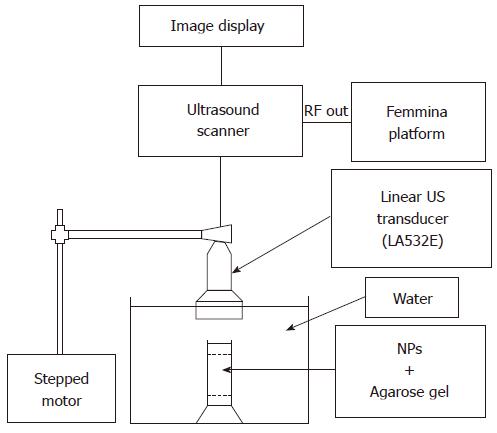
Figure 2 Scheme of the employed ultrasound acquisition system.
The image display and the linear ultrasound transducer (indicated by the arrow in the figure) are electronically connected to the ultrasound scanner; the radiofrequency signal output is transmitted to the FEMMINA Platform by means of optic fiber. The set up is completed by a nanoparticle (NP) containing phantom (indicated in figure as “NP + agarose gel”) immersed in a water tank (pointed by the respective arrow). US: Ultrasound.
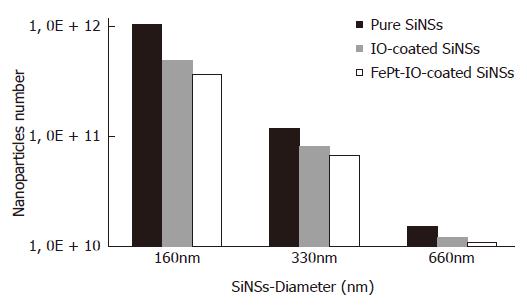
Figure 3 Estimation of nanoparticles number in 5 mg of nanoparticle contrast agents as a function of silica nanospheres diameter.
SiNSs: Silica nanospheres; Pure: Uncoated SiNSs; FePt-IO: Ferrum platinum-iron oxide; IO: Iron oxide.
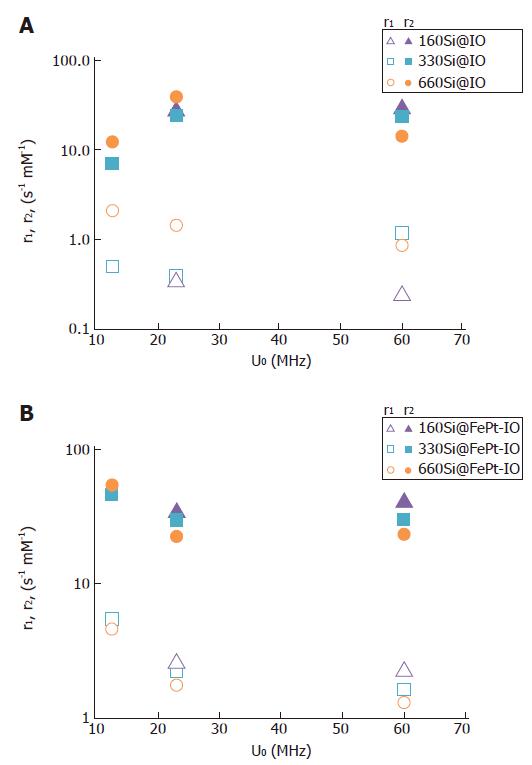
Figure 4 Longitudinal r1 (open symbols) and transverse r2 (full symbols) nuclear relaxitivities of different silica nanospheres.
A: Silica nanospheres covered by IO; B: Silica nanospheres covered by FePt-IO nanoparticles. IO: Iron oxide; FePt-IO: Ferrum platinum-iron oxide.
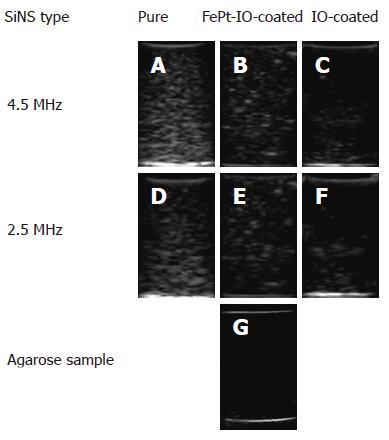
Figure 5 Examples of ultrasound image backscatter determined by pure and nanocomposite (with either ferrum platinum-iron oxide or iron oxide) 660 nm silica nanospheres at maximum and minimum used insonification frequency.
A: Pure SiNSs, 4.5 MHz; B: FePt-IO-coated SiNSs, 4.5 MHz; C: IO-coated SiNSs, 4.5 MHz; D: Pure SiNSs, 2.5 MHz; E: FePt-IO-coated SiNSs, 2.5 MHz; F: IO-coated SiNSs, 2.5 MHz; G: Pure agarose gel. SiNSs: Silica nanospheres; Pure: Uncoated SiNSs; FePt-IO: Ferrum platinum-iron oxide; IO: Iron oxide.
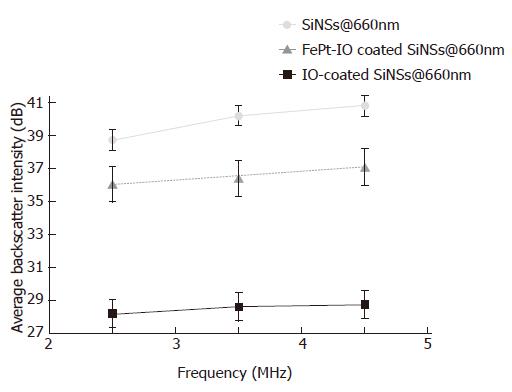
Figure 6 Average backscatter intensity for the three different types of nanoparticle contrast agents at 660 nm silica nanospheres diameter as a function of the frequency employed.
Backscatter values are expressed in dB (values are averaged over 300 frames and error bars represent the standard deviations). SiNSs: Silica nanospheres; FePt-IO: Ferrum platinum-iron oxide; IO: Iron oxide.
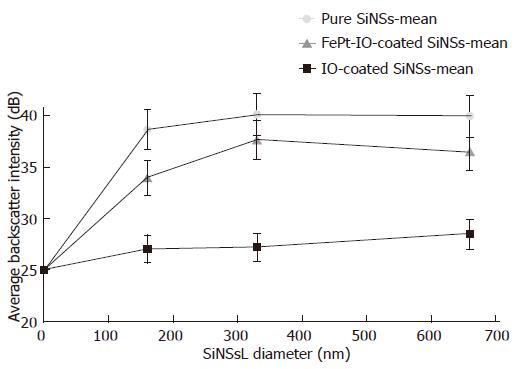
Figure 7 Mean average backscatter intensity for the three different types of nanoparticle contrast agents at each considered silica nanospheres diameter.
Backscatter values are expressed in dB. 0-control point is obtained from pure agarose gel phantom measurements. Each curve represents the mean value of the acoustical response for a specific nanoparticle contrast agents over the entire low frequency range (2.5-4.5 MHz). SiNSs: Silica nanospheres; Pure: Uncoated SiNSs; FePt-IO: Ferrum platinum-iron oxide; IO: Iron oxide.
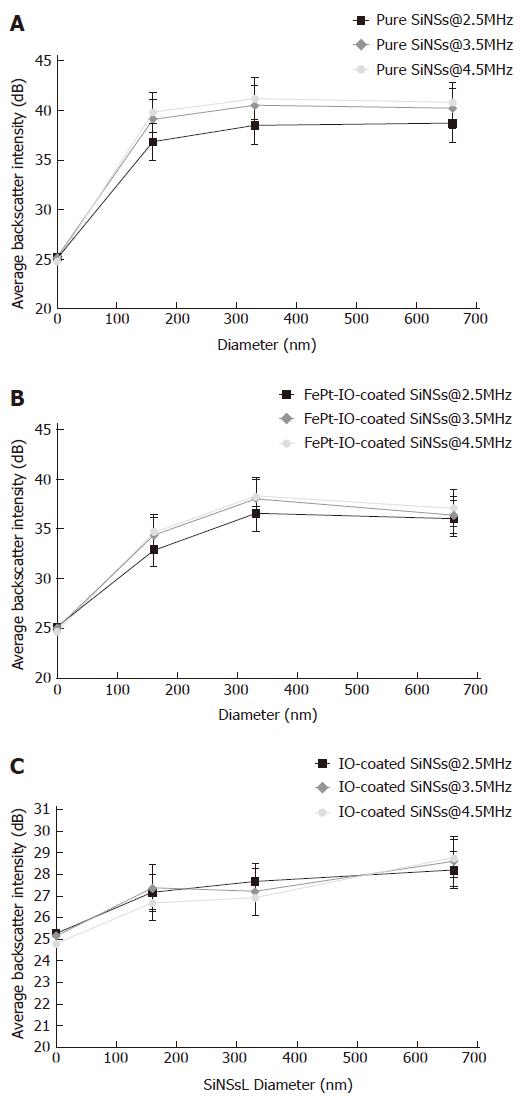
Figure 8 Average backscatter intensity as a function of silica nanospheres diameter for pure silica nanospheres.
A: Pure SiNS; B: FePt-IO coated-SiNS; C: IO-coated SiNSs, at the three investigated ultrasound frequencies. Values of average backscatter intensity are expressed in dB in order to better emphasize lowest values. 0-control point value is obtained from pure agarose gel sample. SiNSs: Silica nanospheres; Pure: Uncoated SiNSs; FePt-IO: Ferrum platinum-iron oxide; IO: Iron oxide.
- Citation: Chiriacò F, Soloperto G, Greco A, Conversano F, Ragusa A, Menichetti L, Casciaro S. Magnetically-coated silica nanospheres for dual-mode imaging at low ultrasound frequency. World J Radiol 2013; 5(11): 411-420
- URL: https://www.wjgnet.com/1949-8470/full/v5/i11/411.htm
- DOI: https://dx.doi.org/10.4329/wjr.v5.i11.411


