Copyright
©2013 Baishideng Publishing Group Co.
World J Radiol. Nov 28, 2013; 5(11): 398-410
Published online Nov 28, 2013. doi: 10.4329/wjr.v5.i11.398
Published online Nov 28, 2013. doi: 10.4329/wjr.v5.i11.398
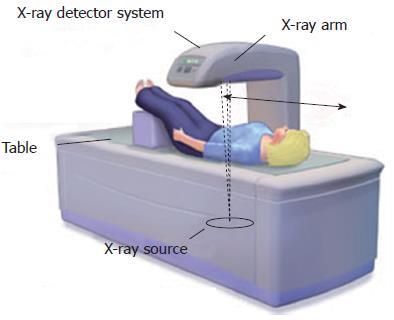
Figure 1 Bone densitometry scan (dual X-ray absorptiometry).
Schematic representation of X-rays source and detector system in dual X-ray absorptiometry device. Adapted from Drugs.com[94].
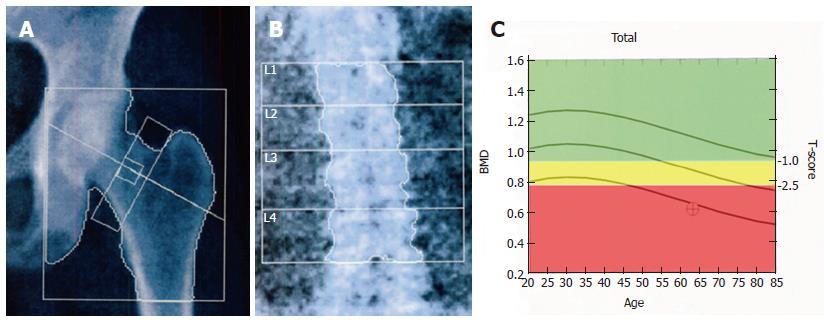
Figure 2 Dual X-ray absorptiometry examination on reference sites.
A: Dual X-ray absorptiometry (DXA) scan of the femoral neck; B: DXA examination of the lumbar spine with analysis of the vertebral bodies (L1-L4); C: A graphic curve of T-score values normalized for age. The green area of the panel indicates normal T- score values (≥ -1.0), the yellow one indicates osteopenia (< -1.0 but > -2.5) and the red area indicates osteoporosis (≤ 2.5). BMD: Bone mineral density.
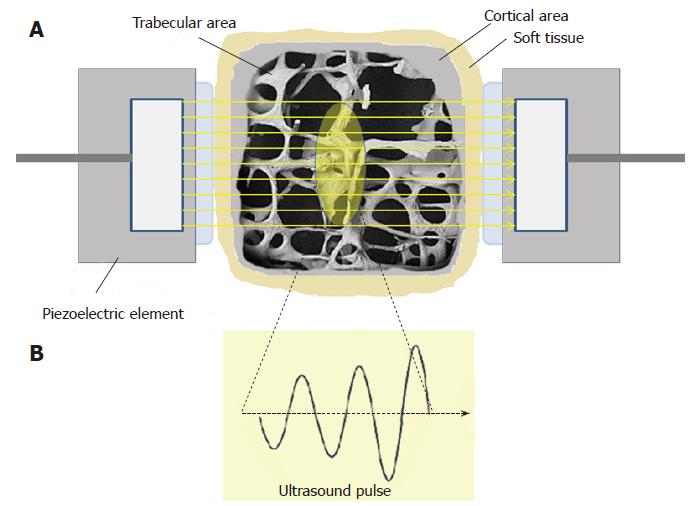
Figure 3 Quantitative ultrasound method.
A: Ultrasound beam through a bone tissue of phalanx (transmission way) in a typical quantitative ultrasound measurement (section view); B: Ultrasound pulse.
Figure 4 A new ultrasound-based methodology.
A: Ultrasound (US) scan of lumbar spine; B: Physical principles of the ultrasound technique based on the reflection of US waves; C: Selection of the target bone interface and automatic detection of the region of interest for diagnostic evaluations and medical report provided with BMD, T-score and Z-score values. BMD: Bone mineral density.
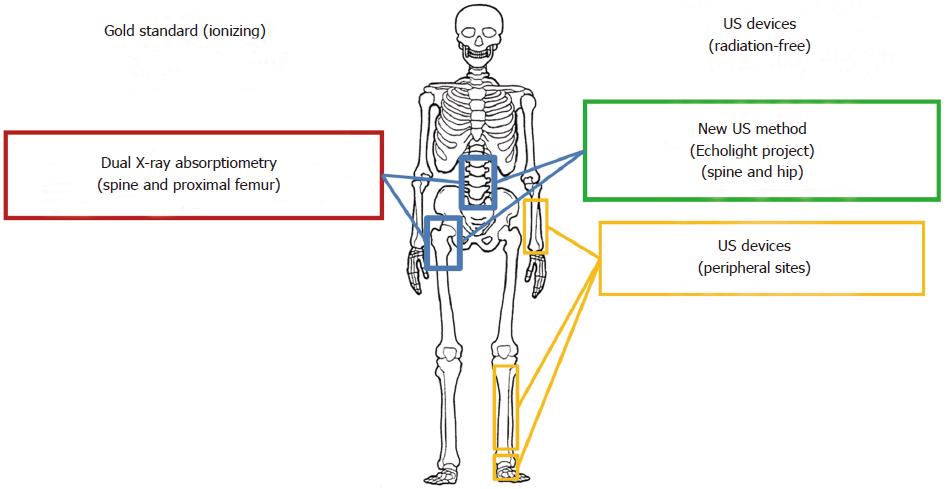
Figure 5 Available systems for osteoporosis diagnosis on main anatomical reference sites.
US: Ultrasound.
- Citation: Pisani P, Renna MD, Conversano F, Casciaro E, Muratore M, Quarta E, Paola MD, Casciaro S. Screening and early diagnosis of osteoporosis through X-ray and ultrasound based techniques. World J Radiol 2013; 5(11): 398-410
- URL: https://www.wjgnet.com/1949-8470/full/v5/i11/398.htm
- DOI: https://dx.doi.org/10.4329/wjr.v5.i11.398


