Copyright
©The Author(s) 2024.
World J Radiol. Jun 28, 2024; 16(6): 139-167
Published online Jun 28, 2024. doi: 10.4329/wjr.v16.i6.139
Published online Jun 28, 2024. doi: 10.4329/wjr.v16.i6.139
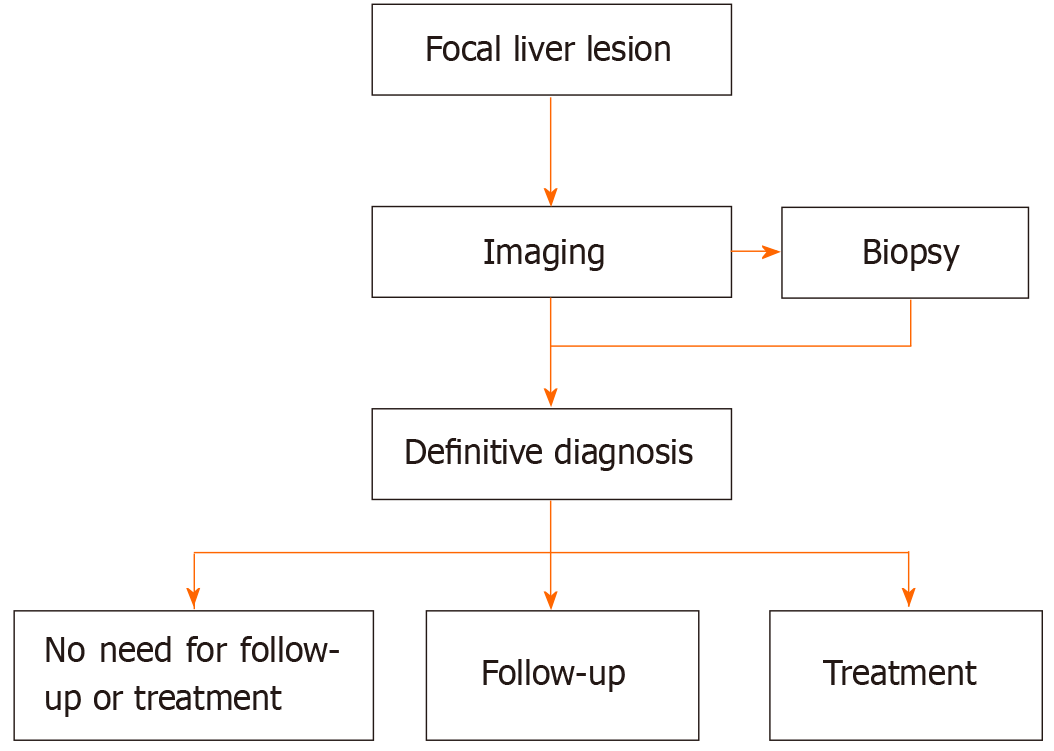
Figure 1
Approach to focal liver lesions which cannot be characterized by the initial imaging.
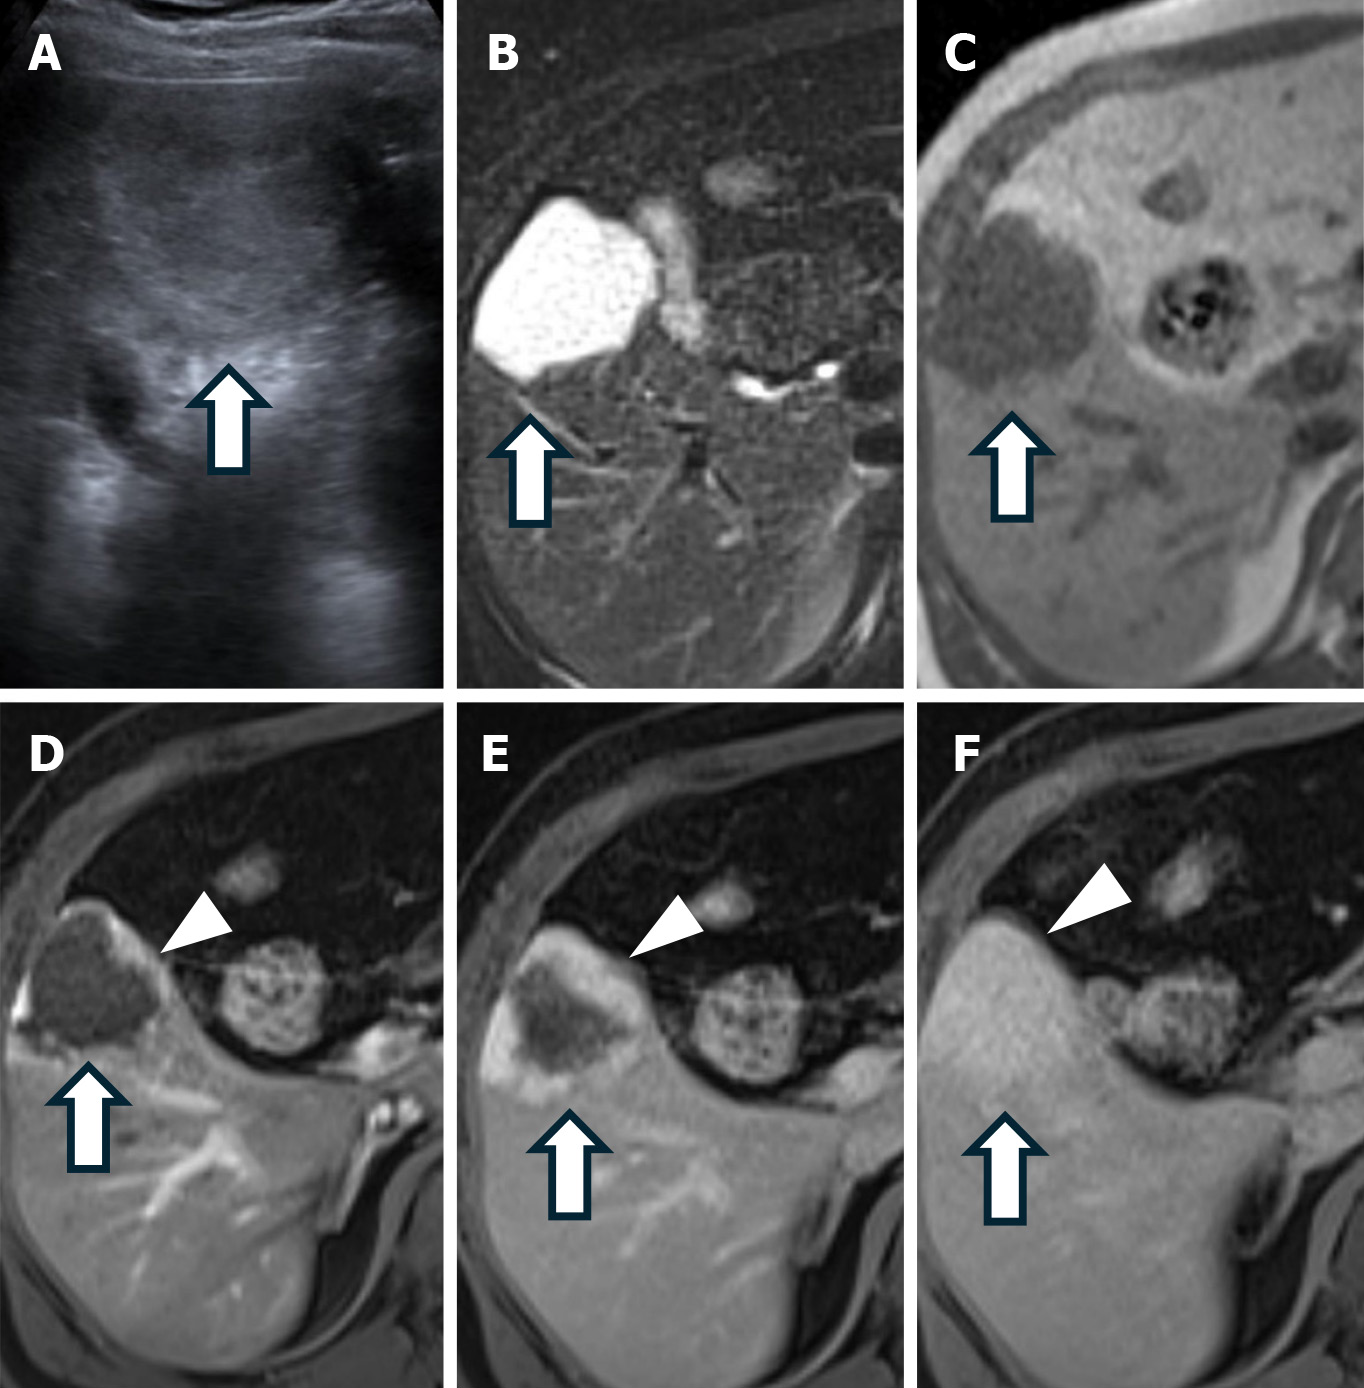
Figure 2 Hemangioma.
A: Ultrasound shows a well-defined hyperechoic lesion (arrow); B: Axial T2-weighted magnetic resonance imaging (MRI) shows a markedly hyperintense lesion (arrow); C: Axial T1-weighted MRI shows a hypointense lesion (arrow); D: Arterial phase T1-weighted MRI with an extracellular gadolinium-based contrast agent demonstrates peripheral, nodular, and discontinuous enhancement (arrowhead); E: Portal venous phase T1-weighted MRI shows continued progressive enhancement (arrowhead); F: Delayed phase T1-weighted MRI emphasizes these enhancement characteristics even further (arrowhead).
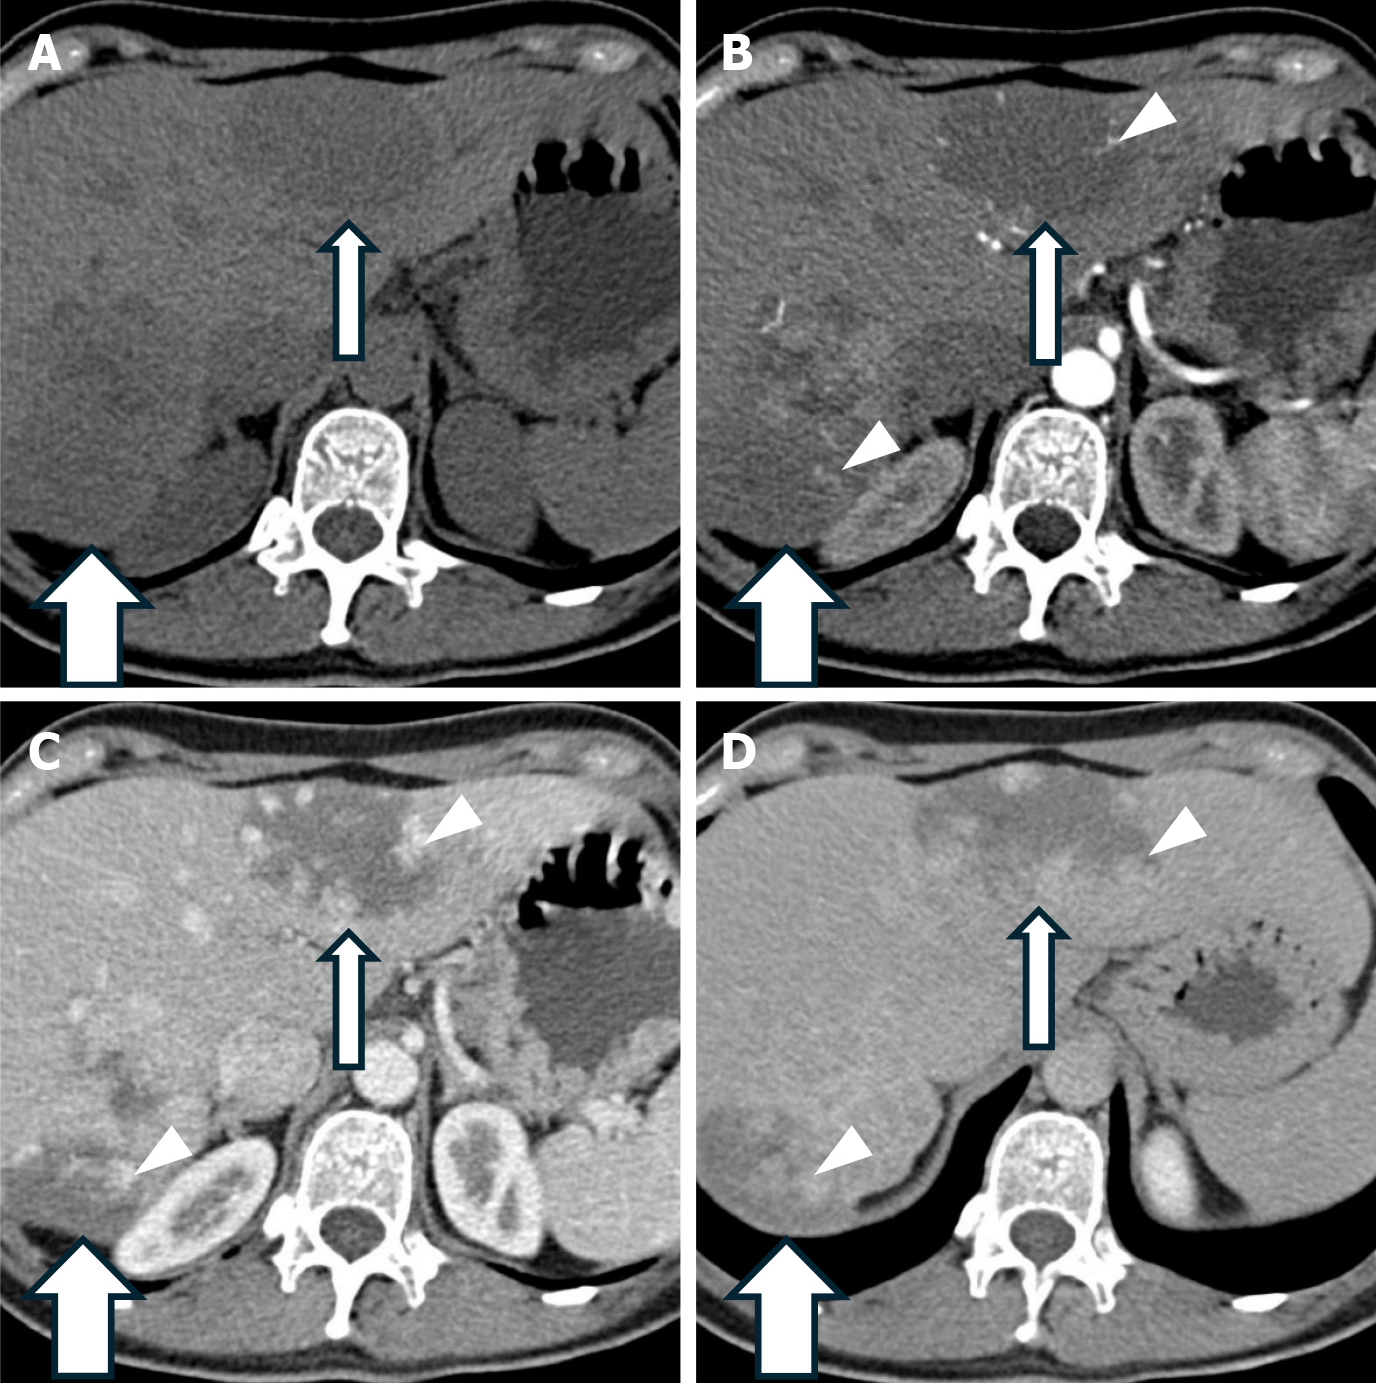
Figure 3 Hemangioma.
A: Axial non-contrast computed tomography (CT) image shows lesions in the right lobe (thick arrow) and left lobe (thin arrow) of the liver; B: Arterial phase contrast-enhanced CT image demonstrates peripheral, nodular, and discontinuous enhancement of the lesions (arrowhead); C: Portal venous phase contrast-enhanced CT image shows progressive enhancement patterns (arrowhead); D: Delayed phase contrast-enhanced CT image further highlights the enhancement characteristics (arrowhead).
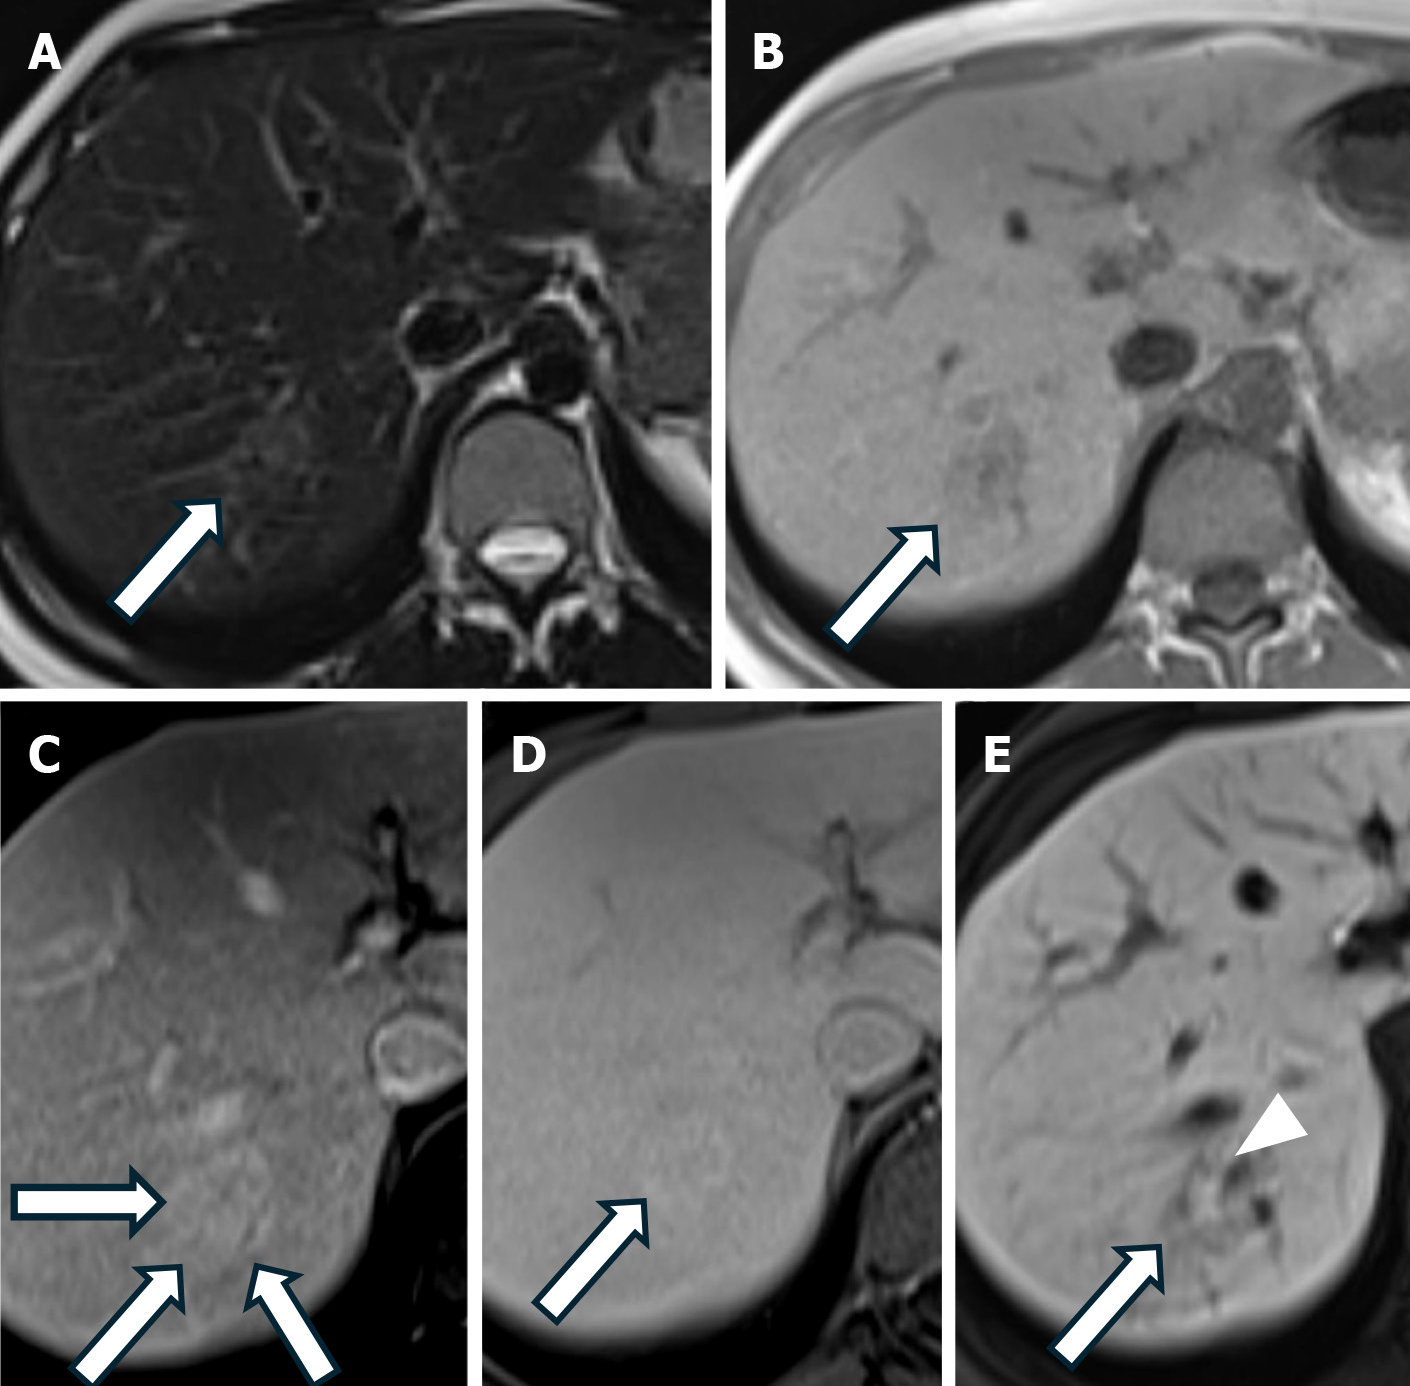
Figure 4 Focal nodular hyperplasia.
A: Axial T2-weighted magnetic resonance imaging (MRI)shows a slightly hyperintense lesion (arrow); B: Axial T1-weighted MRI reveals a slightly hypointense lesion (arrow); C: Arterial phase T1-weighted MRI with a hepatobiliary-specific contrast agent shows homogenous enhancement of the lesion (arrows); D: Portal venous phase T1-weighted MRI indicates the lesion is isointense (arrow); E: Hepatobiliary phase T1-weighted MRI shows persistent peripheral enhancement of the lesion (arrow) with a hypointense central scar (arrowhead).
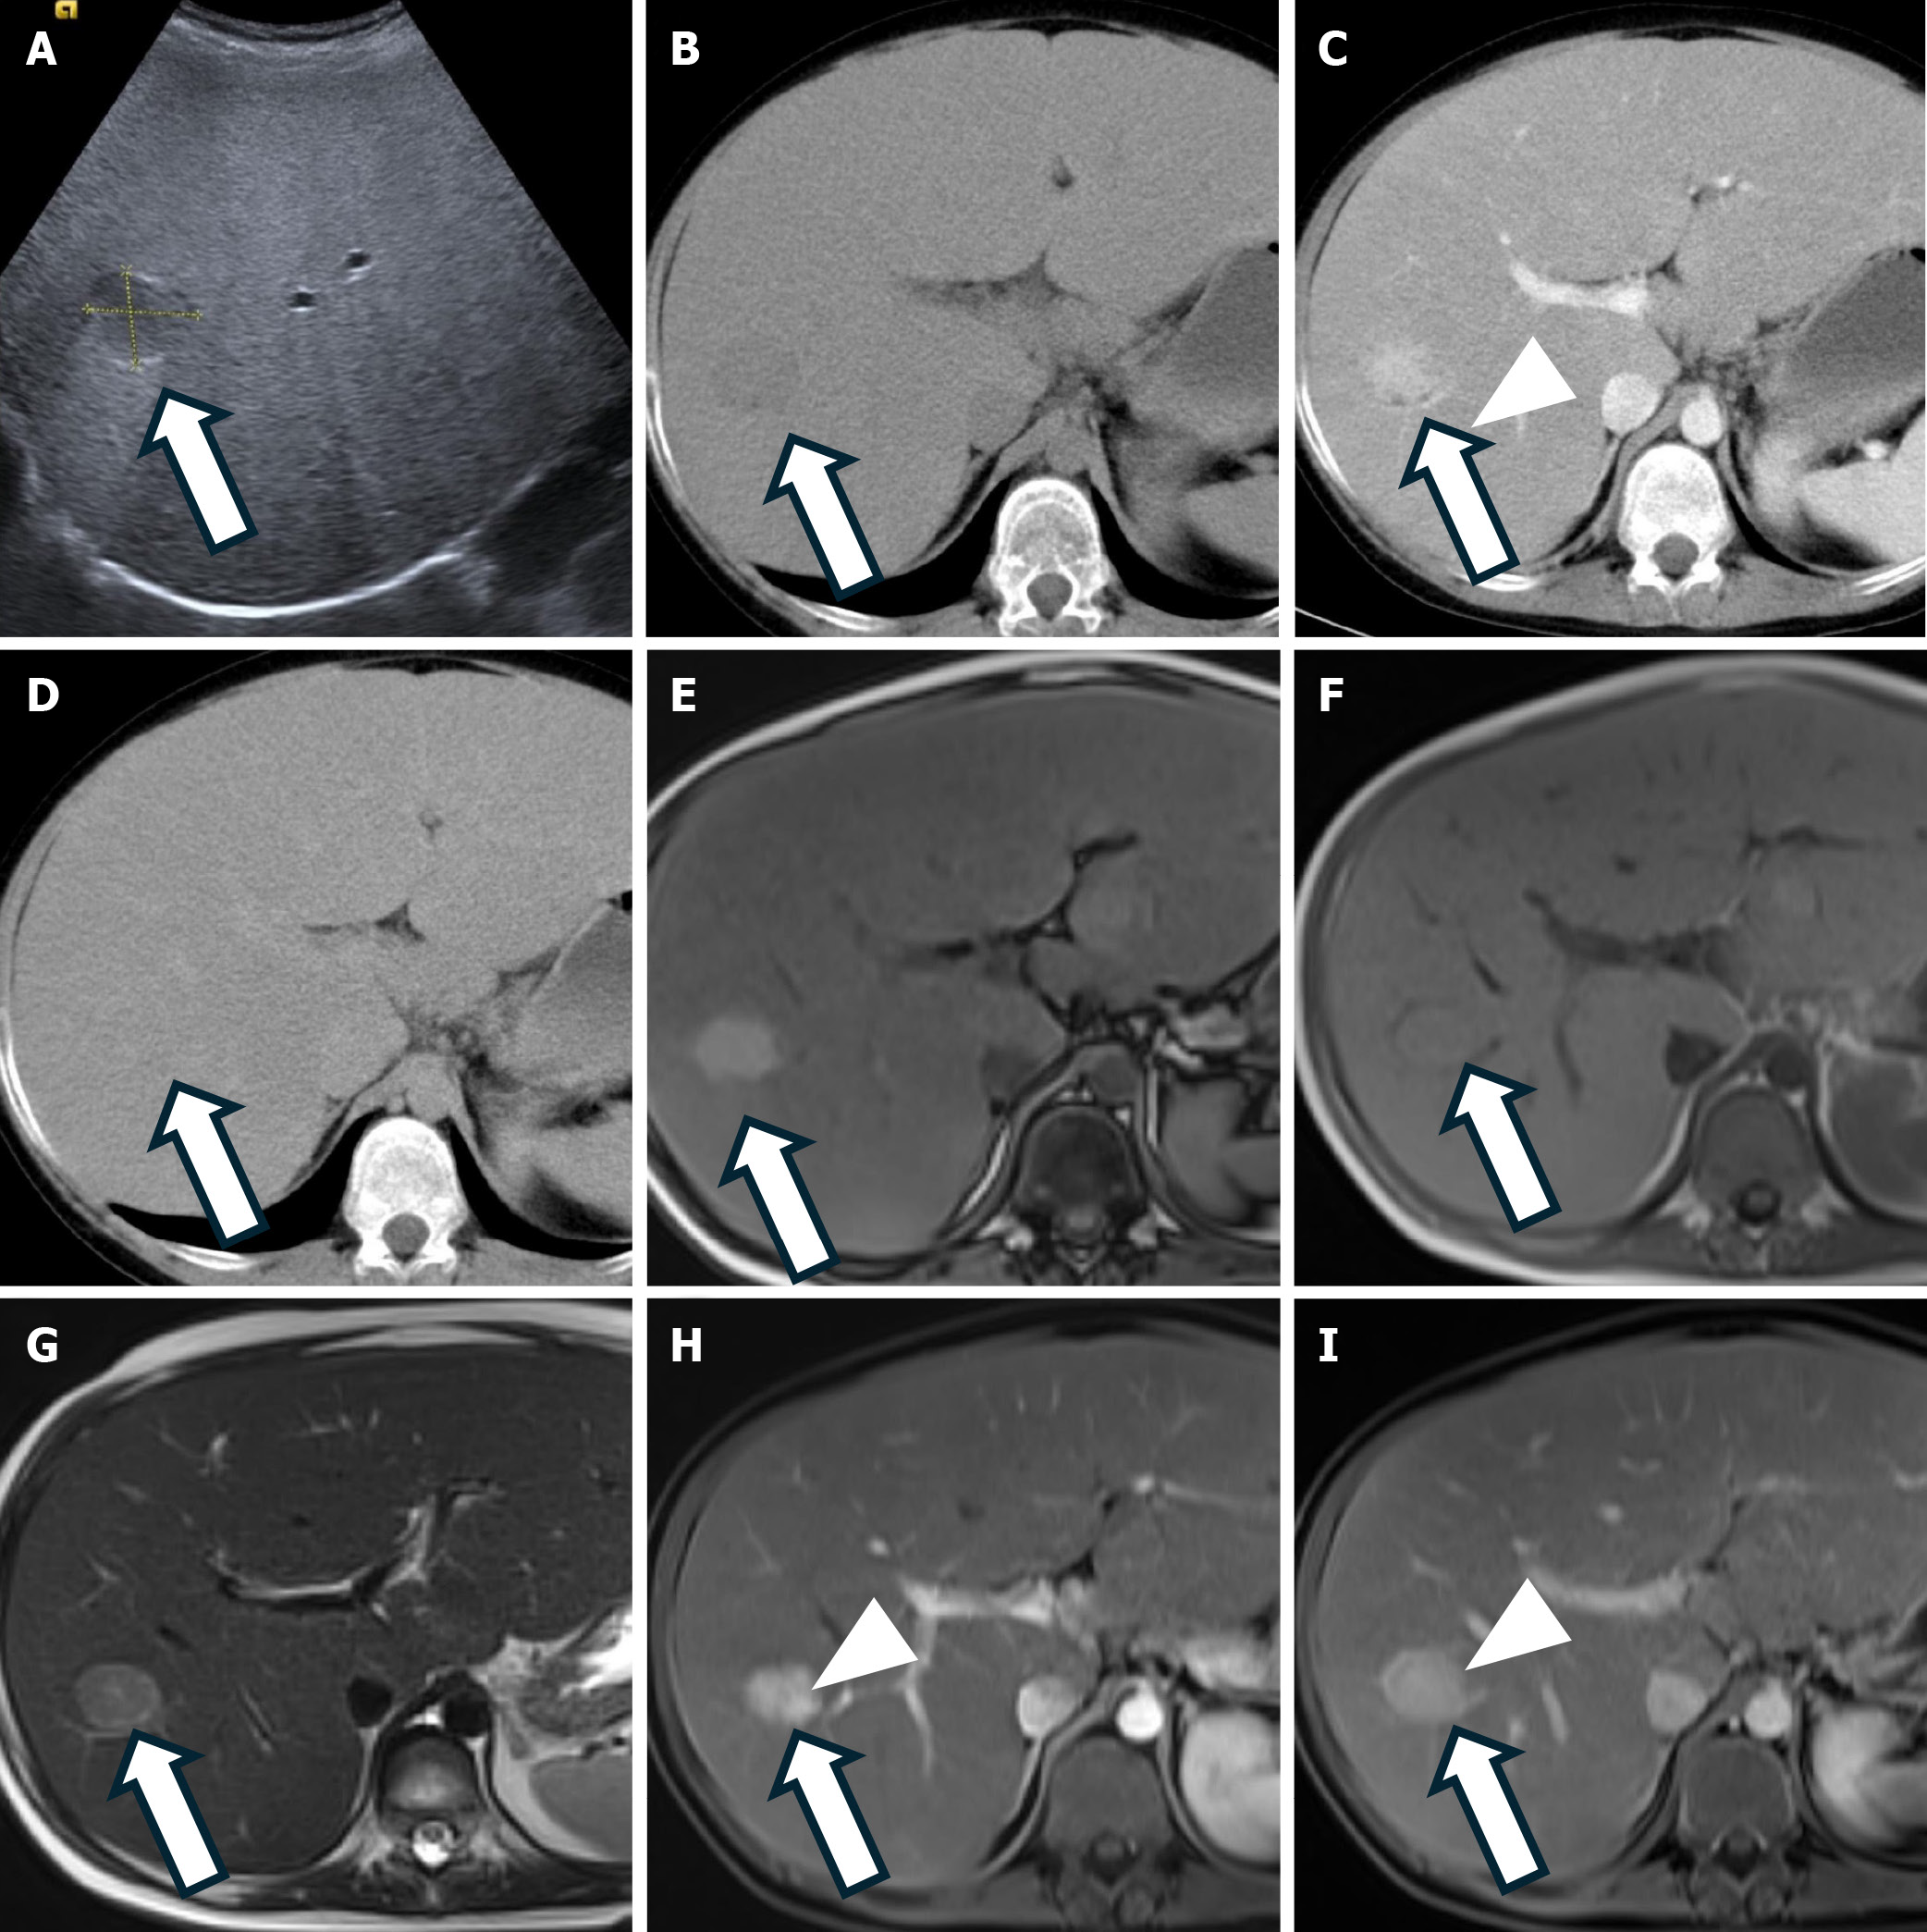
Figure 5 Hepatocellular adenoma, inflammatory subtype.
A: Ultrasound shows a hypoechoic well-defined lesion (arrow) in the right lobe of the liver; B: Axial non-contrast computed tomography (CT) image demonstrates a hypodense lesion (arrow); C: Arterial phase CT shows the lesion with homogenous enhancement (arrowhead); D: In the portal venous phase, the lesion appears isodense to the surrounding liver parenchyma (arrow); E and F: Axial T1-weighted images in opposed phase (E) and in-phase (F) show the lesion (arrow) with no signal drop on the opposed-phase image; G: Axial T2-weighted magnetic resonance imaging (MRI) shows a hyperintense lesion (arrow). H: Arterial phase T1-weighted MRI with an extracellular gadolinium-based contrast agent demonstrates heterogeneous enhancement (arrowhead); I: Portal venous phase T1-weighted MRI continues to show heterogeneous enhancement of the lesion (arrowhead) with no washout.
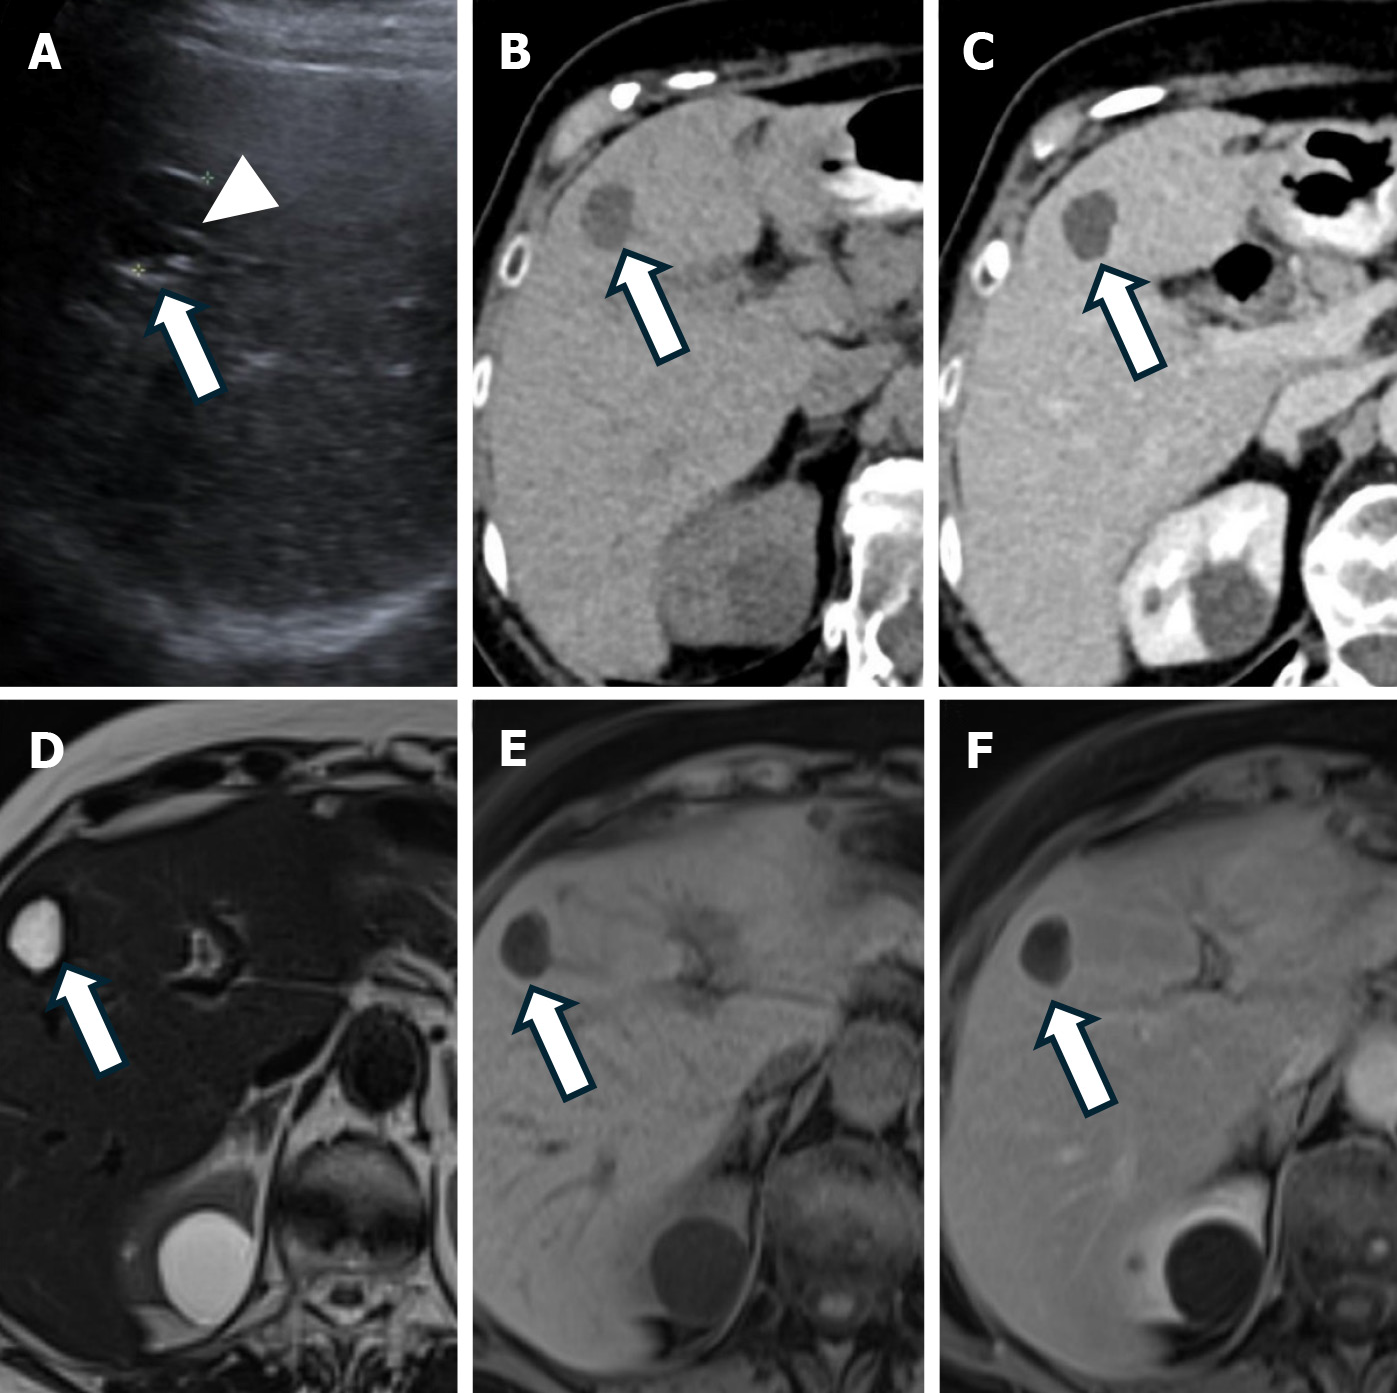
Figure 6 Hepatic cyst.
A: Ultrasound shows an anechoic well-defined lesion (arrow) with a single thin septation (arrowhead); B: Axial non-contrast computed tomography (CT) image demonstrates a hypodense lesion (arrow); C: Axial contrast-enhanced CT image in the portal venous phase shows a hypodense lesion (arrow) with no enhancement; D: Axial T2-weighted magnetic resonance imaging (MRI) shows a markedly hyperintense lesion (arrow); E: Axial T1-weighted MRI shows a hypointense lesion (arrow); F: Axial T1-weighted MRI with an extracellular gadolinium-based contrast agent in the portal venous phase shows the lesion (arrow) with no enhancement.
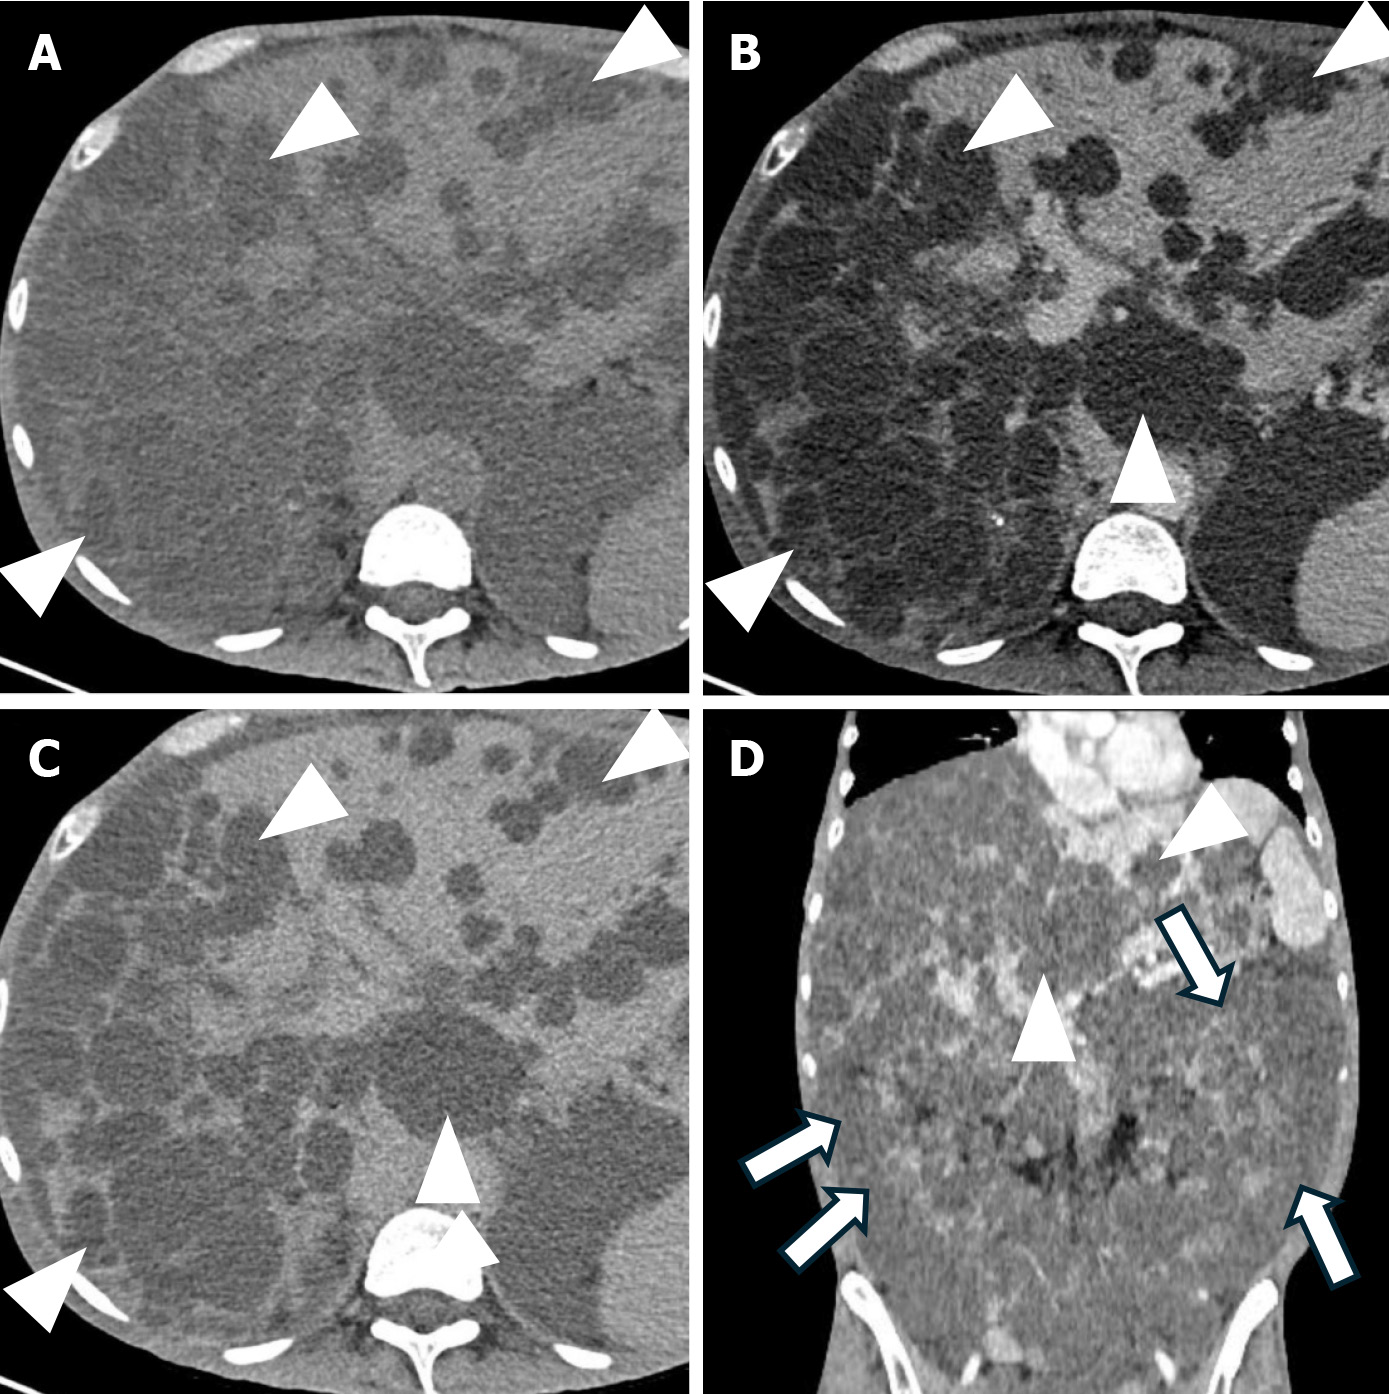
Figure 7 Polycystic liver disease.
A: Axial non-contrast computed tomography (CT) image demonstrates multiple hypodense lesions (arrowheads); B: Axial contrast-enhanced CT image in the portal venous phase shows multiple hypodense lesions with no enhancement (arrowheads); C: Axial contrast-enhanced CT image in the delayed phase demonstrates multiple hypodense lesions with no enhancement (arrowheads); D: Coronal contrast-enhanced CT image in the portal venous phase shows multiple hepatic (arrowheads) and renal (arrows) cysts.
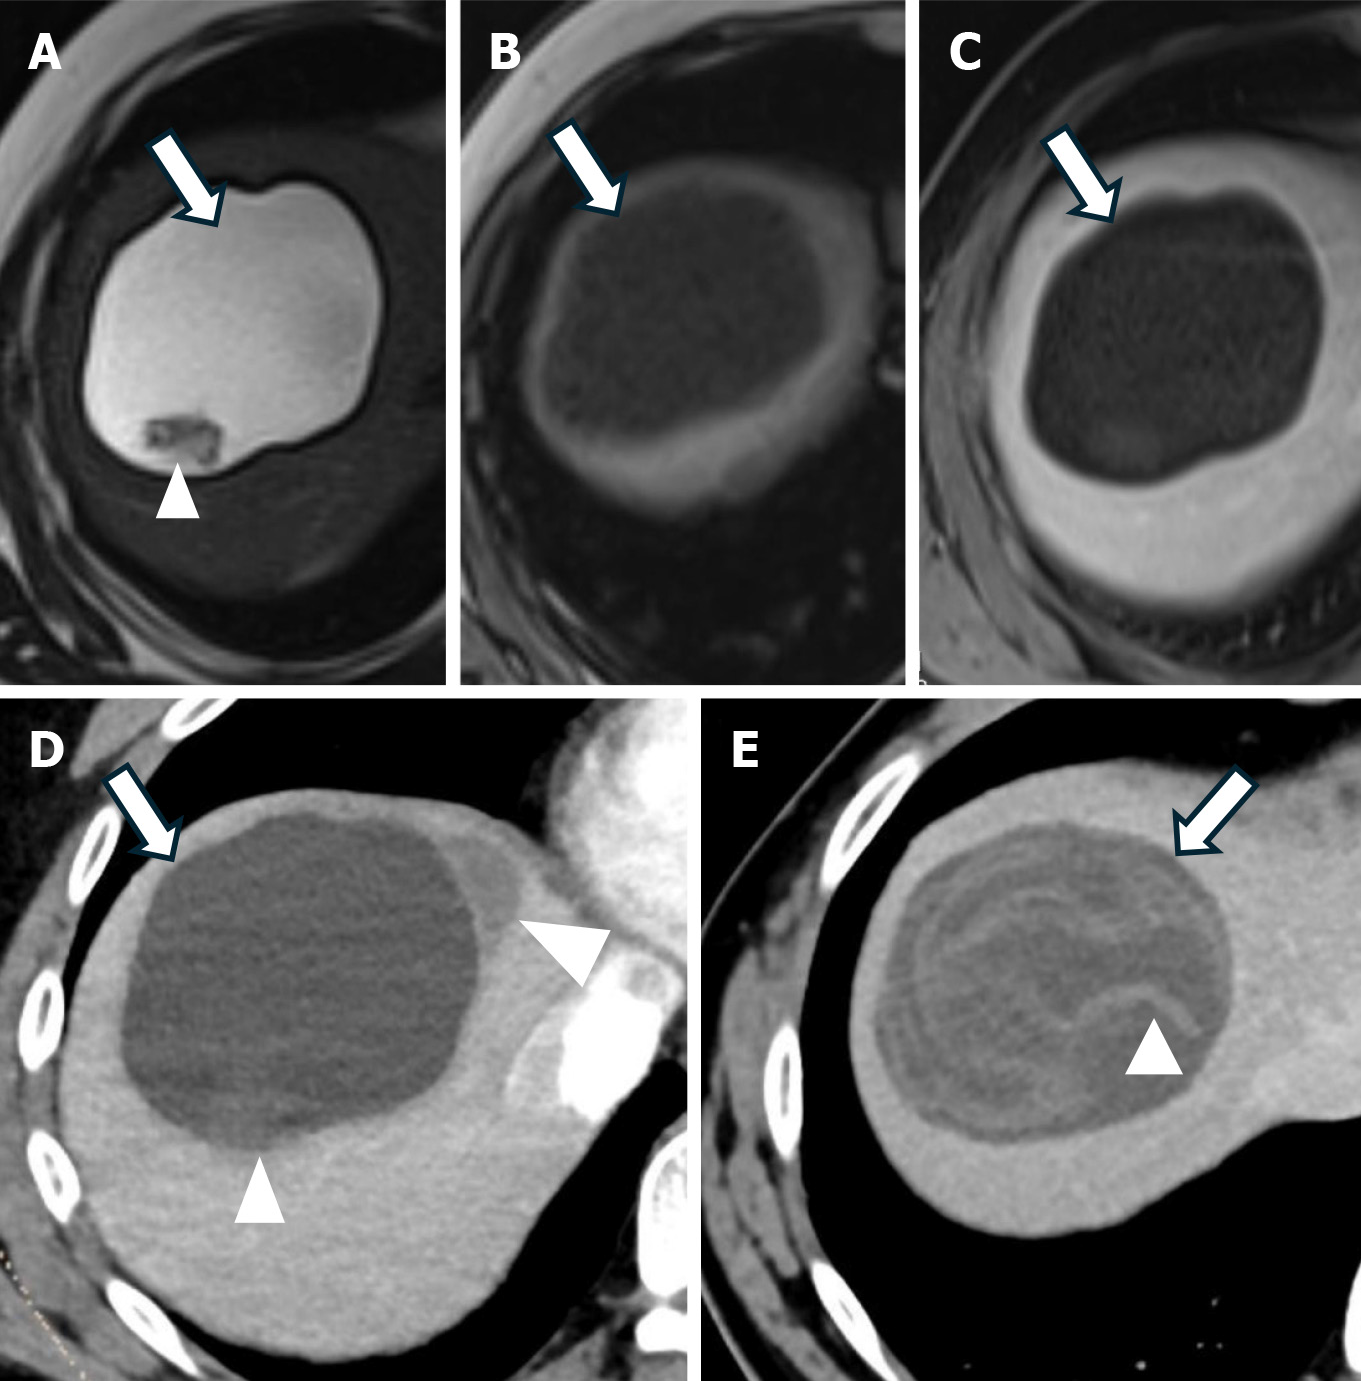
Figure 8 World Health Organization CE2 and CE3a type hydatid cysts.
A 35-year-old man with nonspecific right upper quadrant pain. A: Axial T2 weighted magnetic resonance imaging (MRI) shows a T2 hyperintense hydatid cyst [World Health Organization (WHO) type CE2] with a solitary main cyst (arrow) and small daughter cysts (arrowhead) posteriorly; B: Axial T1 weighted MRI shows a T1 hypointense hydatid cyst with a solitary main cyst (arrow); C: Axial T1 weighted MRI with an extracellular gadolinium-based contrast agent in the portal venous phase shows a hydatid cyst that demonstrates no enhancement; D: Axial contrast-enhanced computed tomography (CT) image shows a hydatid cyst with the main cyst (arrow) and daughter cysts (arrowheads); E: Axial contrast-enhanced CT image of the same patient after one year shows a hydatid cyst (arrow) (WHO type CE3a) with detached membranes (arrowhead) floating within the main cyst.
Figure 9 Inactive hydatid cysts.
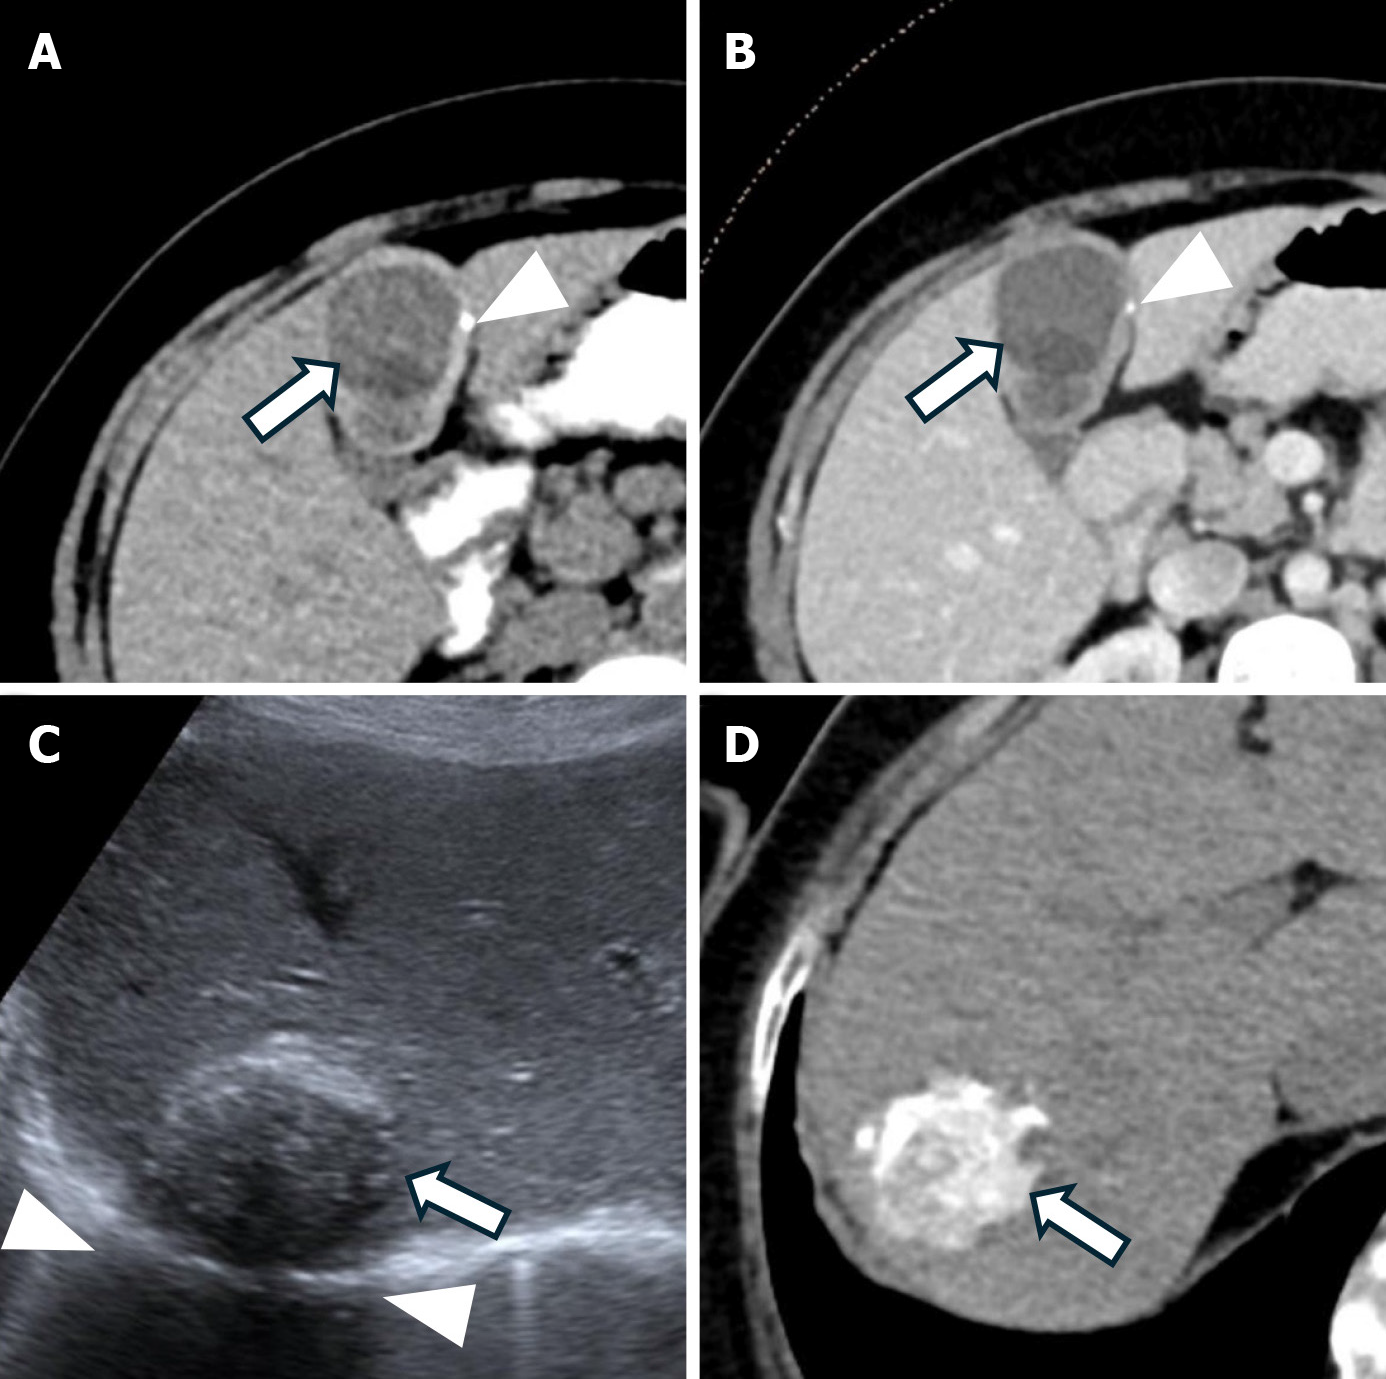
A: Axial non-contrast computed tomography (CT) image shows a heterogeneous hypodense hydatid cyst (arrow) with a partially calcified wall (arrowhead); B: Axial contrast-enhanced CT image shows a heterogeneous hypodense hydatid cyst (arrow) with a partially calcified wall (arrowhead); C: Ultrasound image of another patient demonstrates a heterogeneous calcified hydatid cyst (World Health Organization type CE5, arrow) with acoustic shadowing (arrowheads); D: Axial non-contrast CT image shows a calcified hydatid cyst (arrow).
Figure 10 Mucinous cystic neoplasm of the liver.
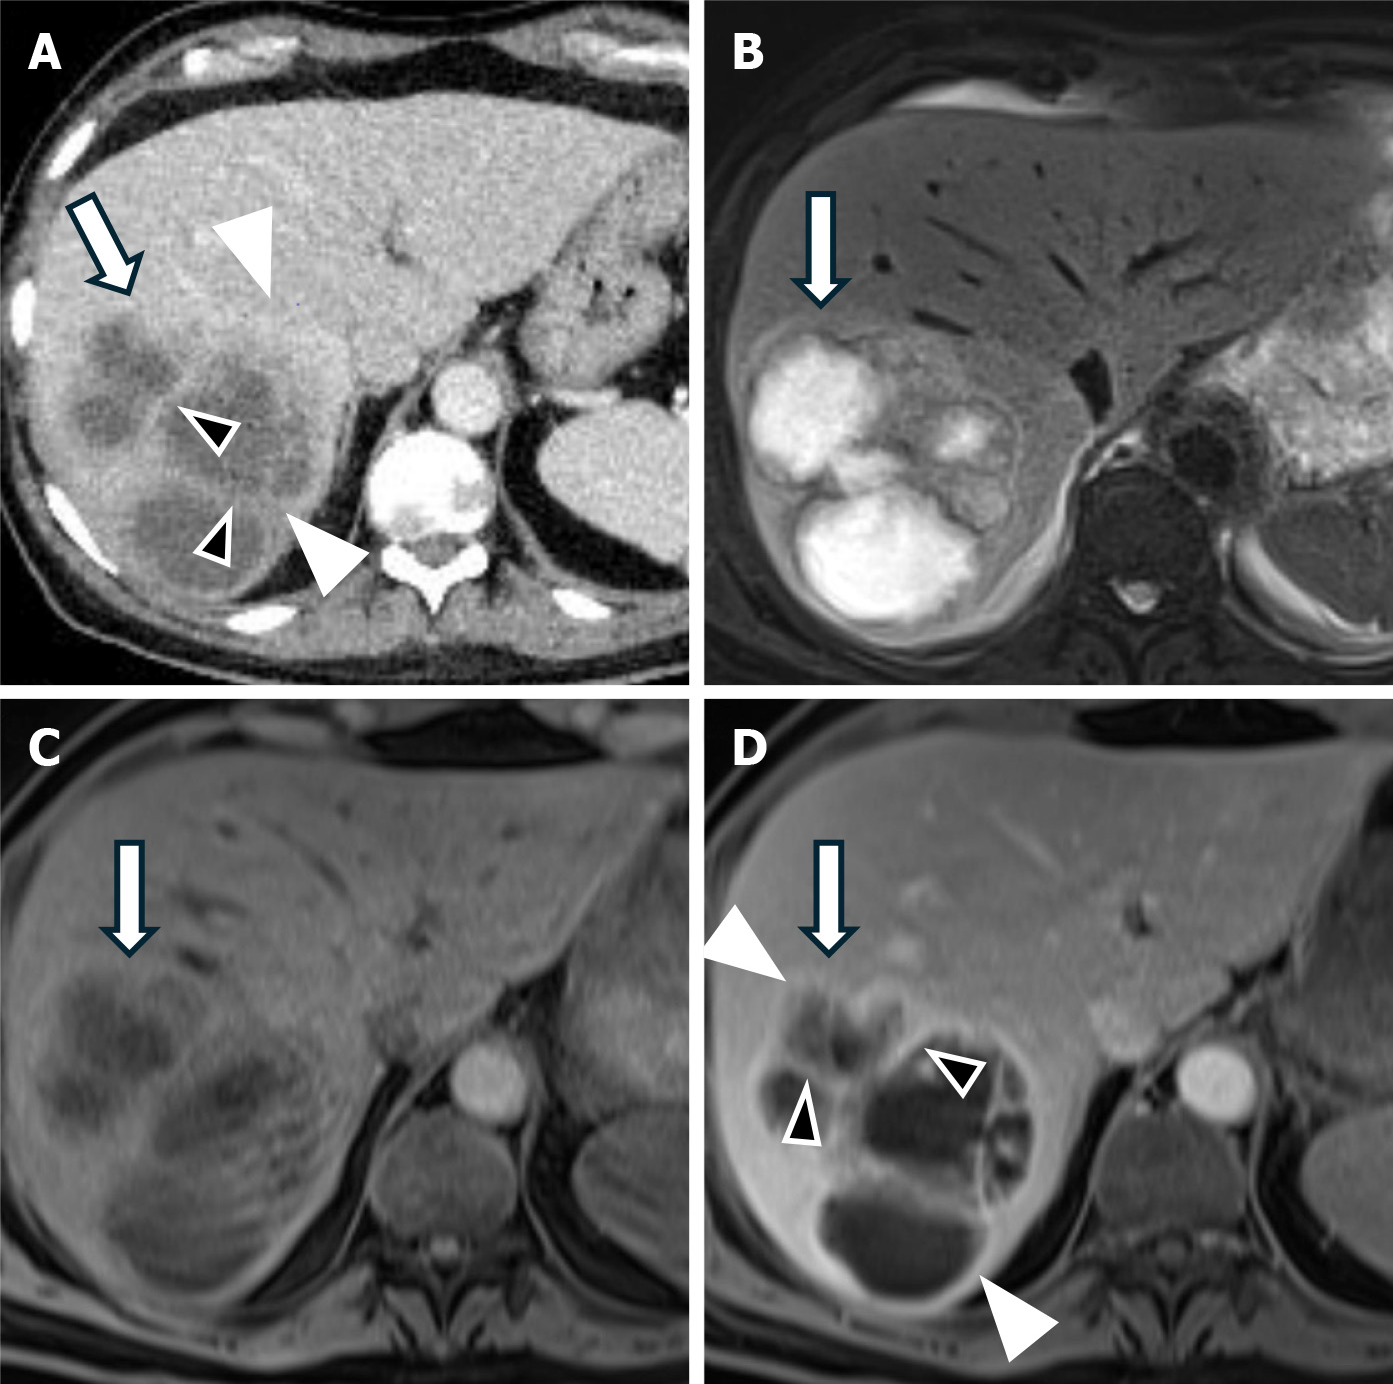
A: Axial contrast-enhanced computed tomography image shows a lobulated lesion (arrow) with an enhancing wall (white arrowheads) and septations (black arrowheads) in the right lobe of the liver; B: Axial T2 weighted MR image shows a T2 hyperintense lobulated lesion (arrow) with an thick wall and septations; C: Axial T1 weighted MR image shows a T1 hypointense lobulated lesion; D: Axial T1 weighted MR image with an extracellular gadolinium-based contrast agent in the portal venous phase shows a T1 hypointense lobulated lesion (arrow) with an enhancing thick wall (white arrowheads) and septations (black arrowheads).
Figure 11 Intrahepatic cholangiocarcinoma.
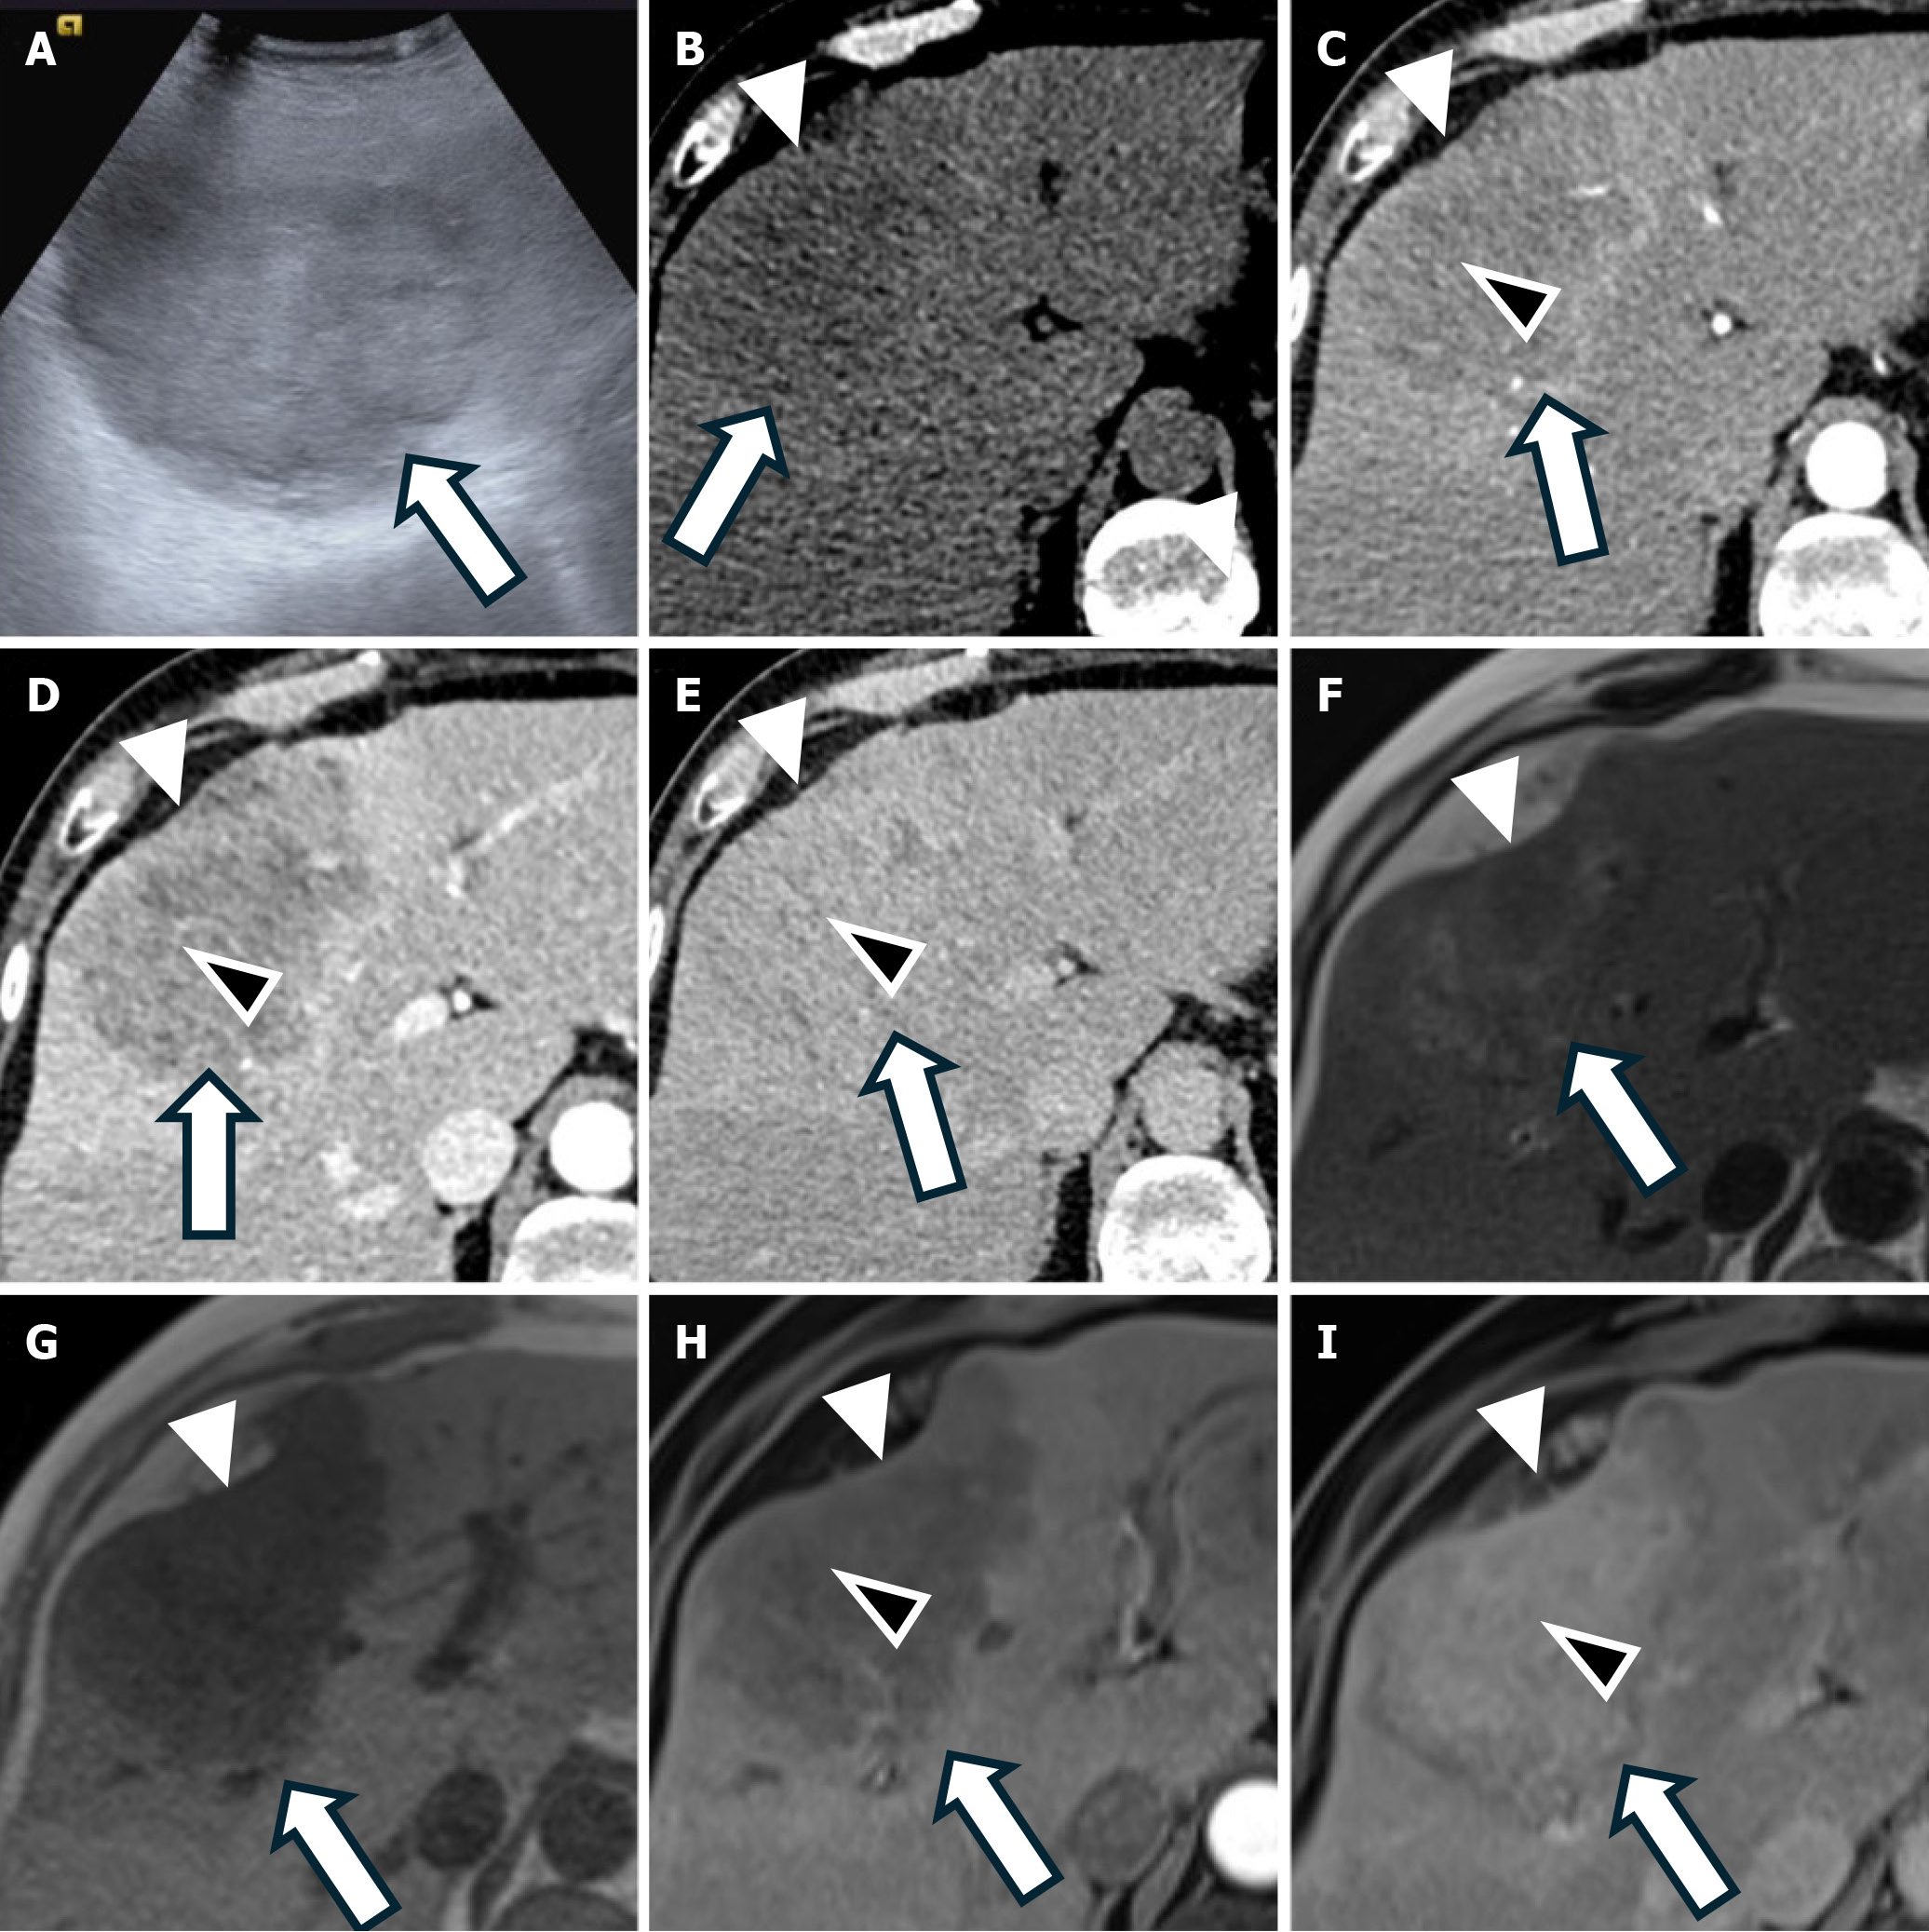
A: Ultrasound shows a heterogeneous slightly hyperechoic lesion (arrow); B: Axial non-contrast computed tomography (CT) image demonstrates an ill-defined hypodense lesion (arrow) that causes capsular retraction (white arrowheads); C: Axial contrast-enhanced CT image in the arterial phase shows peripheral enhancement (targetoid appearance) of the lesion (arrow); D: Axial contrast-enhanced CT image in the portal venous phase shows progressive enhancement (black arrowheads) of the lesion (arrow); E: Axial contrast-enhanced CT image in the delayed phase shows further progressive enhancement (black arrowheads) of the lesion (arrow); F: Axial T2 weighted magnetic resonance imaging (MRI) shows a T2 peripherally hyperintense, centrally hypointense ill-defined, heterogeneous lesion (arrow) with capsular retraction (white arrowheads); G: Axial T1 weighted MRI shows a T1 hypointense ill-defined, heterogeneous lesion (arrow) with capsular retraction (white arrowheads); H: Axial T1 weighted MRI with an extracellular gadolinium-based contrast agent in the portal venous phase shows a T1 hypointense lesion (arrow) with progressive enhancement (black arrowheads); I: Axial T1 weighted MR image in the delayed phase shows a hypointense lesion (arrow) with further progressive enhancement (black arrowheads).
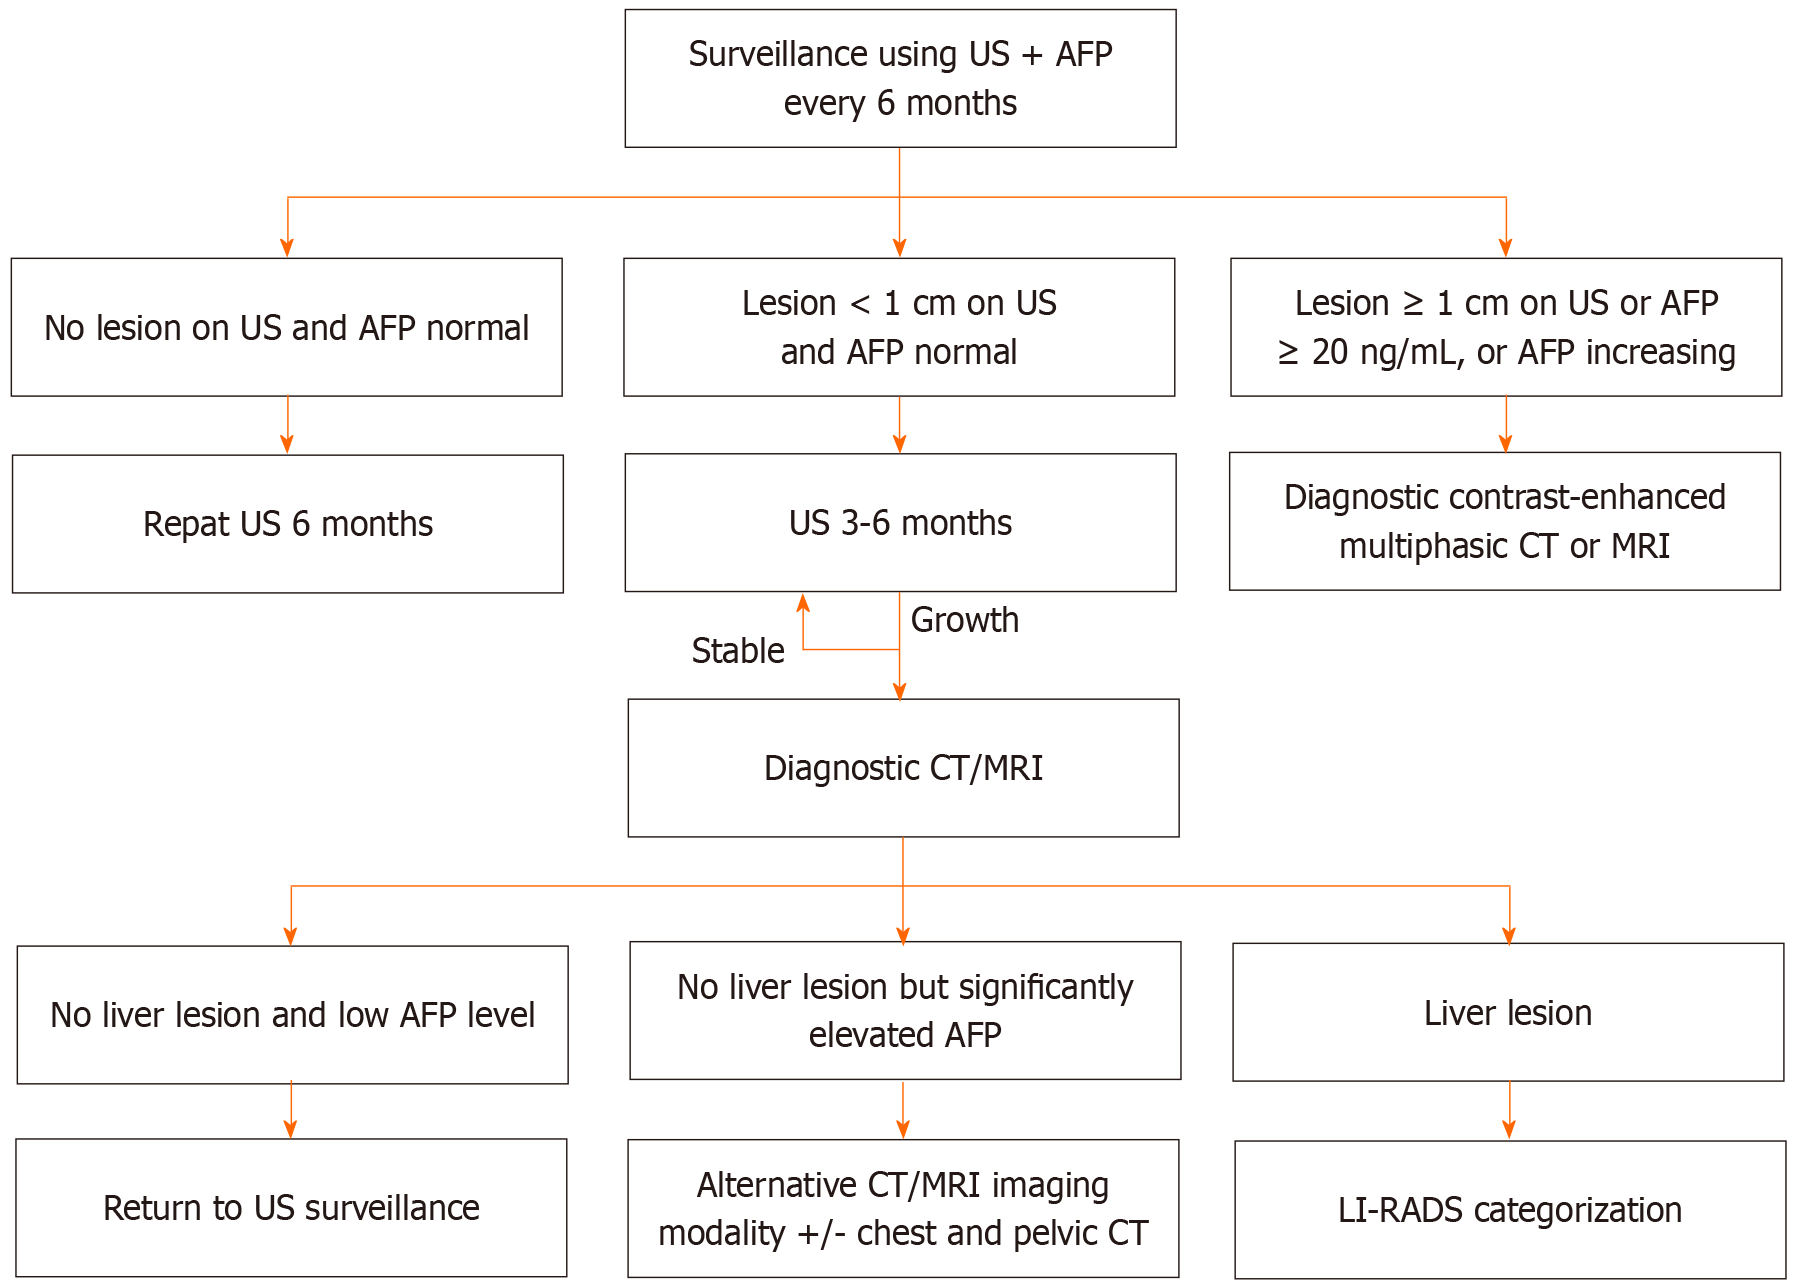
Figure 12 Recall algorithm for hepatocellular carcinoma surveillance recommended by the American Association for the Study of Liver Diseases[12].
AFP: Alpha-fetoprotein; CT: Computed tomography; LI-RADS: Liver Imaging Reporting and Data System; MRI: Magnetic resonance imaging; US: Ultrasound.
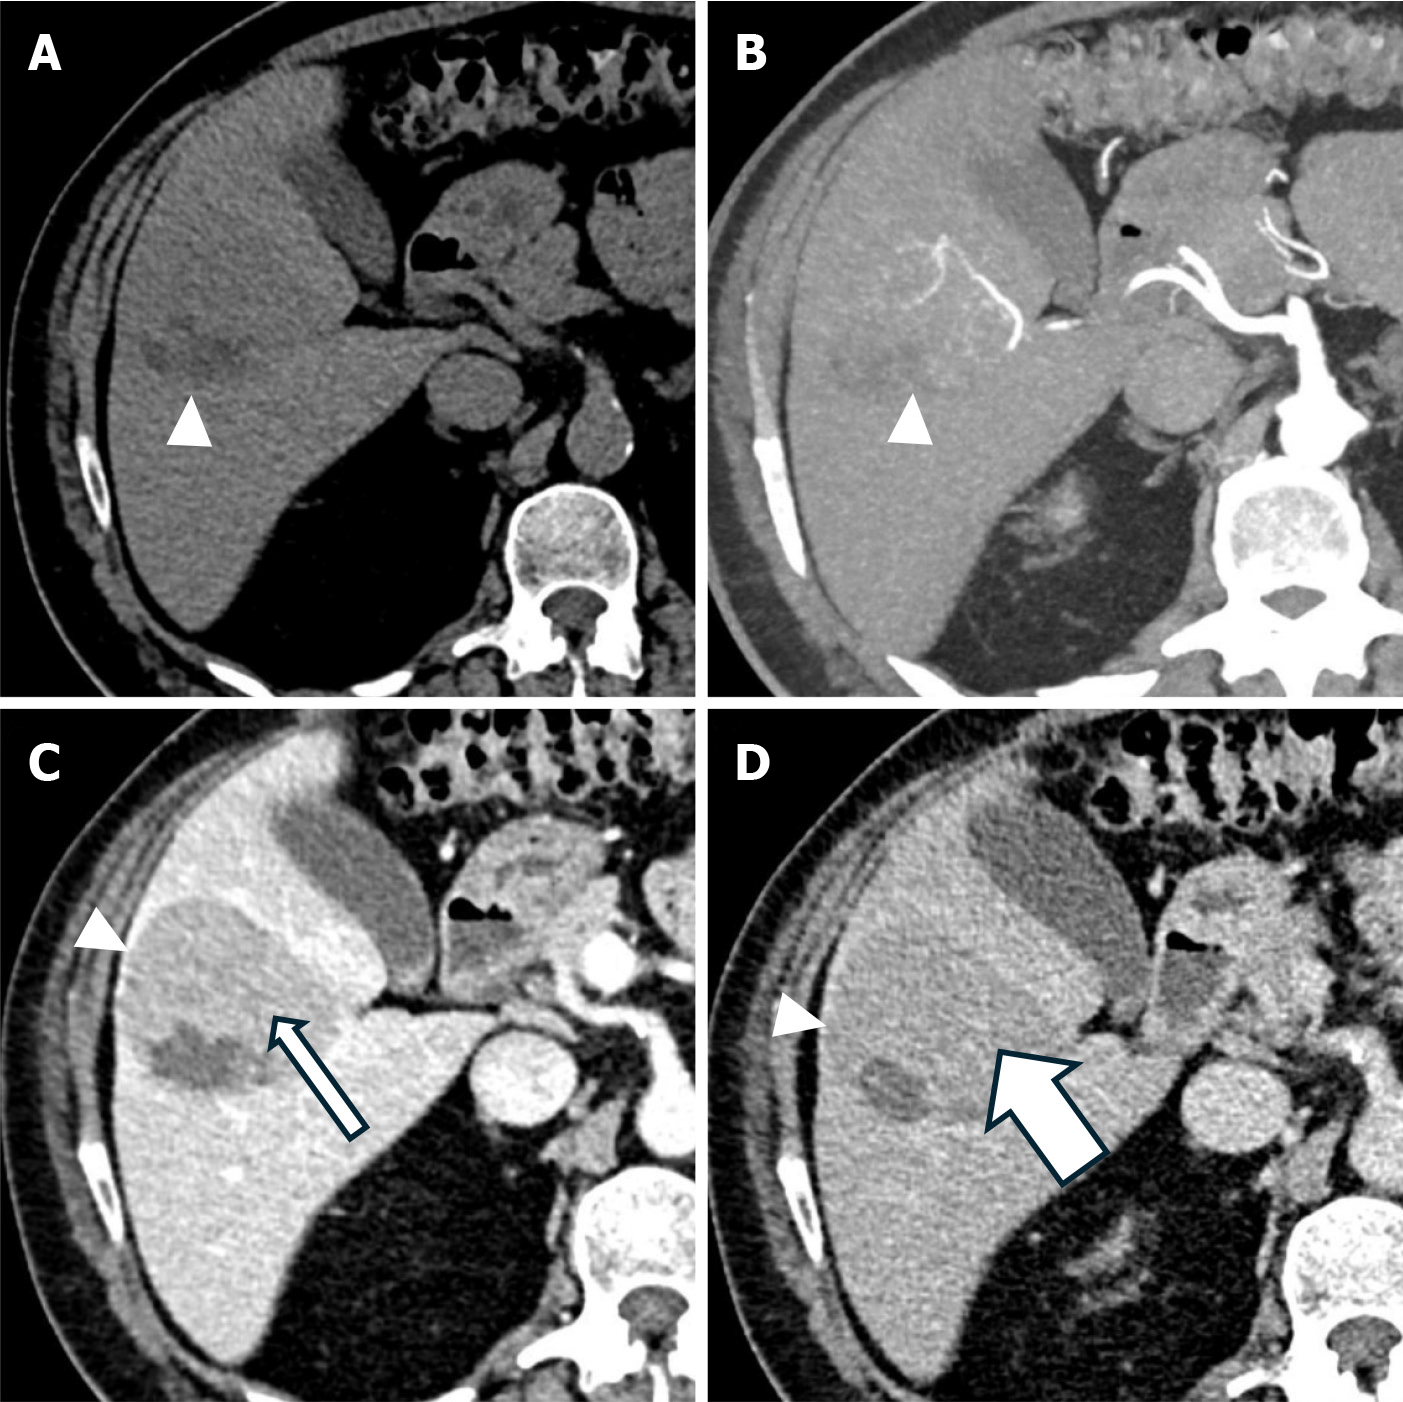
Figure 13 Hepatocellular carcinoma in a 58-year-old man with chronic hepatitis B infection.
A: Axial non-contrast computed tomography (CT) image shows the hypodense lesion(arrowhead); B: Axial contrast-enhanced CT image in the arterial phase shows an enhancing lesion (arrowhead); C: Axial contrast-enhanced CT image in the portal venous phase shows the lesion(arrowhead) with a washout (thin arrow); D: Axial contrast-enhanced CT image in the delayed phase shows the lesion(arrowhead) with further washout (thick arrow).
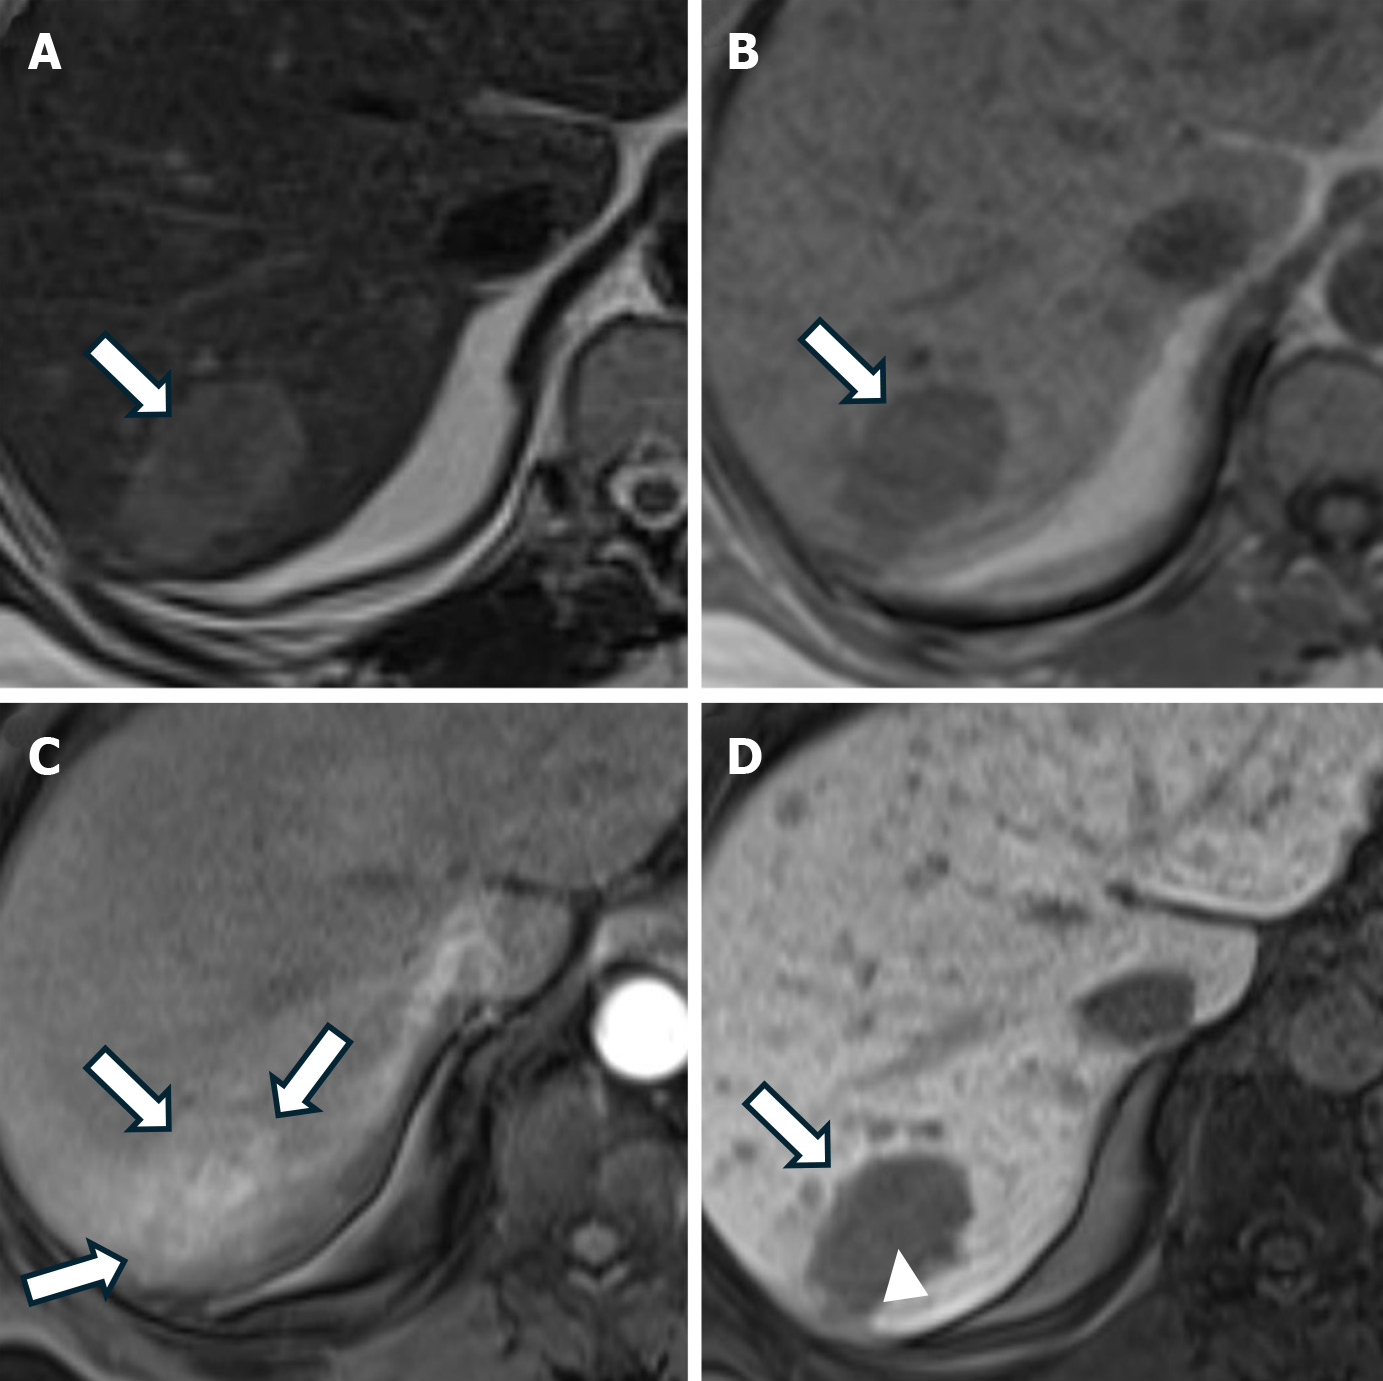
Figure 14 Hepatocellular carcinoma in a 53-year-old man with chronic hepatitis B infection.
A: Axial T2 weighted magnetic resonance imaging (MRI) shows a T2 mildly hyperintense lesion (arrow); B: Axial T1 weighted MRI image shows a T1 hypointense lesion (arrow); C: Axial post-contrast T1 weighted MRI with a hepatobiliary-specific contrast agent in the arterial phase shows an enhancing lesion (arrows); D: Axial post-contrast T1 weighted MRI in the hepatobiliary phase shows a lesion(arrow) with a washout (arrowhead).
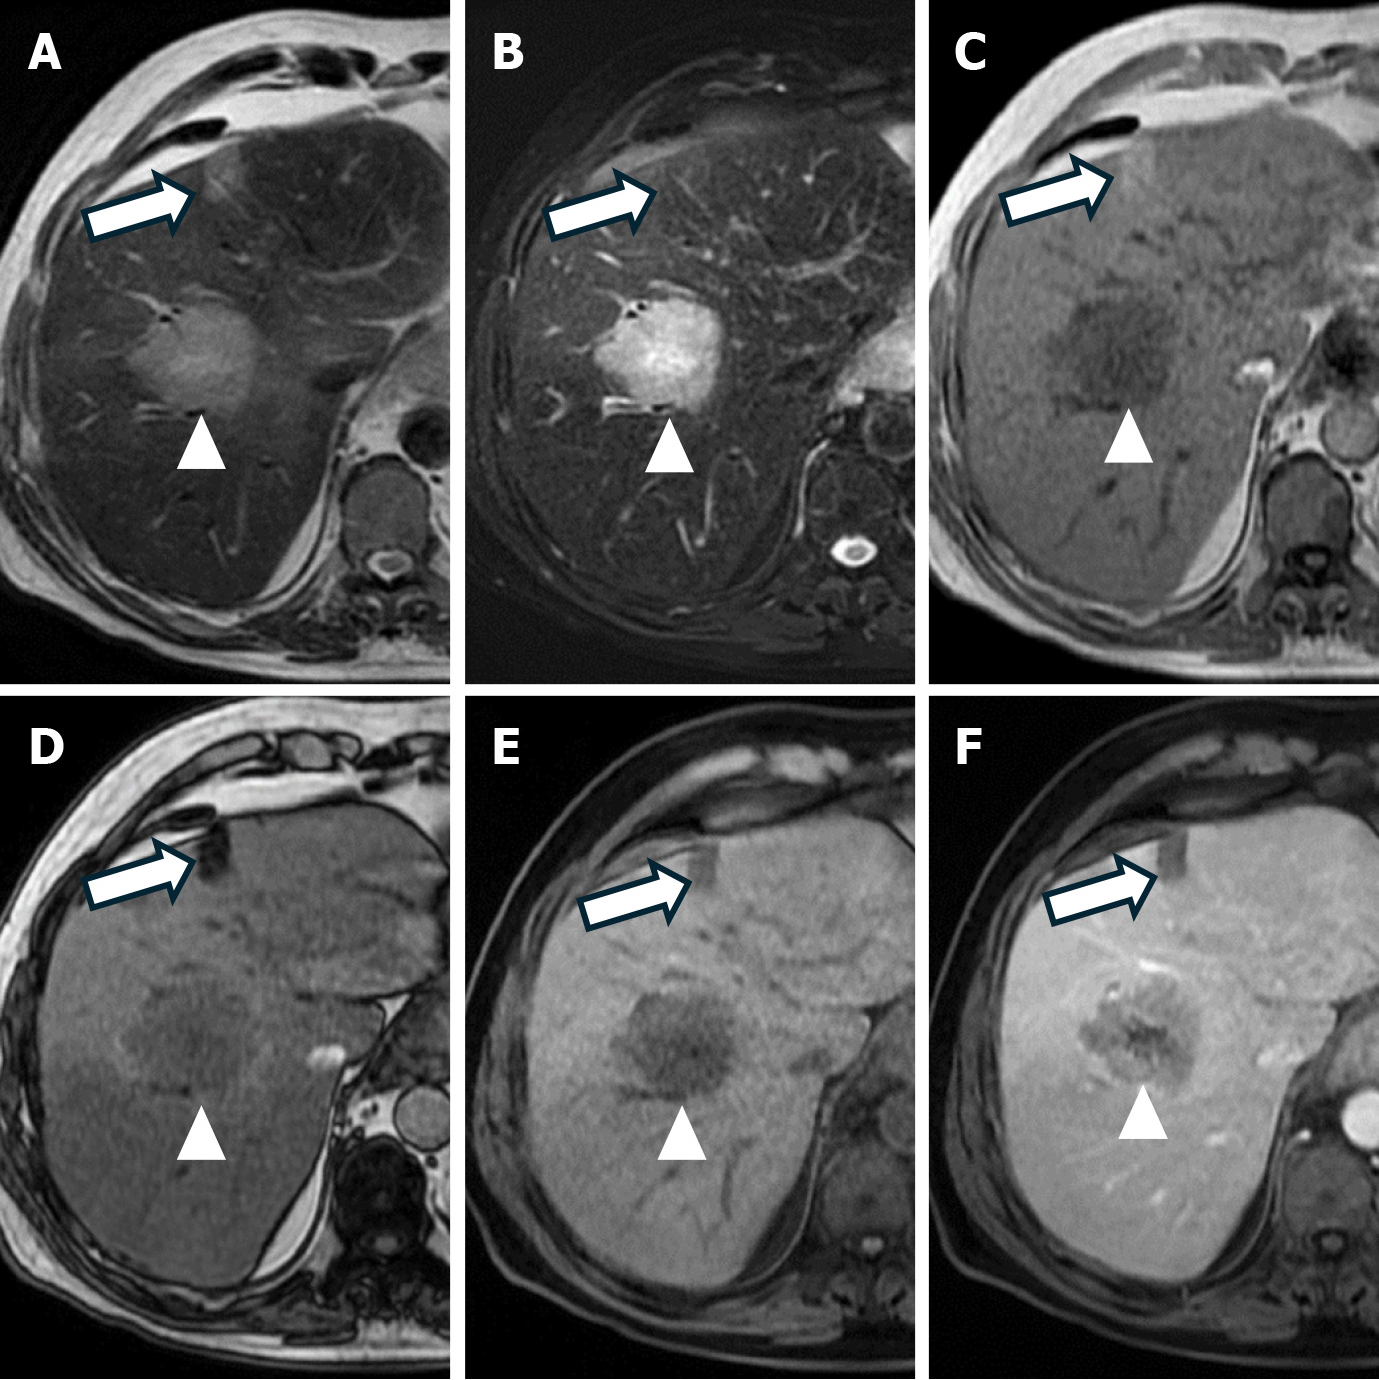
Figure 15 Focal hepatic steatosis.
A: Axial T2 weighted magnetic resonance imaging (MRI) shows hyperintensity(arrow) in segment 4A of the liver adjacent to the falciform ligament and a hyperintense mass lesion (arrowhead); B: Axial fat-suppressed T2 weighted MRI shows the same imaging findings (arrow and arrowhead); C: Axial in-phase T1 weighted MRI shows hyperintensity in the same area (arrow) and a hypointense mass lesion(arrowhead); D: Axial out-of-phase T1 weighted image shows signal suppression compared to in-phase (arrow); E: Axial pre-contrast fat-suppressed T1 weighted image shows hypointense lesions (arrow and arrowhead); F: Axial post-contrast fat-suppressed T1 weighted image shows no contrast enhancement in the lesion(arrow) that is consistent with focal hepatic steatosis. The mass lesion in segment 8 (arrowhead) is consistent with metastasis.
- Citation: Kahraman G, Haberal KM, Dilek ON. Imaging features and management of focal liver lesions. World J Radiol 2024; 16(6): 139-167
- URL: https://www.wjgnet.com/1949-8470/full/v16/i6/139.htm
- DOI: https://dx.doi.org/10.4329/wjr.v16.i6.139


