Copyright
©The Author(s) 2023.
World J Radiol. Nov 28, 2023; 15(11): 315-323
Published online Nov 28, 2023. doi: 10.4329/wjr.v15.i11.315
Published online Nov 28, 2023. doi: 10.4329/wjr.v15.i11.315
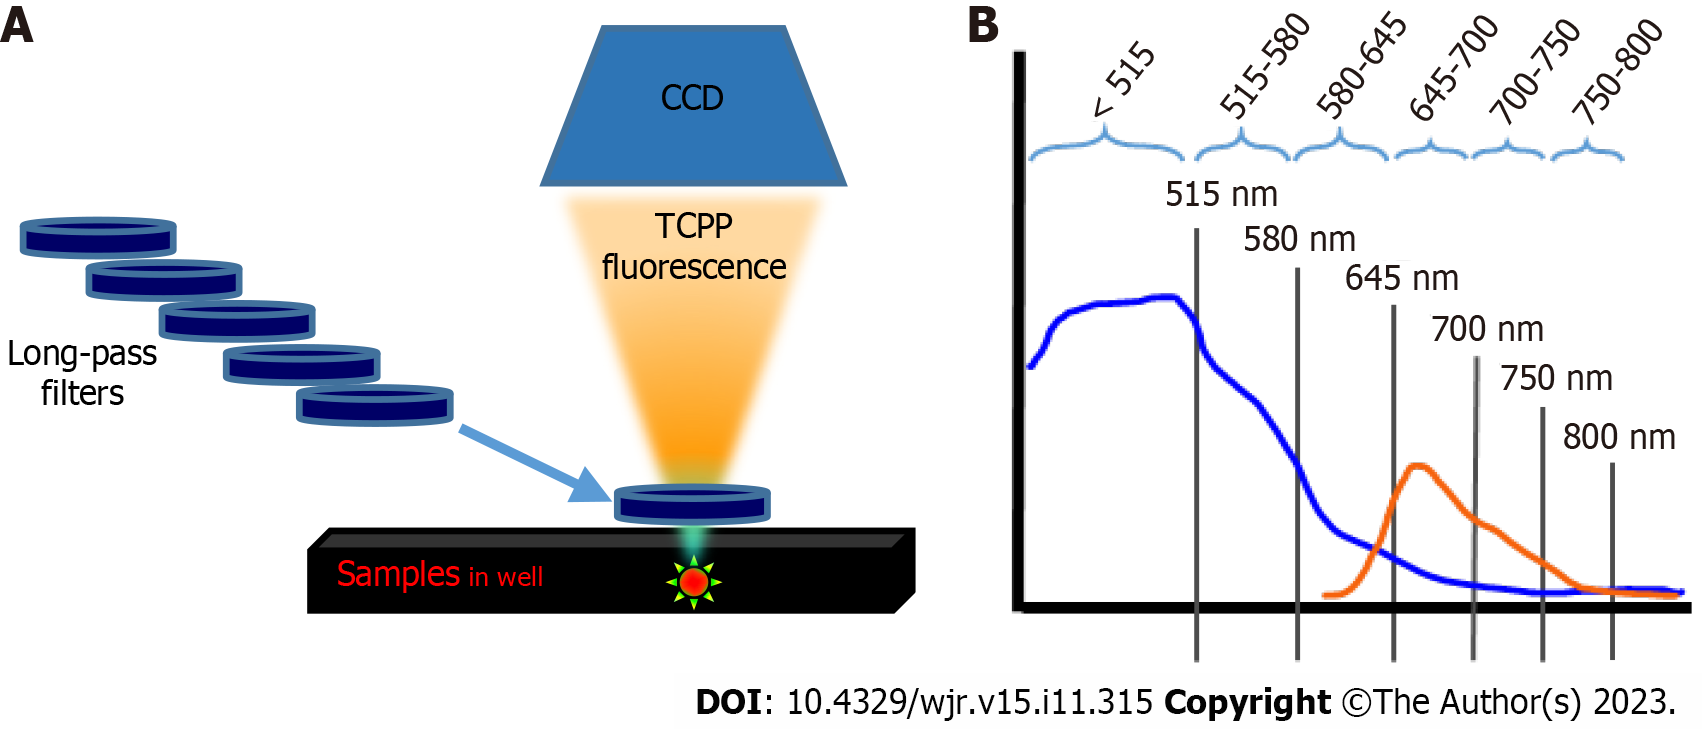
Figure 1 Schematic diagram of the optical imaging approach used to detect Cherenkov optical emission and to separate the fluore
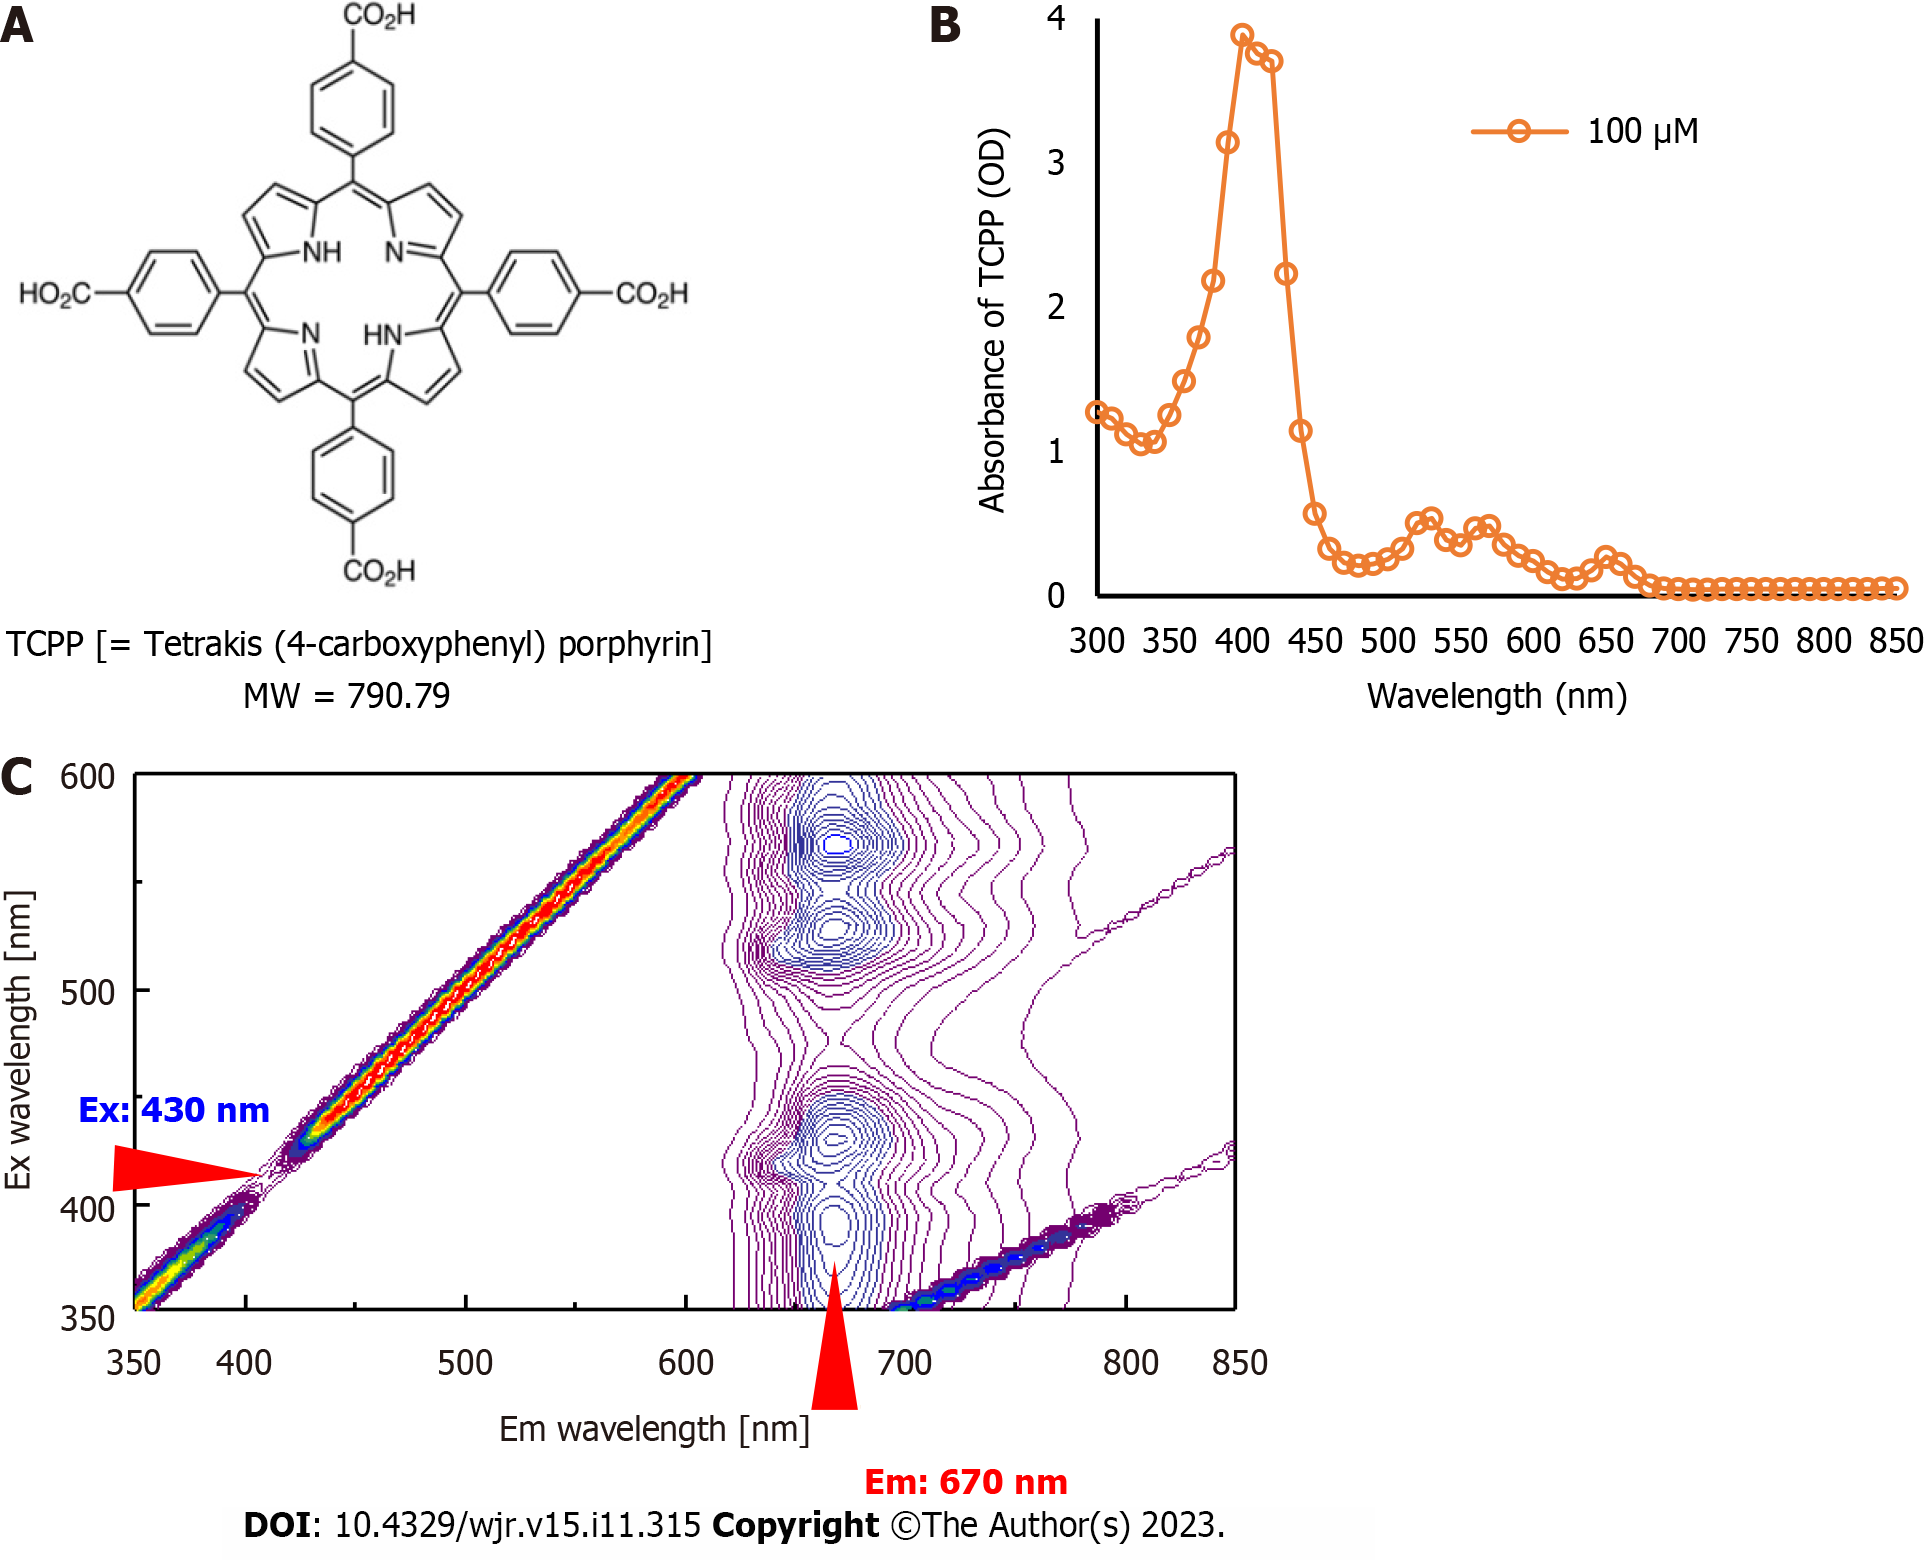
Figure 2 Chemical structure and photo-physical properties of tetrakis (4-carboxyphenyl) porphyrin.
A: Chemical structure of tetrakis (4-carboxyphenyl) porphyrin (TCPP); B: Absorption spectrum of TCPP (100 µmol/L) at 25°C in phosphate buffer; C: Three-dimensional fluorescence spectral analysis of TCPP. Fluorescence emission was observed around 670 nm with an excitation wavelength of 430 nm. Em: Emission wavelength; Ex: Excitation wavelength; MW: Molecular weight; μM: μmol/L.
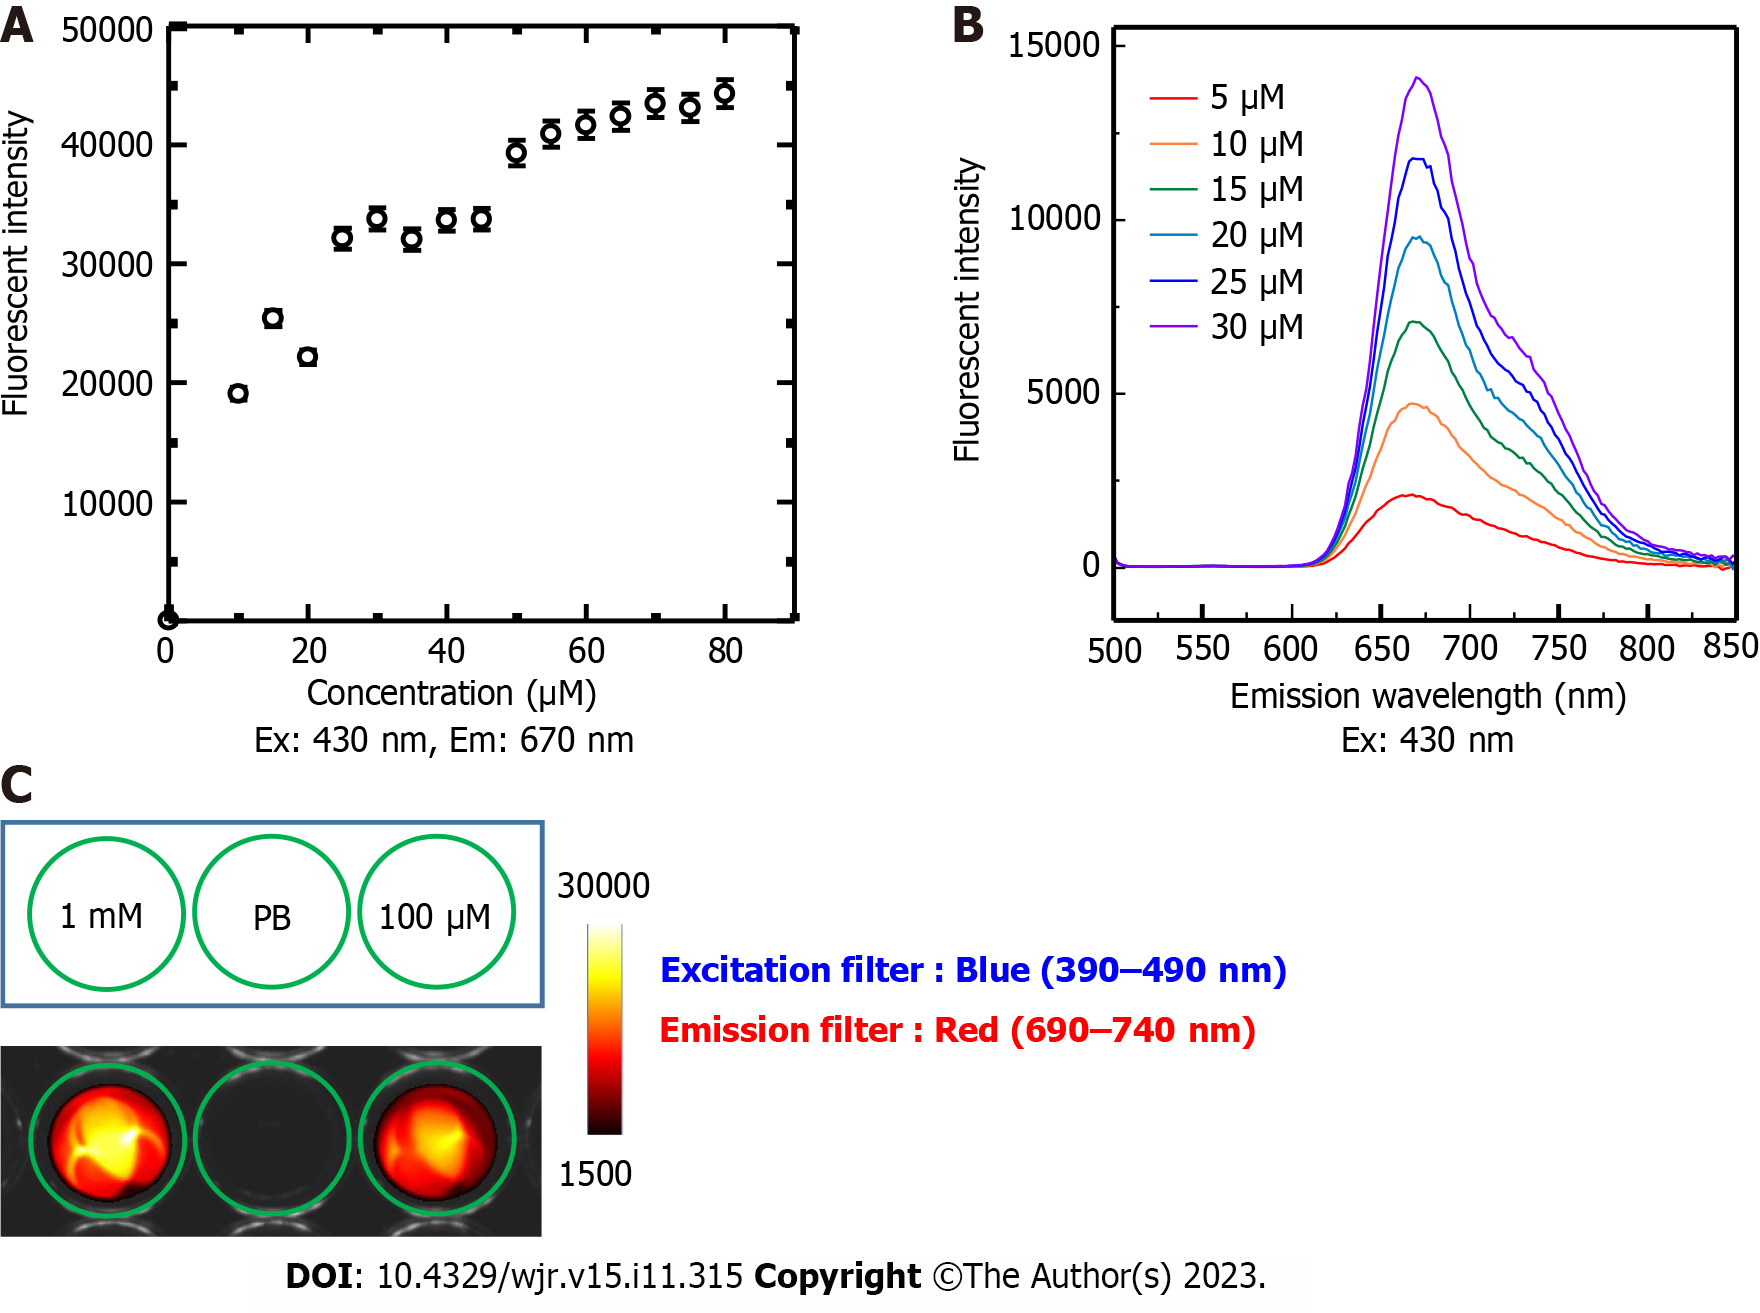
Figure 3 Tetrakis (4-carboxyphenyl) porphyrin fluorescence emission.
A: Fluorescence emission intensity of tetrakis (4-carboxyphenyl) porphyrin (TCPP) prepared at different concentrations (5, 10, 15, 20, 25, 30, 35, 40, 45, 50, 55, 60, 65, 70, 75, and 80 µmol/L in PB) measured by setting the excitation wavelength to 430 nm and emission wavelength to 670 nm. The relationship is linear up to approximately 30 µmol/L; B: The fluorescence spectra of low TCPP concentrations (5, 10, 15, 20, 25, and 30 µmol/L) were measured with the excitation wavelength set to 430 nm; C: Visualization of TCPP fluorescence emission using a light-emitting diode light source, blue light excitation filter (390–490 nm), and red light emission filter (690–740 nm). Em: Emission wavelength; Ex: Excitation wavelength; mM: mmol/L; PB: Phosphate buffer; μM: μmol/L.
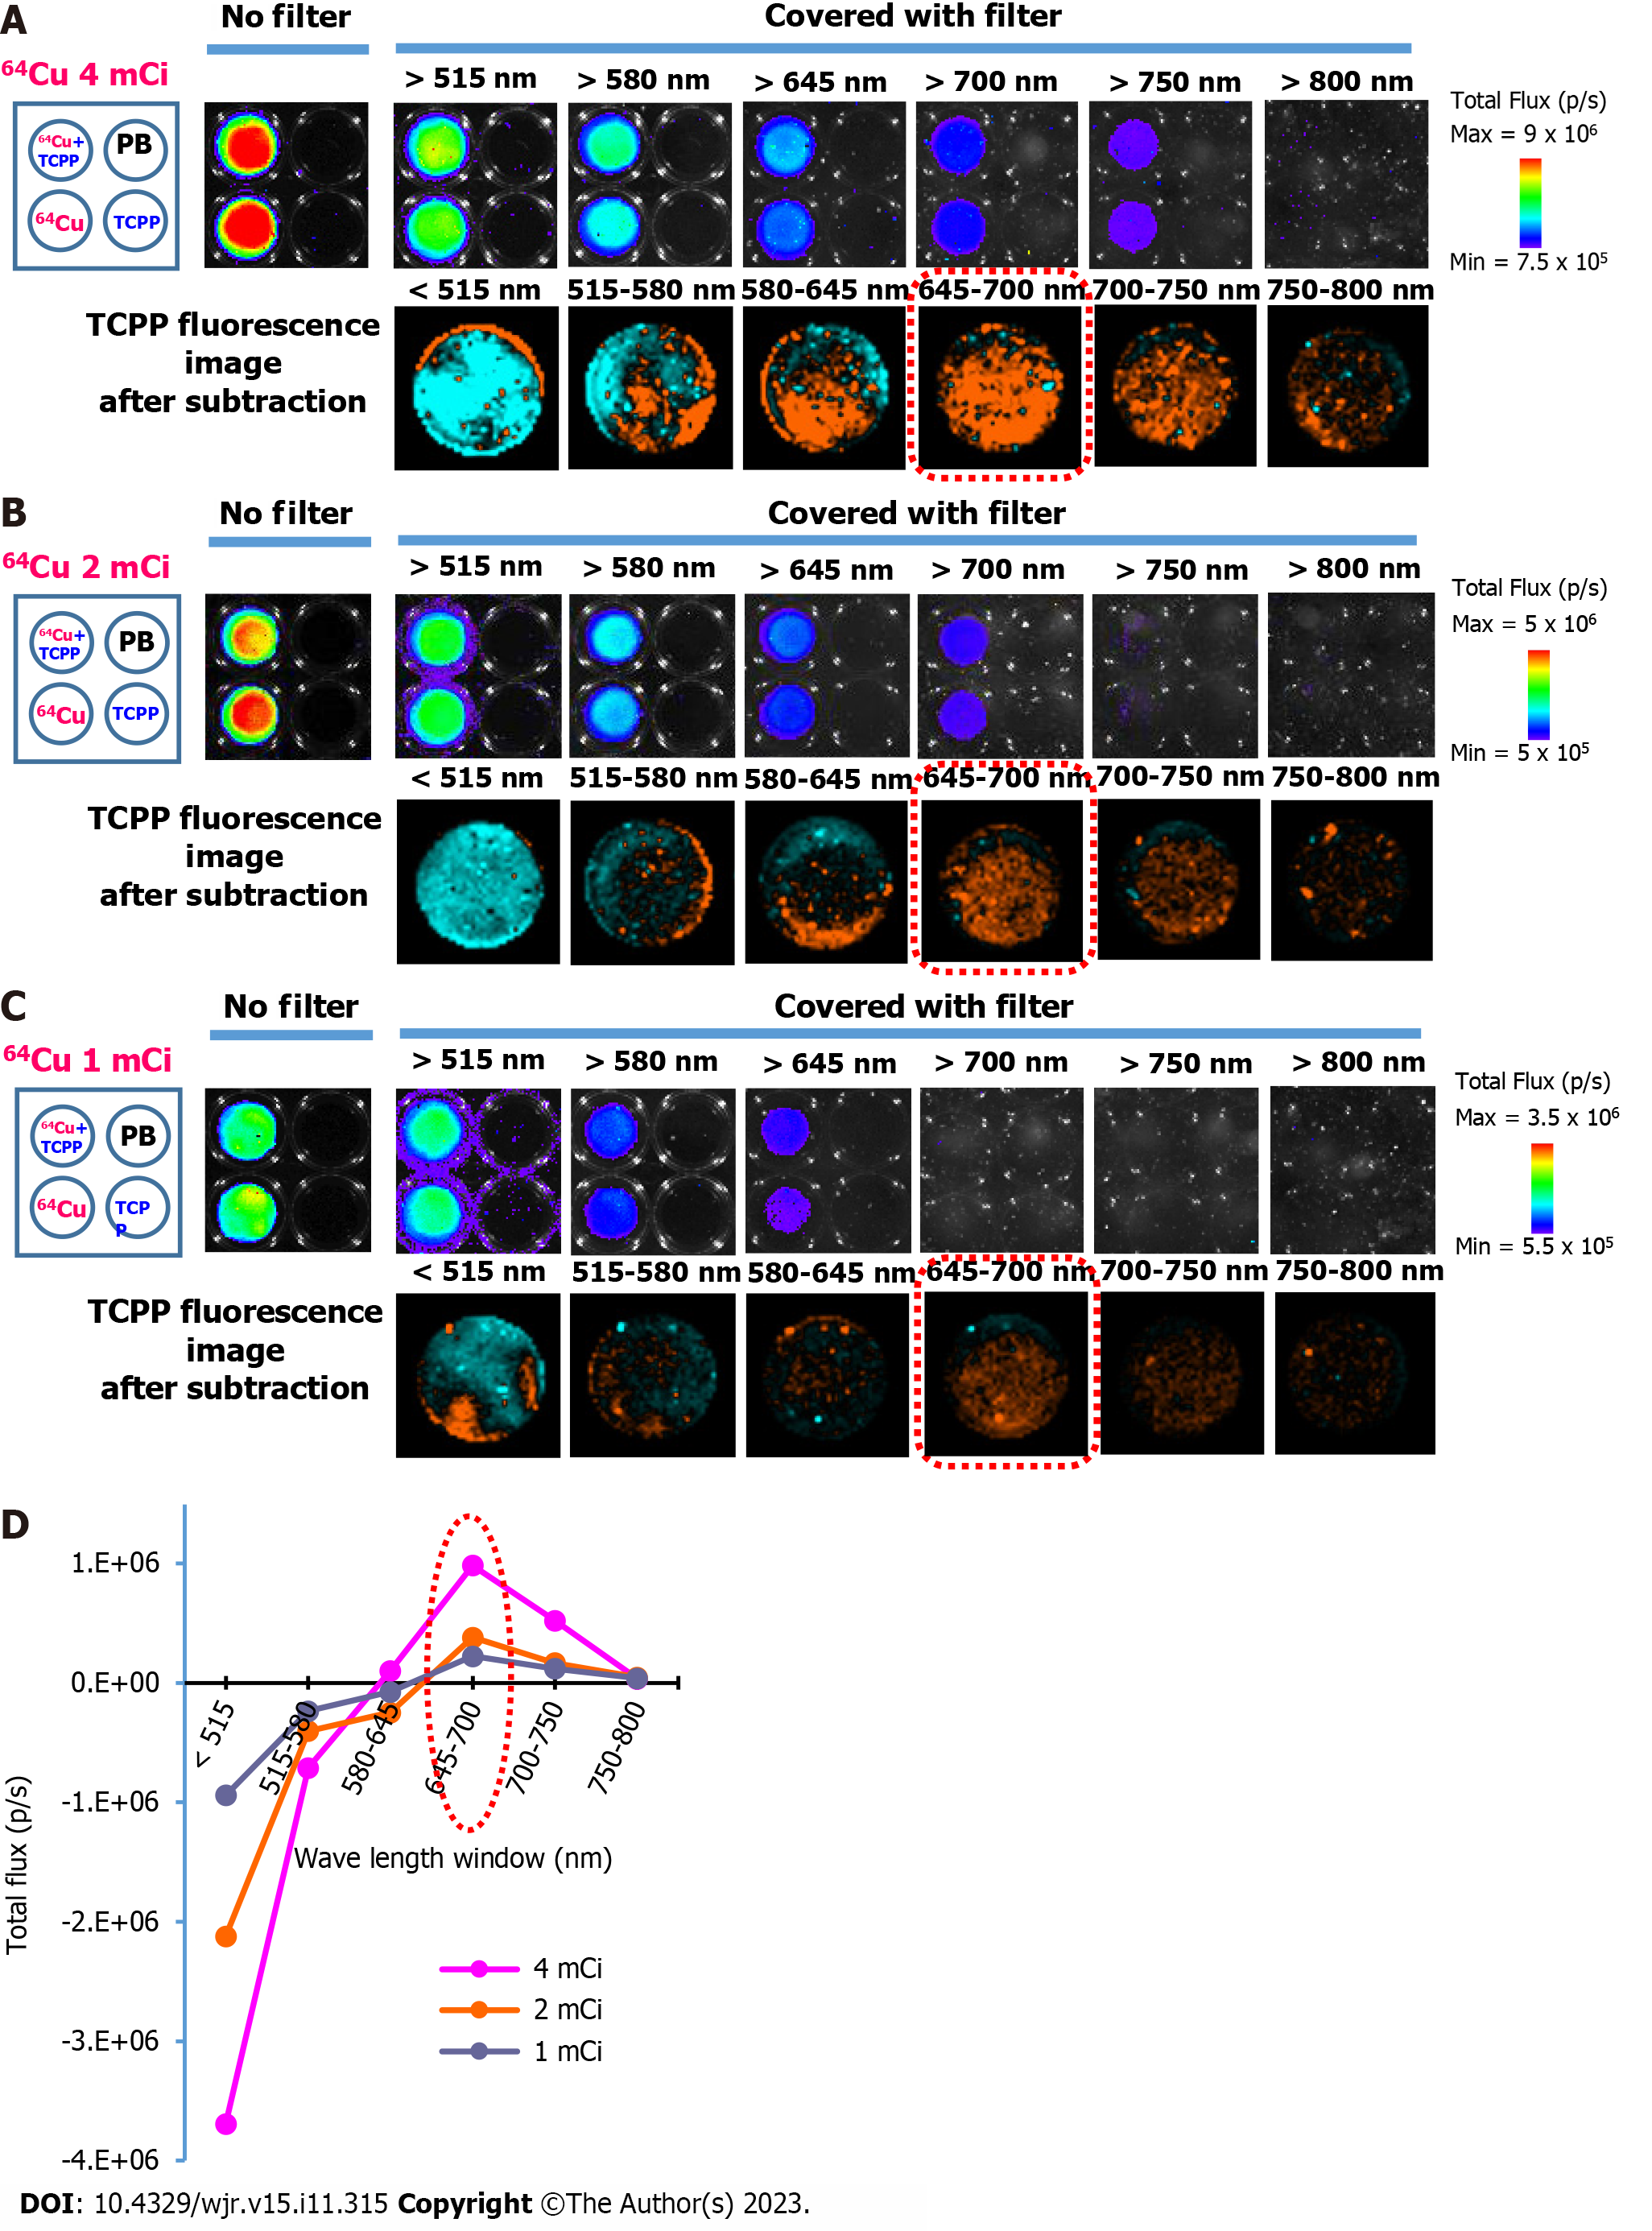
Figure 4 Detection of Cherenkov radiation and emission spectrum of tetrakis (4-carboxyphenyl) porphyrin induced by Cherenkov radiation.
A: Bioluminescence imaging of prepared samples 64CuCl2 (4 mCi) and 64CuCl2 (4 mCi) + tetrakis (4-carboxyphenyl) porphyrin (TCPP) (30 μmol/L) with or without covering by long-pass filters (upper row), and TCPP fluorescence image after subtraction in differential image analysis (lower row); B: Similar images acquired from the experiment using 64CuCl2 (2 mCi); C: Similar images acquired from the experiment using 64CuCl2 (1 mCi); D: TCPP fluorescence spectrum calculated by subtracting the total flux of 64CuCl2 from that of 64CuCl2 + TCPP. The spectral peak was found in the 645–700 nm window. The peak is indicated by the red dotted circle. 64Cu: 64CuCl2; PB: Phosphate buffer; μM: μmol/L.
- Citation: Aung W, Tsuji AB, Rikiyama K, Nishikido F, Obara S, Higashi T. Imaging assessment of photosensitizer emission induced by radionuclide-derived Cherenkov radiation using charge-coupled device optical imaging and long-pass filters. World J Radiol 2023; 15(11): 315-323
- URL: https://www.wjgnet.com/1949-8470/full/v15/i11/315.htm
- DOI: https://dx.doi.org/10.4329/wjr.v15.i11.315


