Copyright
©The Author(s) 2018.
World J Radiol. Aug 28, 2018; 10(8): 83-90
Published online Aug 28, 2018. doi: 10.4329/wjr.v10.i8.83
Published online Aug 28, 2018. doi: 10.4329/wjr.v10.i8.83
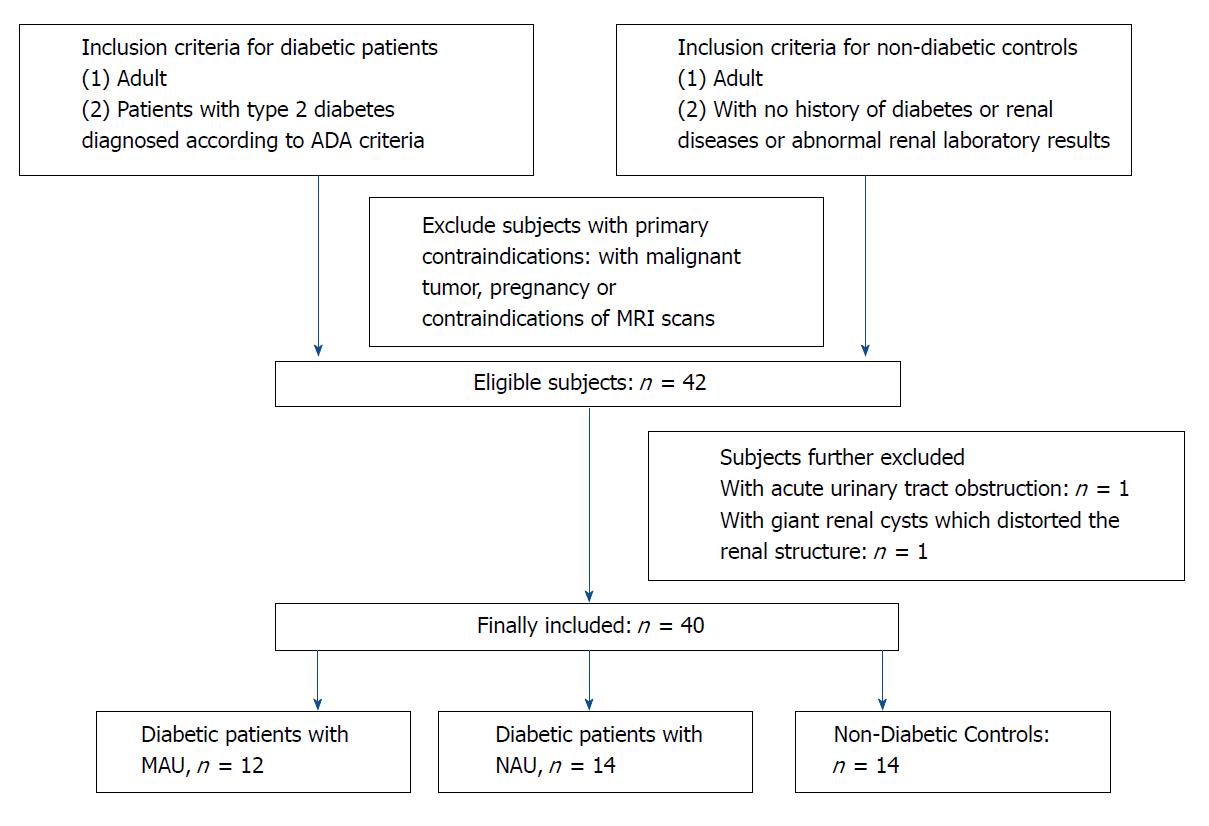
Figure 1 Flow diagram of subjects’ inclusion.
MAU: Microalbuminuria; NAU: Normoalbuminuria.
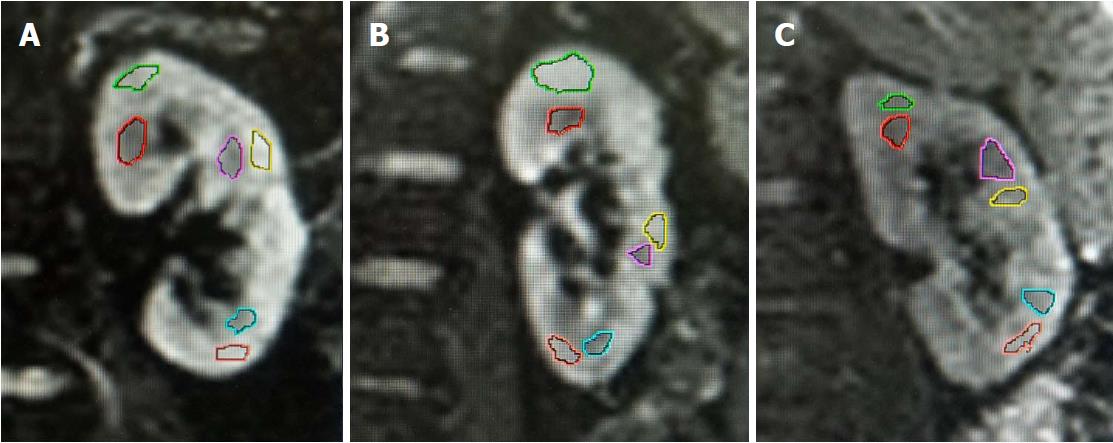
Figure 2 Regions of interests drawn on diffusion-weighted images (b = 0 s/mm2).
A: In a healthy kidney, mean cortical FA = 0.532 and mean medullary FA = 0.726; B: In a diabetic patient with NAU, mean cortical FA = 0.392 and mean medullary FA = 0.553; C: In a diabetic patient with MAU, mean cortical FA = 0.344 and mean medullary FA = 0.438. Note that no remarkable difference regarding the renal anatomic structure was observed among the three kidneys. FA: Fractional anisotropy; NAU: Normoalbuminuria; MAU: Microalbuminuria.
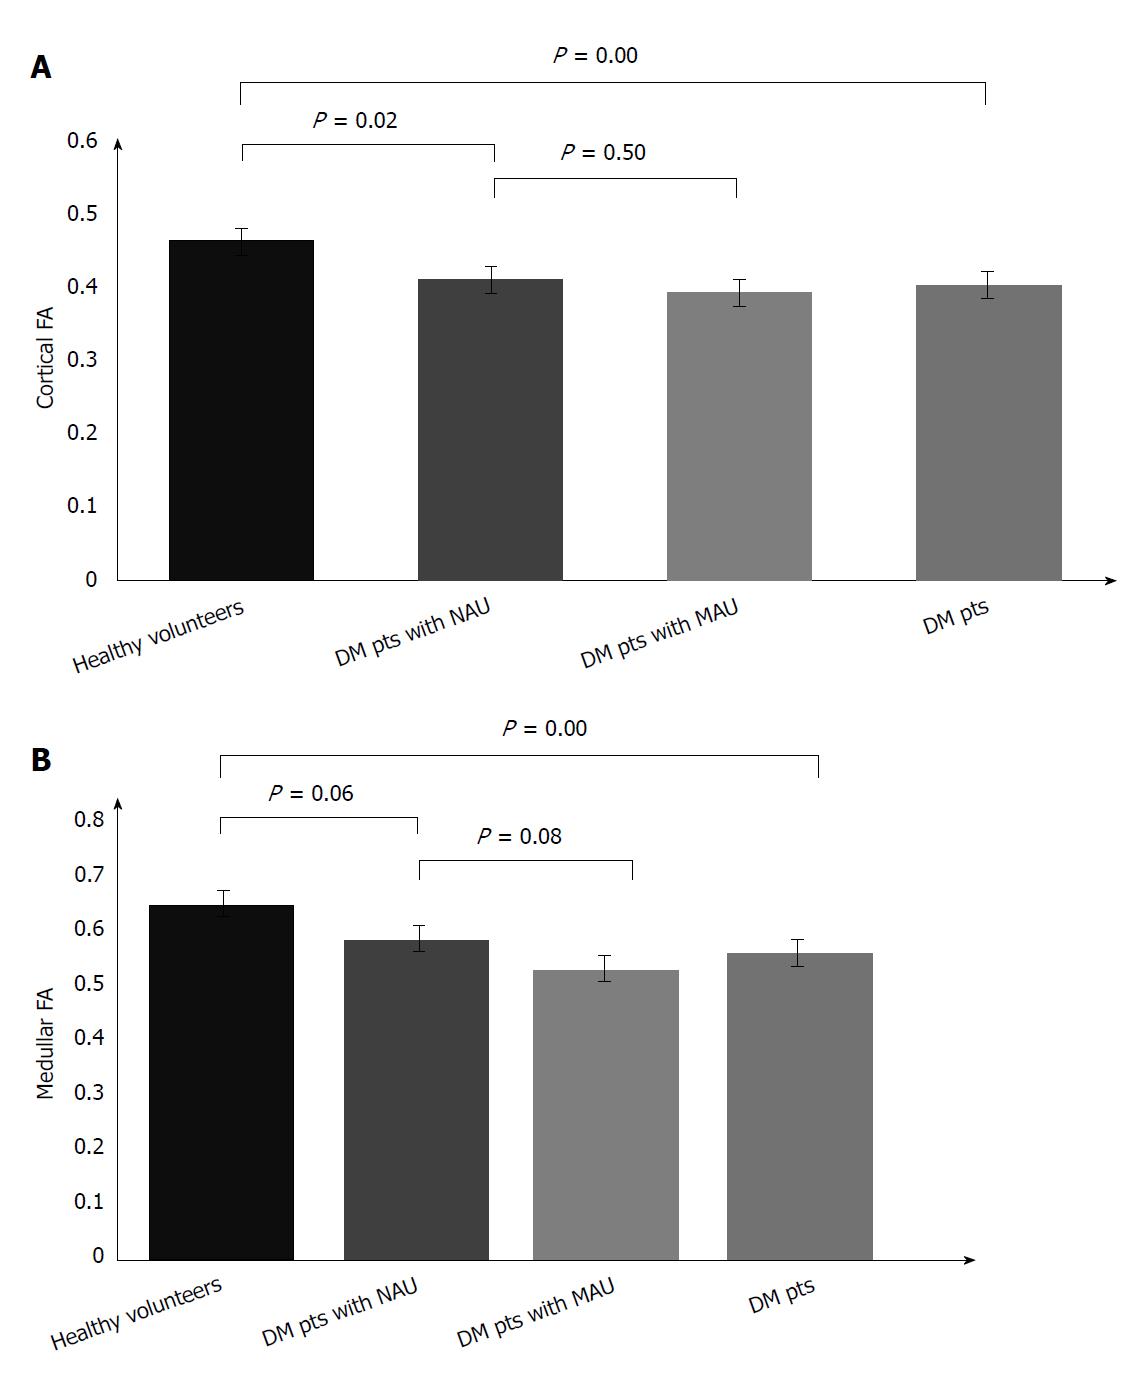
Figure 3 Cortical (A) and medullary (B) fractional anisotropy in different groups.
Diabetic patients with MAU had the lowest cortical and medullary FA. FA: Fractional anisotropy; DM: Diabetes Mellitus; Pts: Patients; NAU: Normoalbuminuria; MAU: Microalbuminuria.
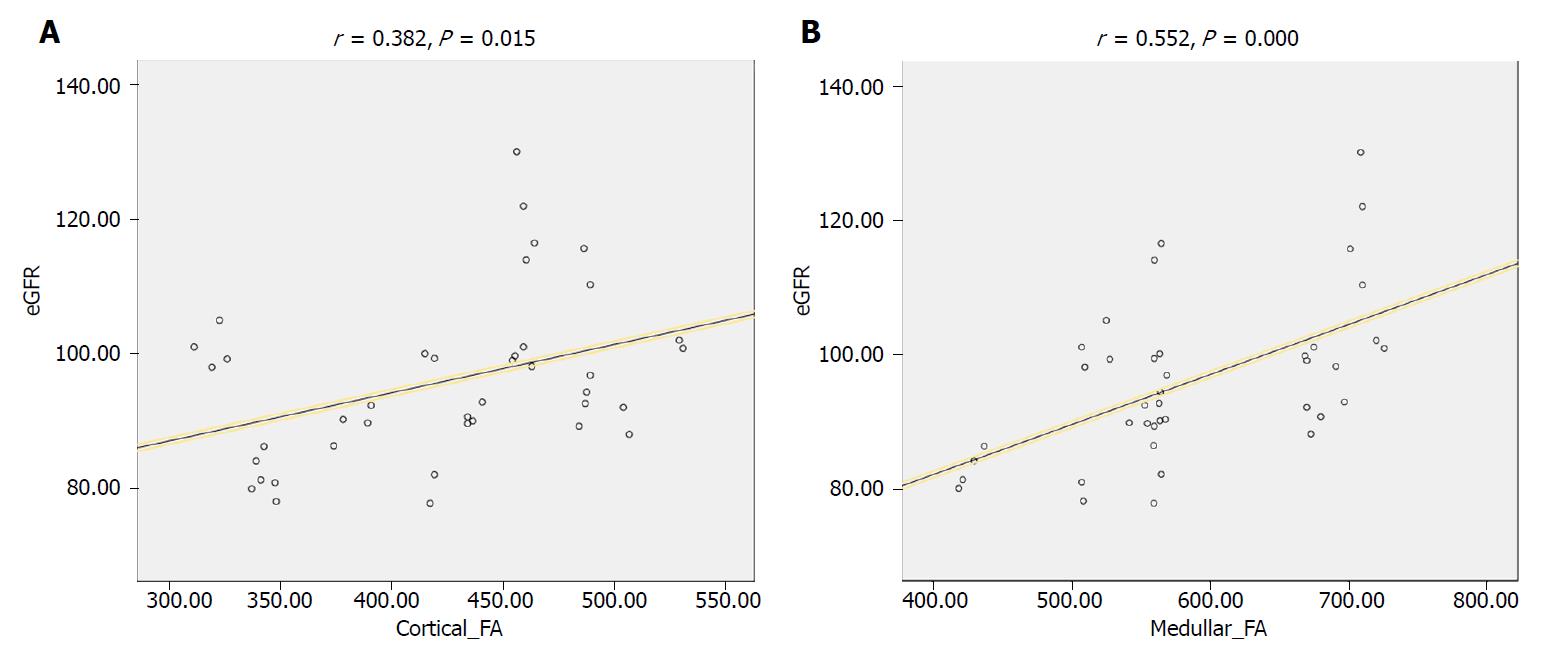
Figure 4 Scatter diagram for the correlation between fractional anisotropy and estimated glomerular filtration rate in included subjects.
A: Correlation between cortical FA and eGFR; B: Correlation between medullary FA and eGFR. FA: Fractional anisotropy; eGFR: Estimated glomerular filtration rate.
- Citation: Wang YT, Yan X, Pu H, Yin LL. In vivo evaluation of early renal damage in type 2 diabetic patients on 3.0 T MR diffusion tensor imaging. World J Radiol 2018; 10(8): 83-90
- URL: https://www.wjgnet.com/1949-8470/full/v10/i8/83.htm
- DOI: https://dx.doi.org/10.4329/wjr.v10.i8.83


