Copyright
©The Author(s) 2018.
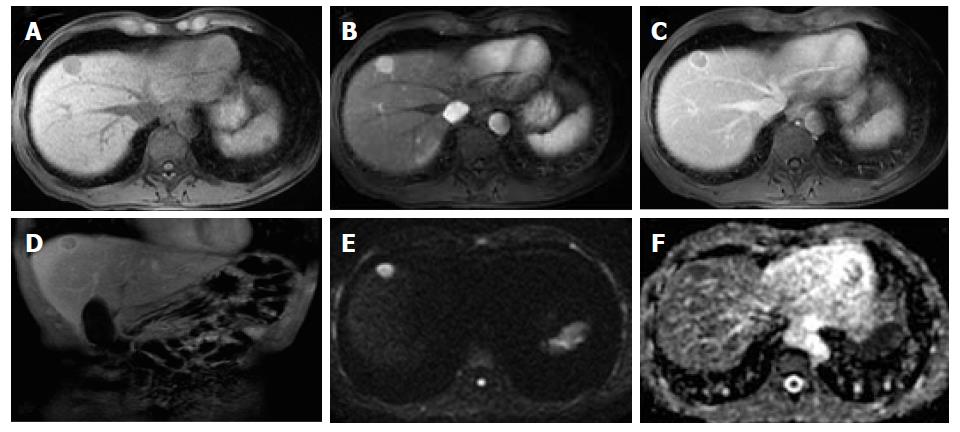
Figure 1 Classical hepatocellular carcinoma, in a patient with hepatitis B infection.
Pre-contrast (A) and post-contrast fat-suppressed 3D-GRE T1-weighted images during the late hepatic arterial (B) and delayed phases (C, D), respectively, diffusion weighted image (DWI) (B = 600); (E) and ADC map (F). A nodular lesion is depicted in the right liver lobe with mildly low T1 signal intensity (arrow, A) that shows hyperenhancement in the late arterial phase (B) and washout and pseudocapsule enhancement in the delayed phases (C, D). Note the bright signal intensity on the B was 600 of the DWI sequence (E) and low signal on the ADC map (F) consistent with restriction to diffusion. These are typical hepatocellular carcinoma (HCC) findings in a patient at risk for HCC.
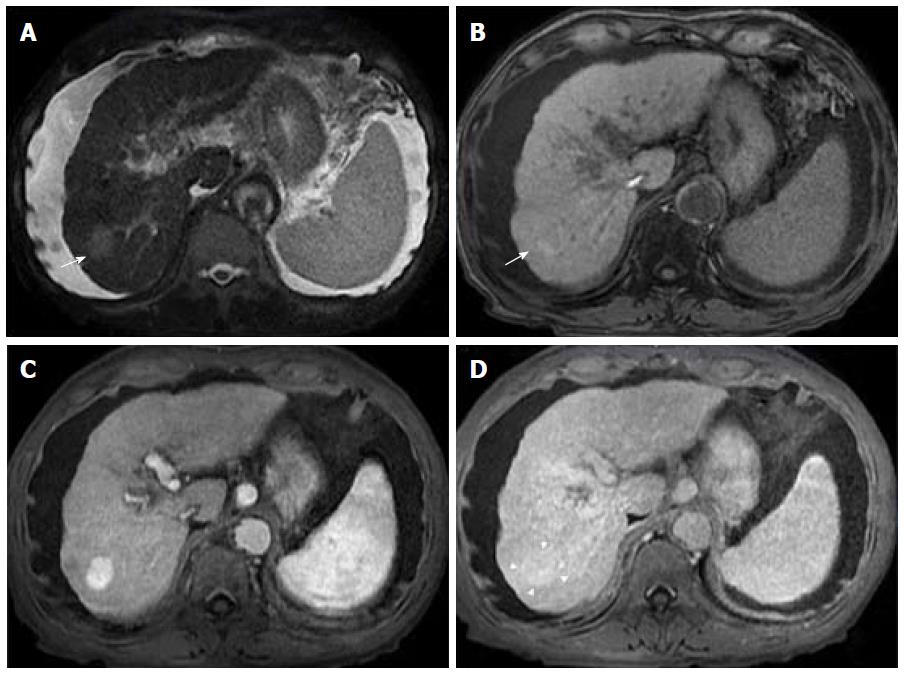
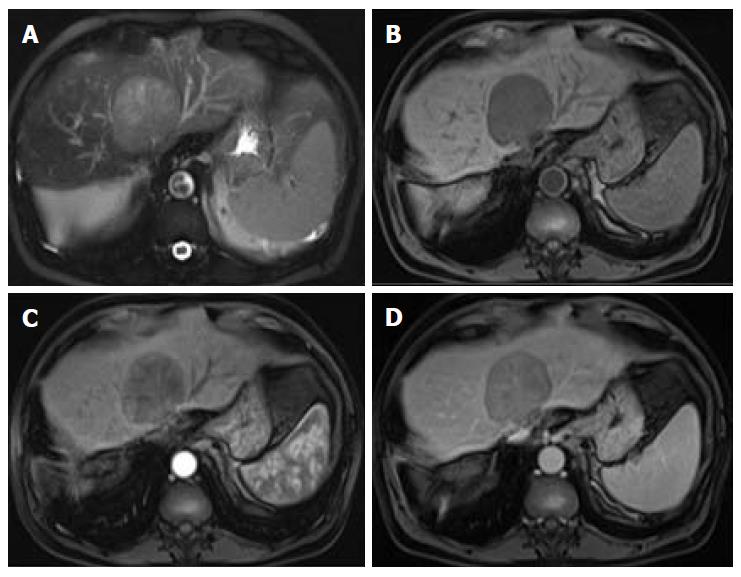
Figure 2 Late capsular enhancement/capsule appearance.
Fat-suppressed T2-weighted image (A), and pre- (B) and post-contrast fat-suppressed 3D-GRE T1-weighted images during the late hepatic arterial (C) and delayed phases (D). There is a 3 cm nodule in the right hepatic lobe, which demonstrates mildly high T2 signal intensity (arrow, A) and near iso T1 signal intensity on precontrast T1-weighted images (arrow, B). Arterial hyperenhancement is seen (C) and in the delayed phase, the nodule becomes isointense compared to the background liver, without definite washout (D). A thin peripheral rim of smooth hyperenhancement is seen in the delayed phase (D). Note that despite the lack of delayed washout the presence of late capsule enhancement allows a confident diagnosis of hepatocellular carcinoma.
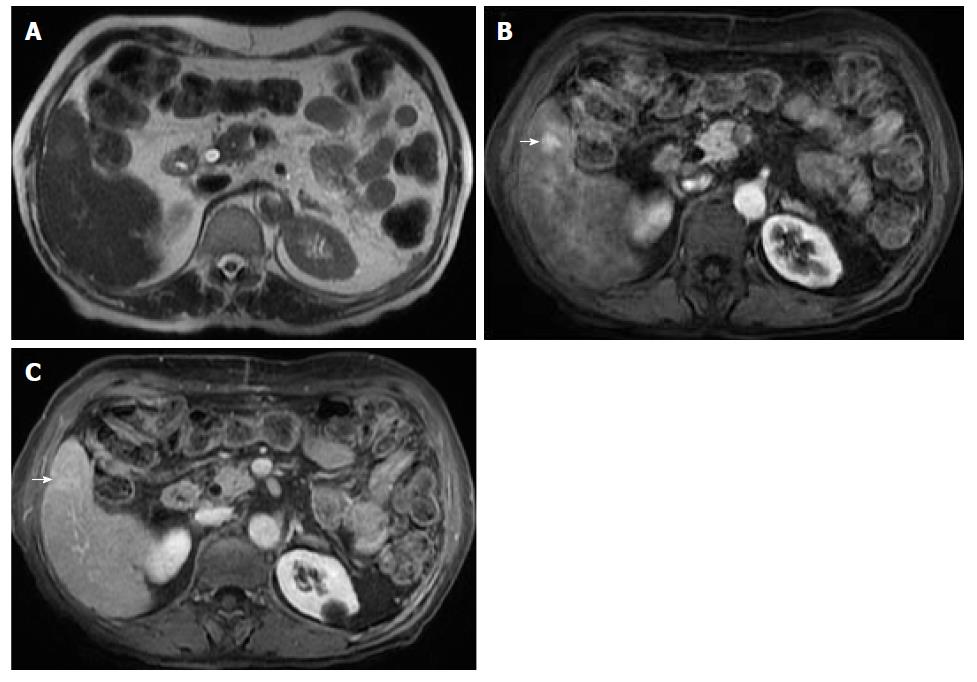
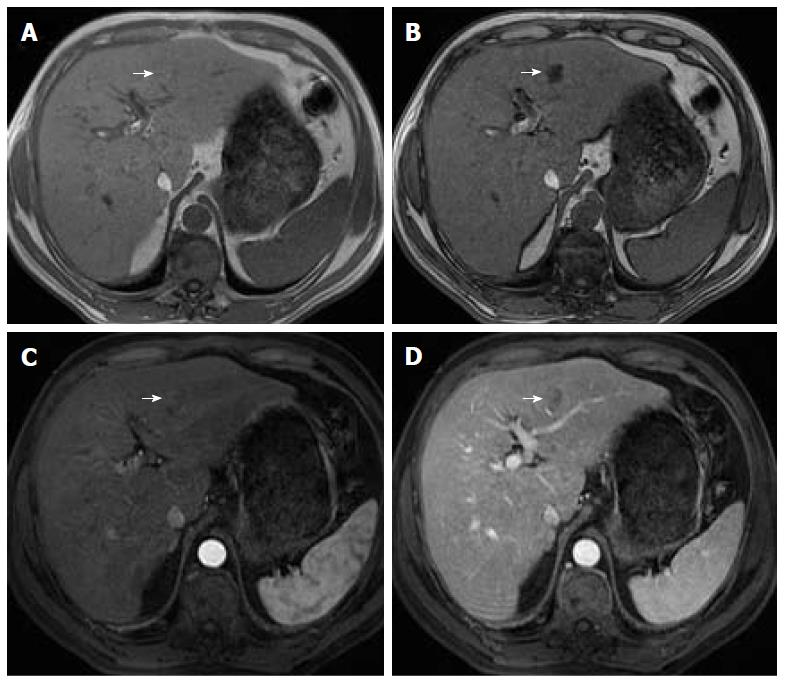
Figure 3 Small hepatocellular carcinoma without washout.
T2-weighted image (A), and post-contrast fat-suppressed 3D-GRE T1-weighted images during the late hepatic arterial (B) and delayed phase (C). A small nodule with mild signal increase on T2 weighed image is seen in the right liver lobe (A). It shows intense increased arterial hyperenhancement (arrow, B) and fading in subsequent phases without a clear washout in the delayed phase (C).
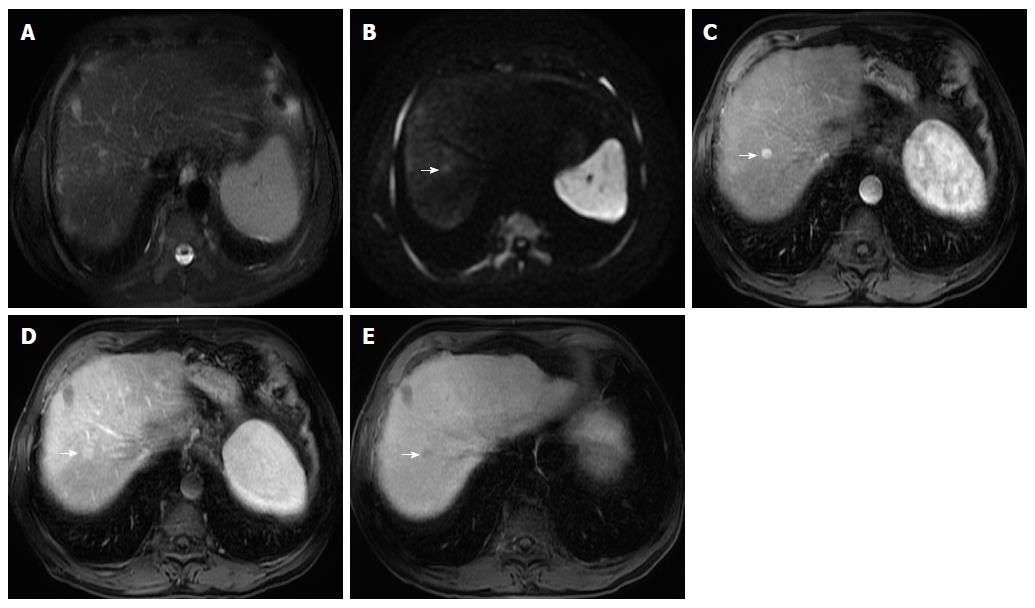
Figure 4 Small hepatocellular carcinoma.
Fat-suppressed T2-weighted image (A), diffusion-weighted image (DWI; B = 600) (B), and hepatobiliary contrast enhanced (gadobenate dimeglumine) fat-suppressed 3D-GRE T1-weighted images in the late hepatic arterial (C), delayed (D), and hepatobiliary phases (E). A small nodule in the right hepatic lobe is seen, showing near isointense signal on T2- weighted image (A) and mild high signal intensity on DWI (arrow, B). An increased arterial enhancement is seen (arrow, C), fading out in the delayed phase (D) and decreased uptake on the hepatobiliary phase (arrow, E). These findings are suspicious for malignancy. This nodule was ablated and histologically proven HCC.
Figure 5 Lesional fat-sparing, in a case of multifocal hepatocellular carcinoma in a cirrhotic liver.
Dual echo in- (A) and out-of-phase (B) 2D-GRE T1 weighted images, post-contrast fat-suppressed 3D-GRE T1-weighted images during the late hepatic arterial (C) and delayed phase (D). In a patient with cirrhosis and fatty infiltration, perceived as loss of signal intensity in the out-of-phase images (B) in comparison with the in-phase images (A), three lesions with lower fractional fat content than the background liver are seen with higher signal intensity (arrows, B). These lesions show arterial hyperenhancement (C) and washout and late capsule enhancement in the delayed phase (arrows, D), consistent with HCCs.
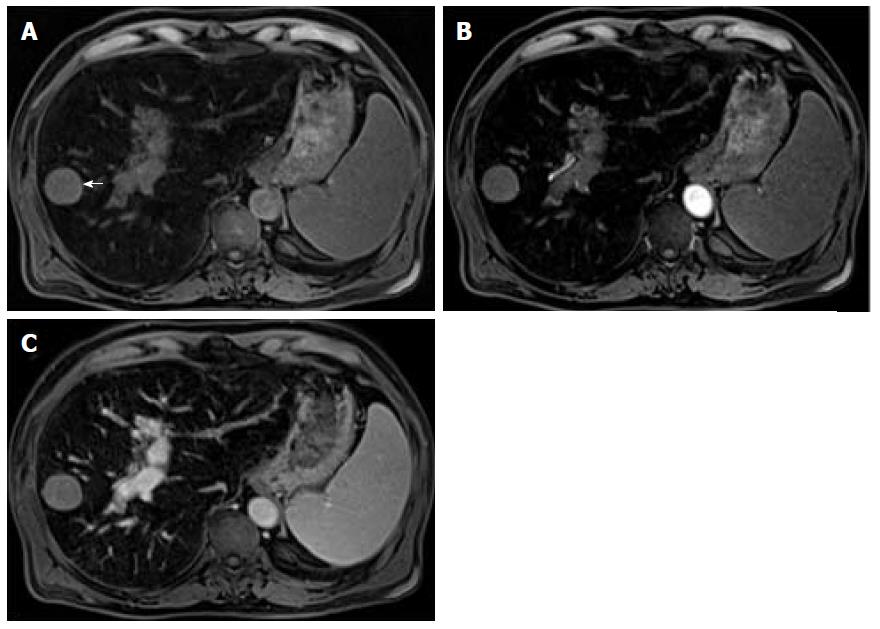
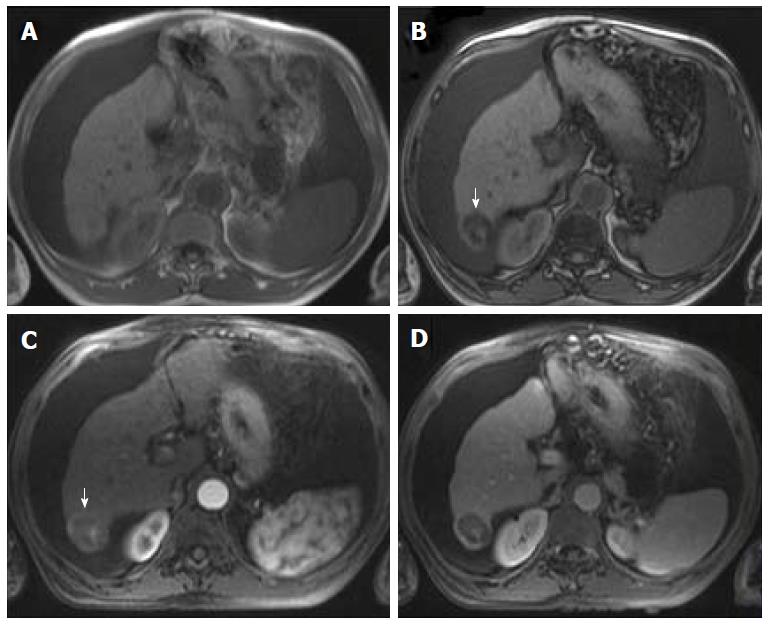
Figure 6 Lesional iron sparing.
Pre-contrast (A) and post-contrast fat-suppressed 3D-GRE T1-weighted images during the late hepatic arterial (B) and delayed (C) phases. An iron-overloaded cirrhotic liver shows marked signal loss on T1-weighted images. A non-siderotic nodule is seen in the right liver lobe (arrow, A). Dynamic evaluation is limited and does not allow a confident diagnosis of hepatocellular carcinoma (HCC). This nodule underwent biopsy and HCC was confirmed.
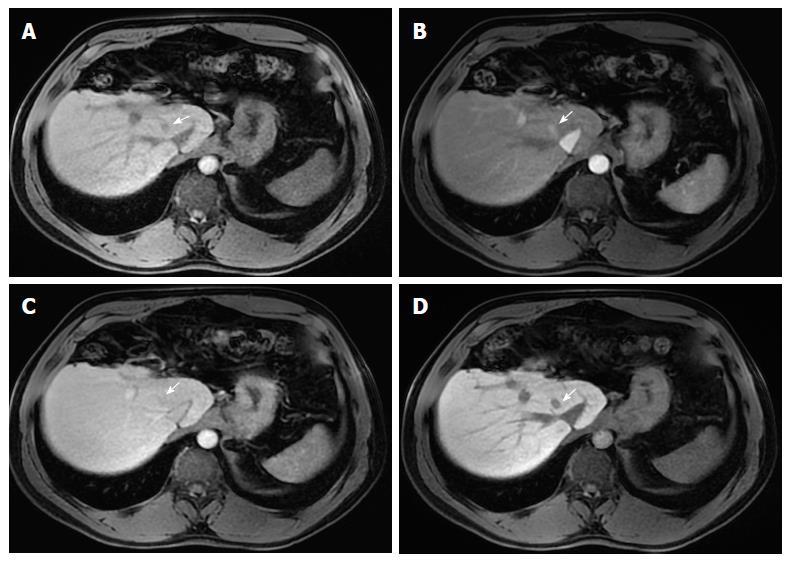
Figure 7 Small hepatocellular carcinoma in a patient with chronic liver disease and a previous left hepatectomy.
Pre- (A) and post-contrast (gadoxetate disodium) fat-suppressed 3D-GRE T1-weighted images in the arterial (B), delayed (C) and hepatobiliary phases (D). A small HCC is shown in segment VIII displaying mild low T1 signal intensity (arrow, A), arterial hyper-enhancement (arrow, B) and no appreciable washout on the delayed phase (arrow, C). Low signal intensity is noted on the hepatobiliary phase (arrow, D). This example proves the benefit of hepatobiliary contrast agents in further characterization of liver nodules in the setting of chronic liver disease.
Figure 8 Corona enhancement.
T2-weighted image (A), unenhanced in-phase T1-weighted GRE images (B), and post-contrast fat-suppressed 3D-GRE T1-weighted images during the late hepatic arterial (C) and delayed phases (D). A small nodule in the right hepatic lobe with near isointense T2 signal (A) and iso to hypointense T1 signal (B) shows heterogeneous arterial ring-like enhancement in the arterial phase. Enhancement of the peri-lesional parenchyma is recognized (arrow, C). This transient enhancement is known as corona enhancement and suggests a more aggressive course. Washout is seen on delayed phase images (D).
Figure 9 Intra-lesional fat in early hepatocellular carcinoma.
Dual echo in-phase (A) and out-of-phase (B) GRE T1 weighted images, and post-contrast fat-suppressed 3D-GRE T1-weighted images during late hepatic arterial (C) and delayed phase (D). A nodule is seen in the left hepatic lobe, which demonstrates intrinsic mild increased T1 signal on the in-phase images (arrow, A) and loss of signal on the out-of-phase images (arrow, B). This nodule shows heterogeneous mildly arterial hyperenhancement (arrow, C) and no washout is appreciable (arrow, D).
Figure 10 Fatty hepatocellular carcinoma.
Dual echo in-phase (A) and out-of-phase (B) GRE T1 weighted images and post-contrast fat-suppressed 3D-GRE T1-weighted images during late hepatic arterial (C) and delayed phase (D). A right hepatic lobe nodule shows loss of signal intensity on the out-of-phase (arrow, B) in comparison with the in-phase (A) images. This nodule shows heterogeneous arterial hyperenhancement (arrow, C) and a clear washout is appreciable (D) in keeping with fatty hepatocellular carcinoma.
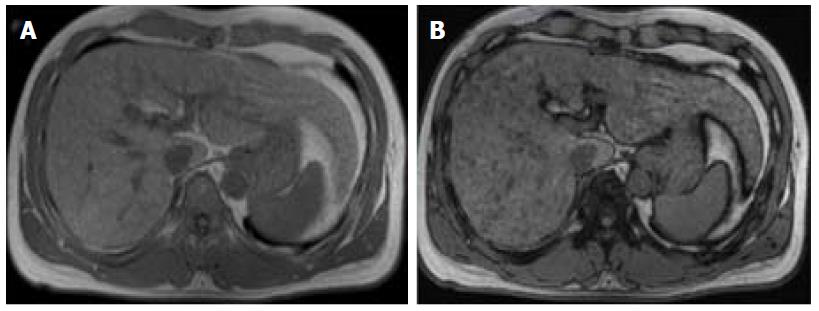
Figure 11 Fat-containing regenerative nodules.
Dual echo in-phase (A) and out-of-phase (B) GRE T1 weighted images. The presence of numerous fat-containing nodules measuring less than 10 mm is highly indicative of benign nature.
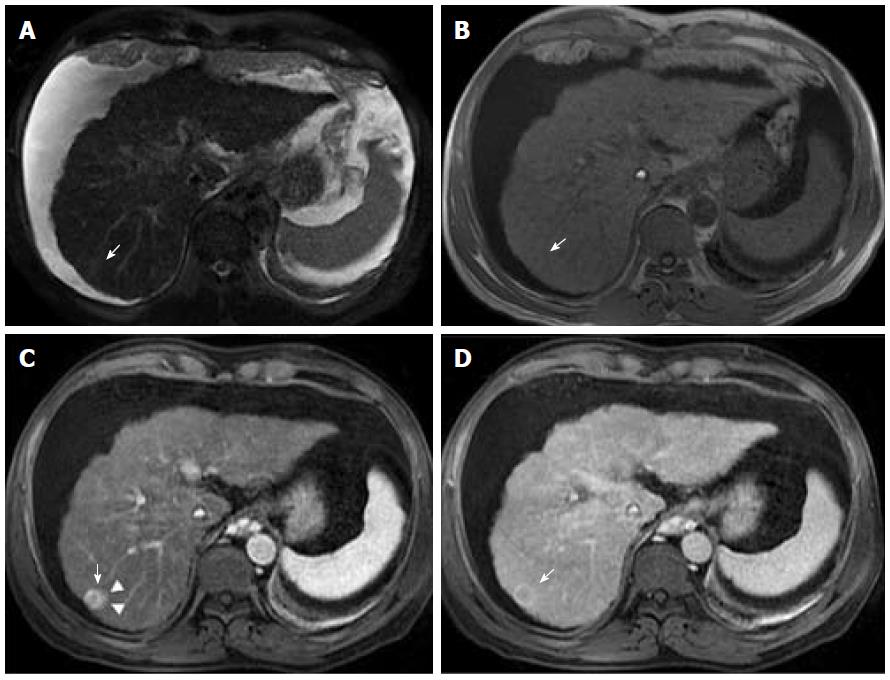
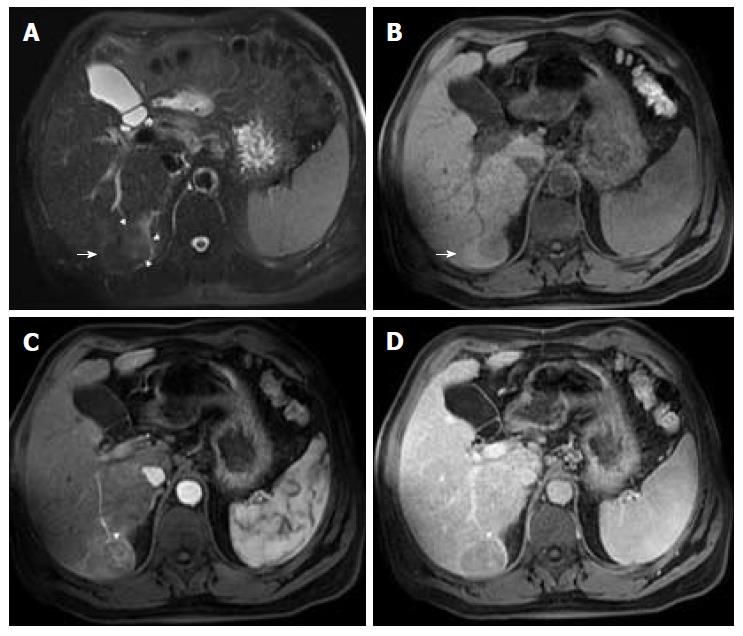
Figure 12 Nodule-in-nodule architecture.
Fat-suppressed T2-weighted image (A), pre- (B) and post-contrast fat-suppressed 3D-GRE T1-weighted images during the late hepatic arterial (C) and delayed phases (D). A small nodule within a larger nodule is seen in the right liver lobe (arrow A, B) showing distinct mild high signal intensity on the T2-weighted image (arrowheads, A), heterogeneous arterial hyperenhancement (arrowhead, C) and subtle washout (arrowhead, D). This imaging appearance is highly suggestive of a progressed hepatocellular carcinoma within a dysplastic nodule.
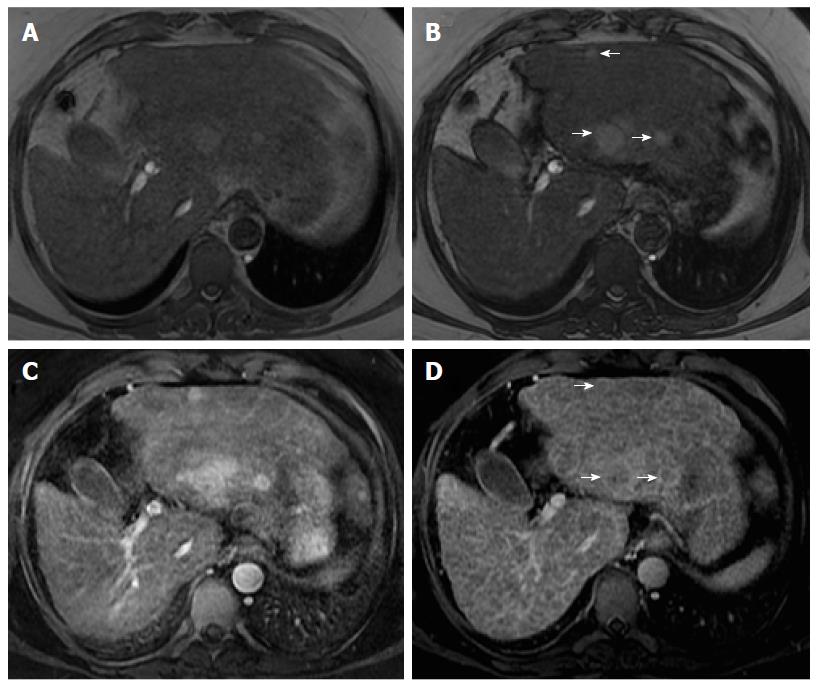
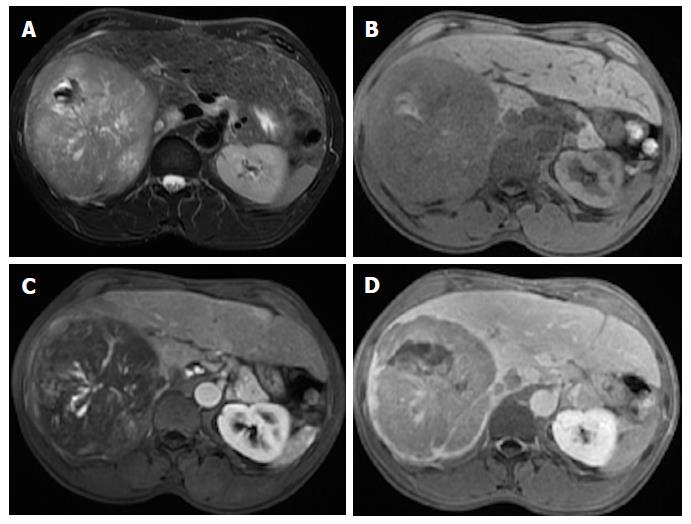
Figure 13 Mosaic architecture.
Fat-suppressed T2-weighted image (A), pre (B) and post-contrast fat-suppressed 3D-GRE T1-weighted images during the late hepatic arterial (C) and delayed (D) phases. A large mass showing randomly distributed internal compartments with different signal intensities on the T2 weighed image (A) and variable enhancement patterns on the late arterial (C) and delayed phases (D). This is an extremely unusual feature in non- hepatocellular carcinoma (HCC) tumors. In large, arterial hyperenhancement might be more difficult to recognize and as in this case and the presence of mosaic architecture aids in the diagnosis of HCC.
Figure 14 Blood products in a large hepatocellular carcinoma.
Fat-suppressed T2-weighted image (A), pre- (B) and post-contrast fat-suppressed 3D-GRE T1-weighted images during the late hepatic arterial (C) and delayed (D) phases. Intralesional areas of high T1 signal intensity images (B) and predominantly low T2 signal intensity (A) can be seen. Thick intralesional arteries are appreciated during the arterial phase (C) and delayed washout and capsular enhancement is also demonstrated (D) in keeping with partly hemorrhagic HCC.
- Citation: Campos-Correia D, Cruz J, Matos AP, Figueiredo F, Ramalho M. Magnetic resonance imaging ancillary features used in Liver Imaging Reporting and Data System: An illustrative review. World J Radiol 2018; 10(2): 9-23
- URL: https://www.wjgnet.com/1949-8470/full/v10/i2/9.htm
- DOI: https://dx.doi.org/10.4329/wjr.v10.i2.9


