Copyright
©The Author(s) 2017.
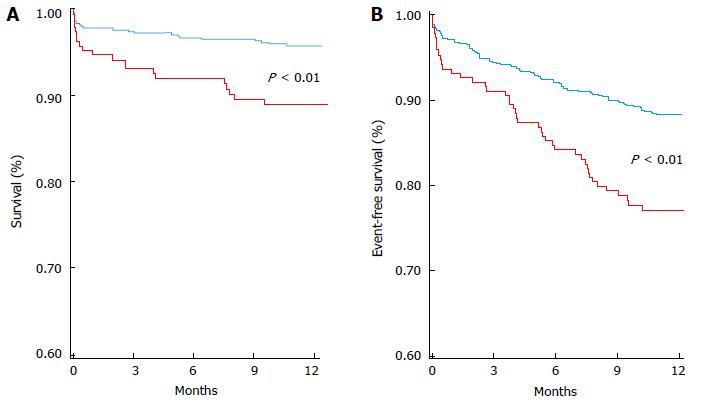
Figure 1 Kaplan-Meier curve analysis stratified according to vitamin D levels.
The lowest quartile (red line) vs the other three quartiles pooled together (blue line) for 1-year mortality (A), and for the combined end point1 (B), in the whole study population. P value by Log rank test. Reproduced from De Metrio et al[12]. 1Combined end point: death, major bleeding (requiring blood transfusion), acute pulmonary edema, cardiogenic shock, clinically significant tachyarrhythmias and bradyarrhythmias, and acute kidney injury.
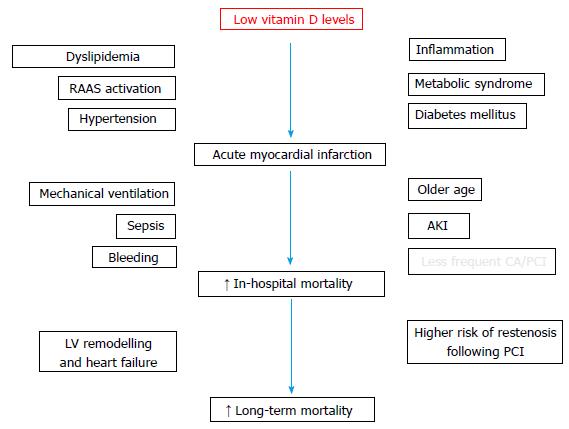
Figure 2 Potential factors impacting on acute myocardial infarction occurrence and outcome associated with low vitamin D levels.
AKI: Acute kidney injury; CA/PCI: Coronary angiography/percutaneous coronary intervention; LV: Left ventricular; RAAS: Renin-angiotensin-aldosterone system.
- Citation: Milazzo V, De Metrio M, Cosentino N, Marenzi G, Tremoli E. Vitamin D and acute myocardial infarction. World J Cardiol 2017; 9(1): 14-20
- URL: https://www.wjgnet.com/1949-8462/full/v9/i1/14.htm
- DOI: https://dx.doi.org/10.4330/wjc.v9.i1.14


