Copyright
©The Author(s) 2016.
World J Cardiol. Sep 26, 2016; 8(9): 553-558
Published online Sep 26, 2016. doi: 10.4330/wjc.v8.i9.553
Published online Sep 26, 2016. doi: 10.4330/wjc.v8.i9.553
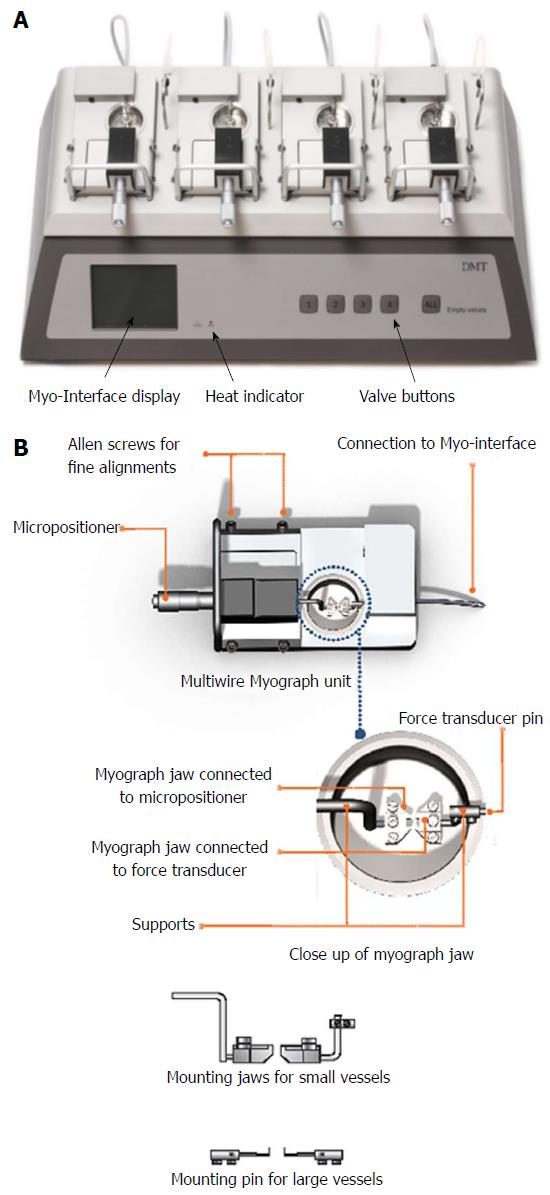
Figure 1 Multiwire Myograph System (DMT 620 M) (A) and Multiwire Myograph Unit (B).
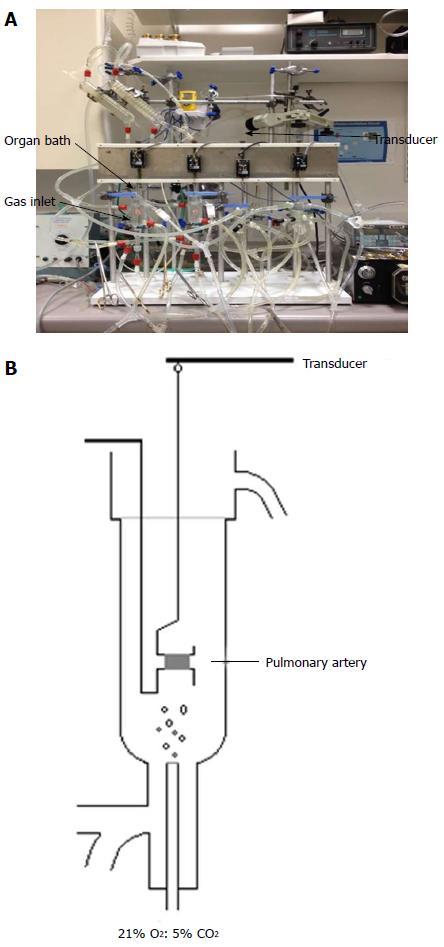
Figure 2 Radnotti (A) and Schematic (B) Organ Bath system.
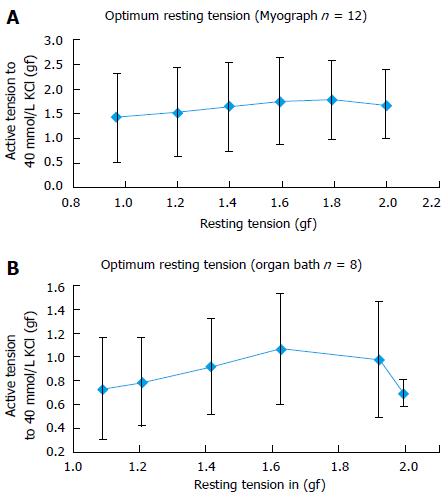
Figure 3 Measurement of Optimal Resting Tension using Multi-wire Myograph (A) and Organ Bath system (B).
A: Total 12 PA rings from four patients were used to perform the experiment. Increasing the resting tension from 1.0 gf to 1.6 gf significantly augmented the 40 mmol/L KCl induced active tension. Increasing the active tension from 1.6 to 2.0 gf initially plateaued off than decreased the 40 mmol/L KCl induced response; B: Total 8 PA rings from four patients were used to perform the experiment. Increasing the resting tension from 1.0 to 1.6 gf significantly augmented the 40 mmol/L KCl induced active tension. Increasing the active tension from 1.6 to 2.0 gf either decreased the 40 mmol/L KCl induced response.
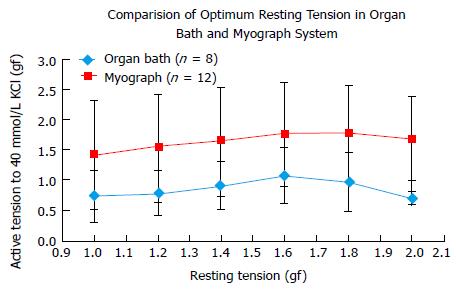
Figure 4 Comparison of Optimal Resting Tension measurement in Organ Bath and Myograph system.
Total 20 PA rings from four patients were used to perform the experiment. Increasing the resting tension from 1.0 to 1.6 gf significantly augmented the 40 mmol/L KCl induced active tension. Increasing the active tension from 1.6 to 2.0 gf either decreased or plateaued off the 40 mmol/L KCl induced response. Both organ bath and myograph shows similar result and confirmed that radial optimal resting tension for human pulmonary artery ring was 1.61 g.
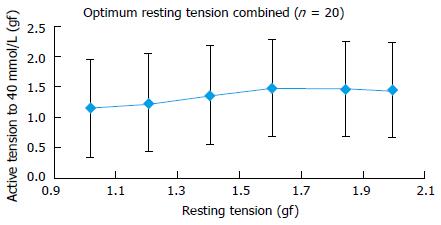
Figure 5 Combined result of optimal resting tension measurement.
Total 20 PA rings from four patients were used to perform the experiment. Increasing the active tension from 1.6 to 2.0 gf decreased the 40 mmol/L KCl induced response. The radial optimal resting tension for human pulmonary artery ring measured was 1.61 g. PA: Pulmonary artery.
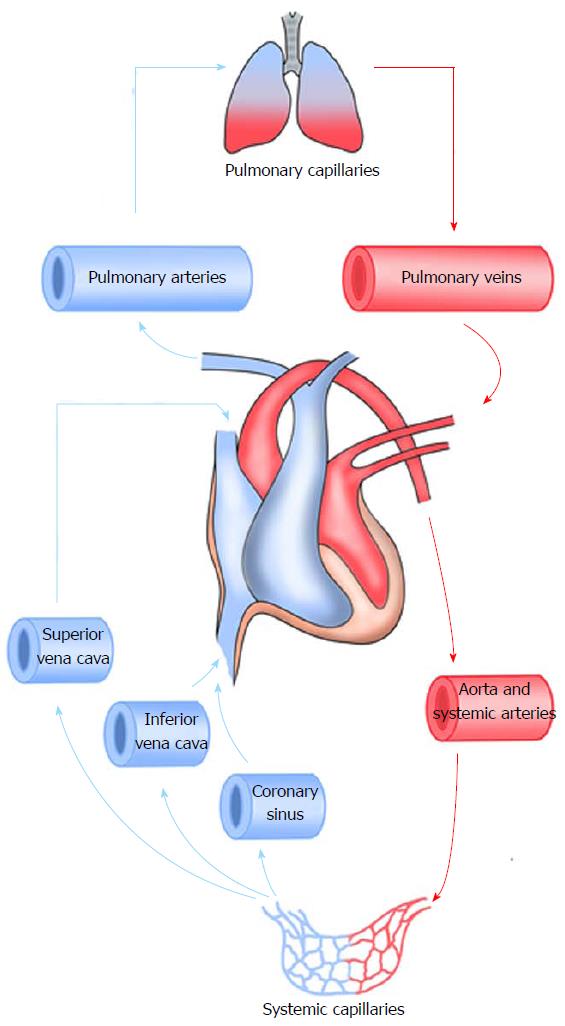
Figure 6 Schematic representation of pulmonary circulation.
- Citation: Hussain A, Bennett RT, Chaudhry MA, Qadri SS, Cowen M, Morice AH, Loubani M. Characterization of optimal resting tension in human pulmonary arteries. World J Cardiol 2016; 8(9): 553-558
- URL: https://www.wjgnet.com/1949-8462/full/v8/i9/553.htm
- DOI: https://dx.doi.org/10.4330/wjc.v8.i9.553


