Copyright
©2014 Baishideng Publishing Group Inc.
World J Cardiol. Sep 26, 2014; 6(9): 890-907
Published online Sep 26, 2014. doi: 10.4330/wjc.v6.i9.890
Published online Sep 26, 2014. doi: 10.4330/wjc.v6.i9.890
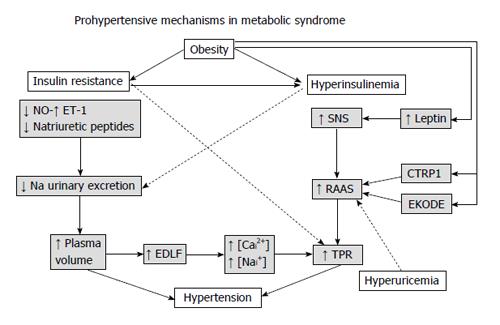
Figure 1 Hypothetical mechanisms by which the metabolic syndrome may lead to high blood pressure.
NO: Nitric oxide; ET-1: Endothelin-1; SNS: Sympathetic nervous system; RAAS: Renin-angiotensin-aldosterone system; CTRP1: Complement-C1q tumor necrosis factor-related protein 1; EKODE: Epoxy-keno derivative of linoleic acid; TPR: Total peripheral resistance; EDLF: Endogenous digoxin-like factor; [Cai2+]: Intracellular concentration of calcium; [Nai+]: Intracellular concentration of sodium.
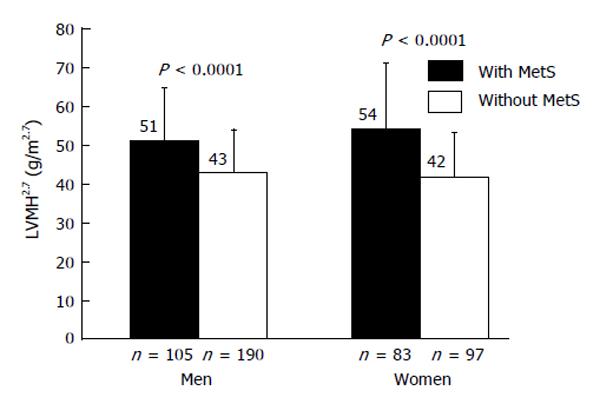
Figure 2 Mean values of left ventricular mass indexed for height2.
7 in hypertensive men and women with and without the metabolic syndrome[91]. LVMH2.7: Left ventricular mass indexed for height2.7; MetS: Metabolic syndrome.
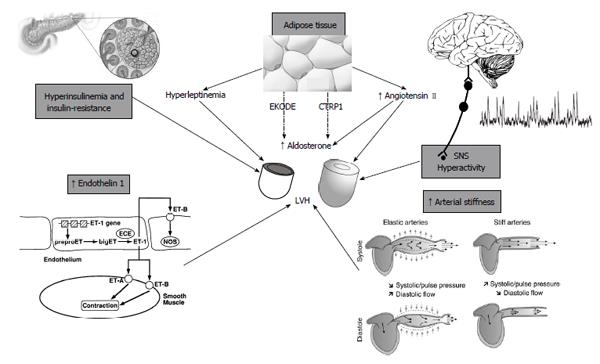
Figure 3 Putative mechanisms by which metabolic syndrome promotes left ventricular hypertrophy.
SNS: Sympathetic nervous system; CTRP1: Complement-C1q Tumor necrosis factor-related protein 1; EKODE: Epoxy-keto derivative of linoleic acid; LVH: Left ventricular hypertrophy.
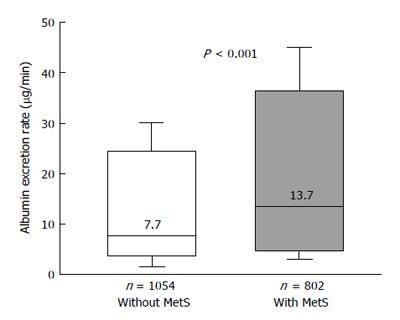
Figure 4 Box plots showing urinary albumin excretion rates in nondiabetic hypertensives participating in the Renal Dysfunction in Hypertension study[39], divided in subjects with and without the metabolic syndrome.
In the Box-and-Whisker plots, the central boxes represent the interquartile range (25th to 75th percentile). The middle lines, and the numbers above these lines, represent the median values. Lower and upper whiskers extend to 5th and 95th percentile. MetS: Metabolic syndrome.
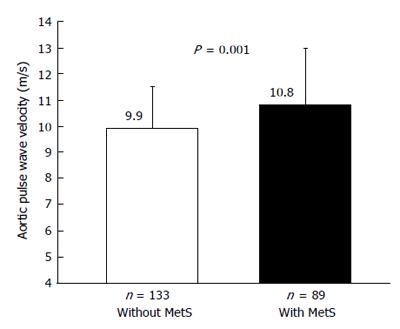
Figure 5 Mean values of aortic pulse wave velocity in untreated hypertensive subjects with and without the metabolic syndrome[76].
MetS: Metabolic syndrome.
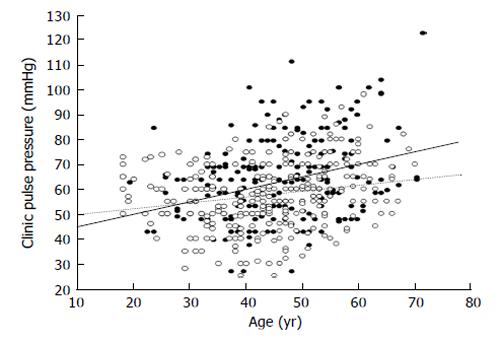
Figure 6 Scatterplot showing the relationship between age and pulse pressure in subjects with (black circles) and in those without (white circles) metabolic syndrome.
The calculated regression lines for the former (continuous line) and the latter patients (dotted line) were also shown. The difference regarding the slopes of the two regression lines was statistically significant (P = 0.01).
- Citation: Mulè G, Calcaterra I, Nardi E, Cerasola G, Cottone S. Metabolic syndrome in hypertensive patients: An unholy alliance. World J Cardiol 2014; 6(9): 890-907
- URL: https://www.wjgnet.com/1949-8462/full/v6/i9/890.htm
- DOI: https://dx.doi.org/10.4330/wjc.v6.i9.890


